A Rework Reduction Mechanism in Complex Projects Using Design Structure Matrix Clustering Methods
2019-06-04XUHaiyanZHAOShinanAminMAHMOUDIMohammadRezaFEYLIZADEH
XU Haiyan,ZHAO Shinan*,Amin MAHMOUDI,Mohammad Reza FEYLIZADEH
1.College of Economics and Management,Nanjing University of Aeronautics and Astronautics,Nanjing 211106,P.R.China;2.Department of Industrial Engineering,Shiraz Branch,Islamic Azad University,Shiraz,Iran
Abstract: To reduce the uncertainty and reworks in complex projects,a novel mechanism is systematically developed in this paper based on two classical design structure matrix(DSM)clustering methods:Loop searching method(LSM)and function searching method(FSM). Specifically,the optimal working areas for the two clustering methods are first obtained quantitatively in terms of non-zero fraction(NZF)and singular value modularity index(SMI),in which the whole working area is divided into six sub-zones. Then,a judgement procedure is proposed for conveniently choosing the optimal DSM clustering method,which makes it easy to determine which DSM clustering method performs better for a given case. Subsequently,a conceptual model is constructed to assist project managers in effectively analyzing the network of projects and greatly reducing reworks in complex projects by defining preventive actions. Finally,the aircraft design process is presented to show how the proposed judgement mechanism can be utilized to reduce the reworks in actual projects.
Key words: project management; design structure matrix; loop searching method; function searching method;reworks.
0 Introduction
Project management plays a crucial role in modern industries,but the increasing complexity of projects makes it difficult for project managers to employ traditional project management techniques.Graphical methods used to be the most useful tool to conveniently understand the structure and complexity of a project. However,they cannot be utilized to reduce unnecessary iterations and reworks in complex projects. To make up the limitations of graphical methods,the design structure matrix(DSM)approach was first put forward by Steward[1]. Then,the Design Manager’s Aid for Intelligent Decomposition(DeMAID)was initially proposed by NASA in 1989[2],followed by genetic algorithm(GA)DeMAID in 1996[3]. This method can efficiently save time and reduce the cost of aircraft projects by ordering the activities[4]. Moreover,the activity-based DSM method helps project managers not only fully understand the organization of complex projects but also conveniently cluster the activities[5-7]. Activity clustering,which puts the activities into clusters or modules,is an attractive method for project managers and project-based organizations. The modules can be shared among different projects with a similar type to save capital expenses[8-9]. Alternatively,design re-use can be utilized to reduce cycle time and increase revenue[9-10].
Modularity has gained considerable attention thanks to its profitable advantage,although full modular architecture is very difficult to achieve in most processes or systems[11-14]. Using a binary DSM representation of a system or product,Hölttä-Otto and De Weck[11]developed the non-zero fraction(NZF)and singular value modularity index(SMI)to capture the sparsity of the interrelationships between components and the degree of internal coupling between zero and one,respectively.However,they did not further discuss the other application of the two metrics.
In this paper,the existing DSM clustering methods are divided into two classes:Loop searching method(LSM)[15-17]based on graph theory and the function searching method(FSM)[18-21]founded on heuristic algorithms. Although various clustering methods are designed for different purposes,few of them can be utilized to analyze and compare the characteristics of the two classes and to determine whether clustering can be improved using appropriate techniques. Hence,a judgment approach is developed in this research for conveniently choosing the optimal DSM clustering method and greatly reducing the uncertainty and reworks in complex projects.
1 DSM and Reworks in Project Management
Project management involves the application of knowledge,skills,tools and techniques to project activities in order to fulfill project requirements. According to the existing standards[22]in project management,projects have three typical characteristics:Temporariness;production of a specific and unique product;cost,time and quality constraints. An important characteristic in project management is called progressive elaboration,which allows more detailed and specific information to be added to coarse-grained project plans in an incremental way.As shown in Fig.1 at the beginning phases,our knowledge of projects is at the lowest level while the project risk is at the highest possible level[23].With our knowledge increasing,the project risk is gradually reducing.

Fig.1 Progressive elaboration in project management
Once the project work breakdown structure(WBS)is created and the work packages at the last WBS level are specified,the activities of a project are determined. Due to the uncertainty in the initial phases of projects,the probability of creating reworks always exists in research and product improvement projects,which causes loops in project management networks. The existing project management techniques such as CPM,PERT and CCPM,however,cannot be utilized to analyze the networks with loops since these methods do not support loops,and some advanced techniques,such as GERT support loops,are infeasible in a big project due to the complicated computation[24]. Hence,DSM is an appropriate tool for dealing with these problems.
1.1 DSM representation of a project
There are three types of dependencies between two activities as shown in Fig.2[10,25].

Fig.2 Three types of dependencies between two activities
The relationships between two activities in Fig.2 can be conveniently represented by a DSM,as illustrated in Fig.3 where each of the rows and columns refers to a design activity. In Fig.3,a dot“ ●”in a cell means that the design activity in the row is dependent on the design activity in the corresponding column. Moreover,the dots can represent data structures and data format in the data transaction. In a similar way,the numbers in the diagonal demonstrate the data structure and define the characteristics of the design activity.
With the sequence of design activities in DSM,in order of execution,useful information can be obtained. As indicated in Fig.4,the dots above the diagonal indicate the design activities which are not produced yet,while dots below the diagonal are produced by the previous design activities. Further,activities B,C,and D are regarded as a cluster because of strong relationships among them. Meanwhile,the activities A and B do not depend on each other,so they can be solved at the same time.
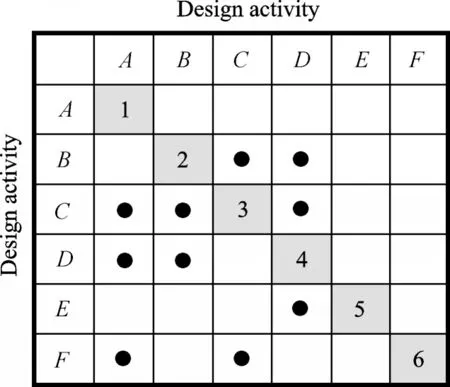
Fig.3 DSM form of a project
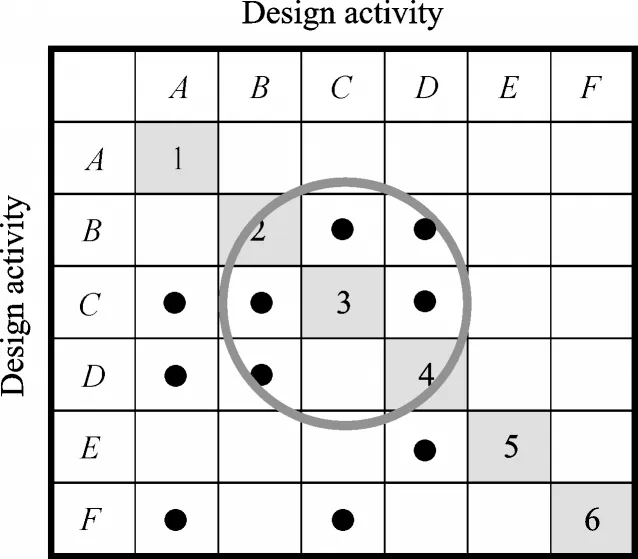
Fig.4 Cluster of activities B,C and D
However,the DSM presents conditions for developing a metric of combinatorial complexity. The combinatorial complexity has a strong effect on the planning for a design process[26]. Eq.(1)shows a metric to calculate the complexity based on the sizes of the clusters

where n is the number of clusters,and Ciis the size of cluster“i”.
According to Eq.(1),the complexity of the DSM in Fig.4 can be calculated as follows

1.2 Main reasons for r ewor ks in projects
The cost of quality(COQ)is related to the cost of conformance and nonconformance activities,which are carried out for compensatory purposes.Due to the possibility that in the first effort to complete that activity,some parts of required activity may have already been done incorrectly.
The COQ work may exist throughout the life cycle of a deliverable. For instance,the decision of a project team can affect the operational costs related to a completed deliverable. The cost of post-project quality may be generated because of warranty claims,product returns and recall campaigns.Therefore,considering potential benefits that may be derived from reducing the post-project COQ and the temporary nature of projects,supporting organizations may choose to invest in product quality improvement. Generally,these investments are made for conformance activity to reduce product defects and the costs of defects by inspecting the nonconforming units.
The costs of nonconformance determine the costs of reworks used for modifying the deliverable.The cost of nonconformance will be reduced if the cost of conformance is considered in the projects.
Table 1 shows COQ[27].
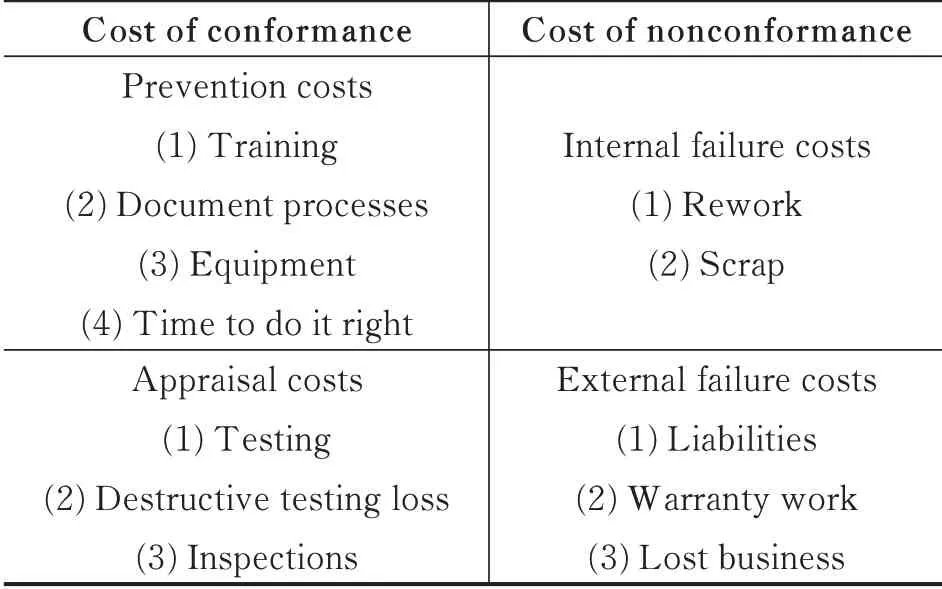
Table 1 Cost of quality
The complexity of DSM in Fig.4 can be greatly reduced if a preventive action“P”is added between design activities B and C,as shown in Fig.5.
The complexity of DSM in Fig.5 is

2 Comparison Between Two Classical DSM Clustering Methods
There are two classical DSM clustering methods:LSM and FSM,each of which has its own strengths and weaknesses in different situations.
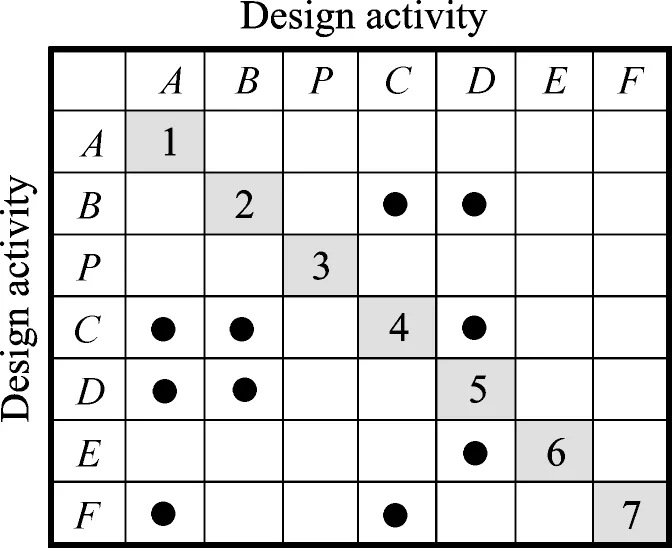
Fig.5 Less complex DSM with a preventive action
2.1 Loop searching method(LSM)
Activity-based DSM is a branch of graph theory. As shown in Fig.6,a directed graph on the left,including the binary relations between activities,is isomorphic to the adjacency matrix on the right.
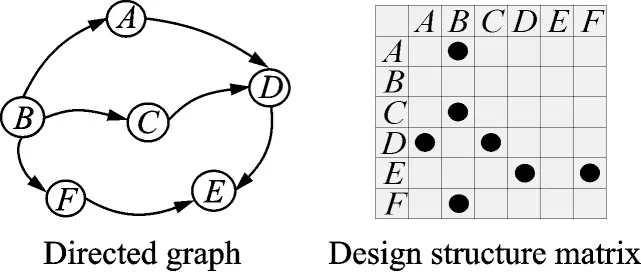
Fig.6 Evolution of a graph to a DSM
Steward[1]first put forward the procedures of developing an effective engineering plan including partitioning and tearing based on the DSM. Then Ko,Kuo and Yu[28]developed it by presenting a systematic workflow planning method for optimizing a new product development.
According to the flowchart in Fig.7,the reachability matrix(n is the number of activities in DSM A)is constructed based on DSM A in the searching process by the Warshall Algorithm.Then,the strong connected matrix S=P ∩PTcan be built,in which the row vector contains all clusters among activities. Subsequently,by arranging the level of coupled activities in each block,one can obtain a partitioned DSM. Afterwards,different tearing methods can be employed to decouple the coupled activities.

Fig.7 Reachability matrix method
2.2 Function searching method(FSM)
The objective of DSM clustering is to group activities together into clusters that are loosely connected with each other based on a threshold of similarity. Algorithms such as FSM have been developed for DSM clustering,thereby complementing LSM. Existing FSM includes simulated annealing and genetic algorithms[18]. By searching the divided clusters,FSM can identify the final solution with the optimal objective function. Since the random process is involved in searching algorithms,only simulated annealing algorithm is studied in this section.
In particular,a widely used FSM is given below,in which the total coordination cost of interaction is defined as the objective function[29-30]

where

where m is the dimension of the DSM,i.e.,the number of activities in the DSM;DSM(i,j) is the binary value of the interaction between activities i and j;c is the maximum number of clusters;csize(k)is the number of activities in cluster k;and pow_cc is a parameter that controls the type of penalty.
The bid from each cluster can be represented by Bid(clustersk,taskt)=

where Bid(clustersk,taskt) refers to the bid from cluster k for activity t;pow_dep the importance given to strong interactions over weak ones;pow_bid the value of a bid which depends on the size of the clusters;and CMAT(k,j) is a 0—1 variable which takes 1 if activity j is an element of cluster k.
Activity t is then moved to the cluster with the value of the bid being the largest. If the total coordination cost has a prominent improvement,the change will be permanent. This process will not stop until the total coordination cost becomes stable.Finally,we can get the near-optimal solution of clustering. To widen the searching area of the algorithm,the bid with the second largest value is also taken into account to simulate the annealing process of metal.
2.3 Case studies
Fig.8 shows a ten-activity DSM,in which the reworks of activities are identified and clustered after determining the strong connected matrix S.
Using LSM,a solution is obtained after loop searching as shown on the right hand in Fig.8:[A D F],[B H J],[C G],[E I].Its complexity is

By using FSM approach,three possible solutions are achieved as shown in Fig.9. Further,the costs of the three solutions are 123.10,100.60,and 88.12,respectively,according to Eqs.(4)—(6).
The complexities of the three solutions in Fig.9 are as follows

By comparing Eq.(7)to Eqs.(8)—(10),one can find that the complexity of the solution in Fig.9 by LSM is lower than that in Fig.8 using FSM.

Fig.8 DSM clustering by using LSM
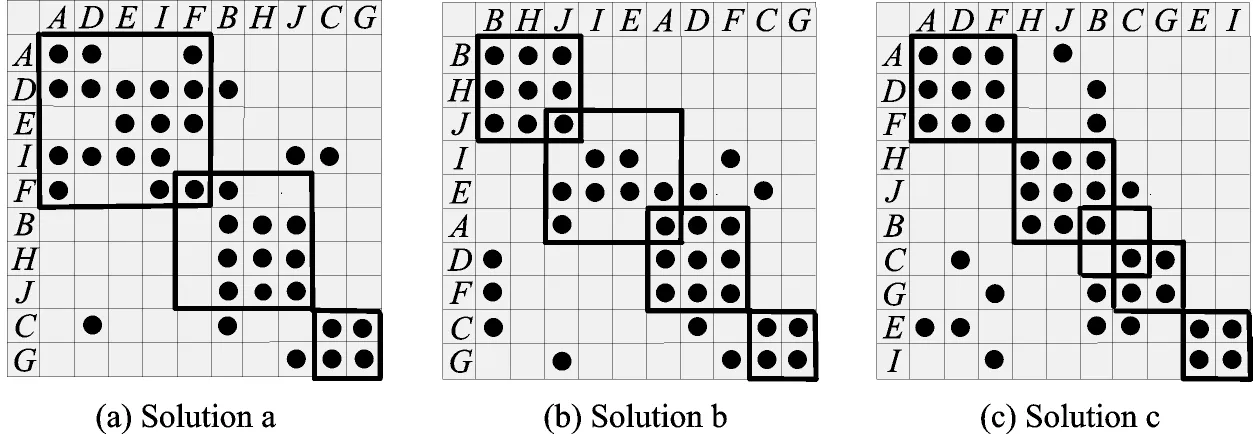
Fig.9 DSM clustering by using FSM
The stability of LSM is perfect because it never changes when searching the same DSM. In contrast,the solutions of FSM are unstable. Although the achieved activities in the clusters are similar in the three solutions,the sizes and the quantites of the clusters are different.
The clustering quality of DSM achieved by LSM and FSM can be compared. On the one hand,LSM contain all possible reworks and coupled activities in DSM,so the result can fully describe the project network. On the other hand,FSM can clearly calculate the coordination cost for each solution,but reworks may be missed in solutions. Furthermore,the coordination cost of LSM solution is 84.981 2,lower than FSM solutions.
The case studies in this section shows that in most situations,LSM works better since it is more structural while FSM is more quantitative and offers more solutions. The next section will further discuss how the two clustering approaches work in different situations and provide a general metric for choosing the appropriate algorithm in different cases.
3 Judgment for Reducing Reworks Using Two DSM Clustering Methods
The working performance of the two DSM clustering methods in different cases is first investigated to determine their optimal working area according to two metrics: the non-zero fraction(NZF)and singular value modularity index(SMI)developed by Hölttä-Otto and De Weck[11]. Subsequently,the procedure for choosing the optimal DSM clustering method is proposed followed by the conceptual model to reduce the reworks in complex projects.
3.1 DSM density metric: Non-zero fraction(NZF)
As an indication of the density of a given DSM,the value of NZF can be determined by using the following equation

3.1.1 Working area of LSM and FSM for DSMs with ten activities
Section 2.3 presents a low-density project with ten activities to show how the DSM clustering methods work,which may not be suitable for projects with high density or overlapping coupled activities.As the complexity of a project increases,the density of a DSM becomes higher and more overlapping clusters are needed to deal with. Another case with a higher density and several overlapping coupled activities is presented as shown in Fig.10. Using LSM,the strong connected matrix can be obtained as shown in Fig.11,in which all activities are clustered as a whole.
Obviously,this clustering result in Fig.11 is meaningless because too many overlapping clusters cause even more confusion. This solution is called“invalid”.
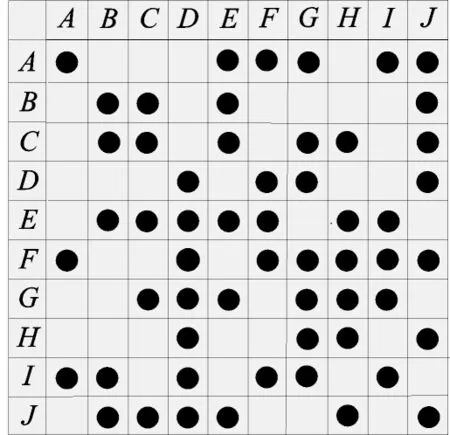
Fig.10 Original high-density DSM
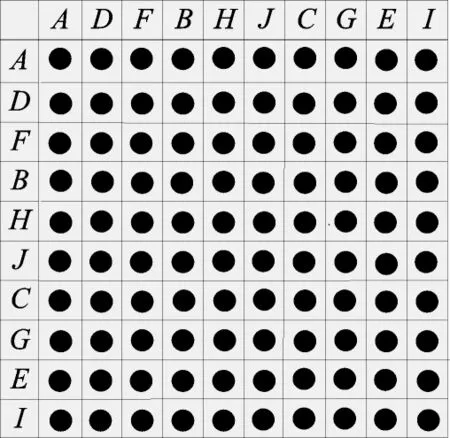
Fig.11 Clustering result of Fig.10 by using DSM
Note that the solution obtained by using LSM in Fig.8 is stable and satisfactory. Therefore,LSM is limited to the structure and connections because it only indicates the path of interactions without calculating the strength. When more interactions occur among the activities,the LSM method may fail to achieve a good solution.
Considering that LSM cannot be utilized to handle the high-density DSM in Fig.10,one can check the results by using FSM which are unstable but not limited to the structure.
By using the SA method,two clustering solutions are obtained as shown in Fig.12:[A F I],[B C E],[J D G],[H]and[A F I],[B C E J],[D G H].Their complexity can be determined

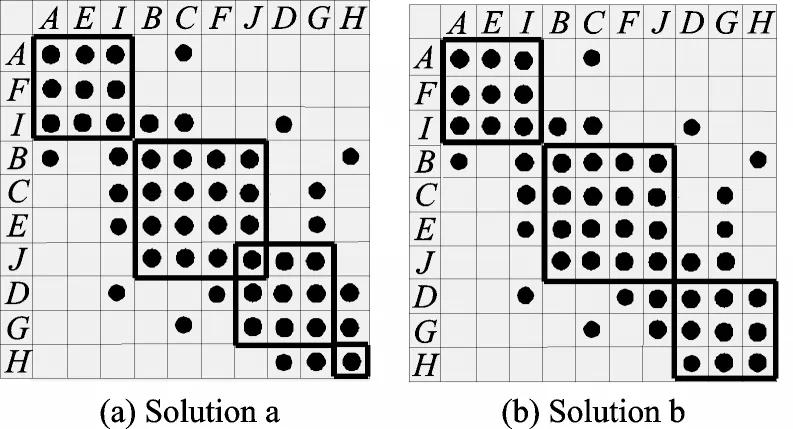
Fig.12 Two clustering solutions by using FSM
When the DSM structure of a project network is simple,the fixed or optimal clustering solution may not be achieved by using FSM. However,if the DSM structure is more complex or with high density,it can be found that FSM performs better than LSM.
To find the valid density intervals for the two DSM clustering methods from the perspective of the density metric of a DSM,the highest density that the methods can handle should be first determined.Alternatively,if the maximum density is identified,the valid density interval can be determined. If the density of a DSM exceeds the threshold,the solution becomes“invalid”as mentioned earlier. Further,the meaningless probabilities of LSM and FSM can be further obtained by using the following approach.
Suppose there are n samples of random ten-activity DSMs with different density. In order to find the invalid probability of LSM and FSM,the following formulas are given
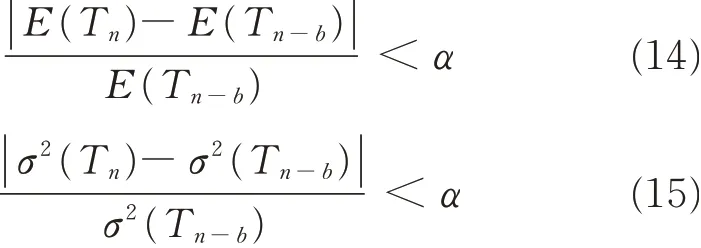
where Tnis the invalid probability;E and σ2are the mean value and the variance of Tn,respectively;b is 100,representing the latest 100 samples;and α 0.002,representing the level of stability.
The parameter n can be acquired when Tnremains stable. In this way,the invalid probability curves of the two methods can be drawn,as shown in Fig.13.
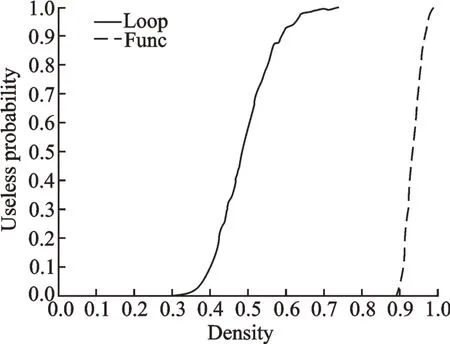
Fig.13 Invalid probability curves of LSM and FSM for ten-activity DSMs
In Fig.13,the solid and dotted lines represent the invalid probability curve of LSM and FSM,respectively. With respect to the curve of LSM,the invalid probability rises rapidly from 0 at the threshold of density 0.33,and then goes up to 0.8 at density 0.55. The invalid probability keeps rising as the DSM density increases,and then goes up to 1.0 at density 0.72 where it remains stable until the end.Hence,when NZF is considered,the optimal valid density interval for LSM is(0,0.33)and the maximum valid density interval is(0,0.72).
On the other hand,as we can be easily seen from the dotted curve in Fig.13,FSM performs better within the density interval of(0,0.89). Note that when the density is beyond 0.7,the curve of FSM becomes shaky,since the corresponding solutions are not close to the optimal clustering solutions. This conclusion is drawn from numerous experiments.
Hence,the threshold of the density for LSM and FSM are 0.33 and 0.89,respectively. Table 2 shows the valid density intervals of LSM and FSM with different NZF for ten-activity DSMs.

Table 2 Valid density intervals of LSM and FSM with different NZF for ten-activity DSMs
3.1.2 Working area of LSM and FSM for DSMs with different number of activities
The DSMs in Section 3.1.1 include only ten activities. To make the results more general,DSMs with different number of activities are studied in this section. The invalid probability curves of LSM and FSM for ten-activity,20-activity and 30-activity DSMs are presented in Fig.14.
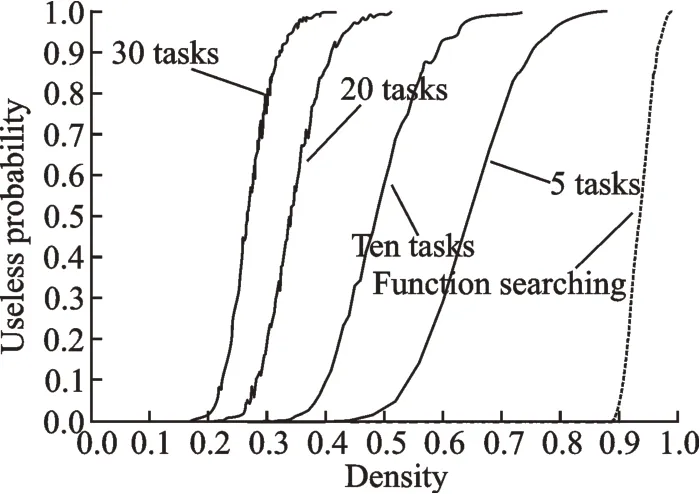
Fig.14 Invalid probability curves of LSM and FSM for DSMs with different number of activities
As shown in Fig.14,with the growing number of activities in a project,the invalid probability curves of LSM shift left and the valid density interval is narrowing. In contrast,the curves of FSM stay in the same location while the solutions are still shaking after a density of 0.7. Two boundary values are recorded for each curve of LSM,which refer to the lowest density at which LSM becomes invalid and the highest at which LSM is still valid. For the curve of FSM,the shaking and invalid boundary values are 0.7 and 0.89,respectively.
With the above boundary values,the working area of LSM and FSM for DSMs with different numbers of activities is plotted in Fig.15.

Fig.15 Working area of LSM and FSM for DSMs with different number of activities (2—30).
As shown in Fig.15,the lowest densities at which LSM and FSM may become invalid are from curves 1 and 4,respectively. The highest density at which LSM is still valid is from curve 2,and the density at which solutions by FSM become questionable is from curve 3. Note that in Fig.15,both curves 3 and 4 are straight lines since their boundaries are constants.
By using the fitting algorithm,one can find that curve 1' and 2' in Fig.15 are exponential approximation functions of curves 1 and 2,respectively.Moreover,the thresholds of the fitting curves at which LSM is still valid can be denoted by 1.245 3×e-0.275n+0.198 2,and 0.842 5×e-0.047n+0.207 4,respectively,where n is the number of activities of a DSM. The residual errors of the two fitting curves are 0.013 4 and 0.009 1,respectively. If the number of activities in a project is extended to 50,more points are simulated and longer simulation time is required as given in Fig.16.
In both Figs.15 and 16,the whole working area is divided into six zones by four curves. Zone A indicates the area in which both LSM and FSM methods can work well. According to the stability and precise description,LSM should be chosen for cases in zone A. In Zones B and D,LSM starts to lose its clustering ability and the advantage of FSM appears. Furthermore,one should definitely use FSM in Zones C and E because LSM becomes invalid in these two zones. Cases in zone F cannot be solved by either LSM or FSM. These above conclusions demonstrate that,given the size and density of a DSM,optimal choices can be determined when the case is in Zones A,C,or E but not the whole area. Further study can be carried out to deal with cases in Zones B and D.
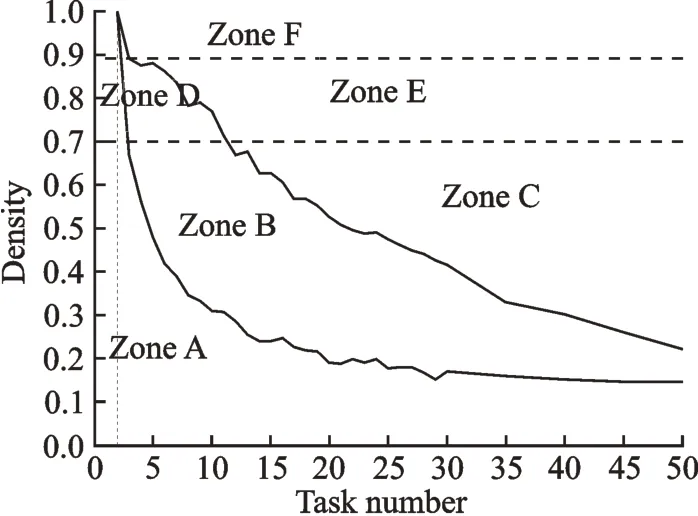
Fig.16 Working area of LSM and FSM for DSMs with different number of activities (2—50).
3.2 DSM modularity metr ic:Singular value modularity index(SM I)
Except for the density metric NZF,another metric,SMI,can be used to help to decide which the DSM clustering method should be chosen from the perspective of modularity. SMI is developed by Hölttä-Otto and De Weck[11]and can be utilized to quantify the degree of modularity of a product or project based on its internal connectivity structure.
With singular value decomposition on the binary DSM,the singular values and corresponding orthogonal eigenvectors can be expressed by

where σ1,σ2,…,σnare singular values in descending order of DSM with n activities.
Note that systems with different degrees of modularity reflect different decay of their singular values. SMI is then used for measuring the decay rate of the sorted,normalized singular values,as defined below

SMI reflects α*/n,where α*is the value which minimizes the error between an exponential decay and the actual decay across all singular values. If the system is integral,the value of SMI is low whereas high SMI indicates a high degree of modularity.This index is used here for assessing the effectiveness of a DSM clustering method.
3.2.1 DSMs with different SMI
Three cases are presented in Fig.17 with the same NZF and different SMI in Zone B,and their values of NZF and SMI are given in Table 3. As shown in Table 3,Case 1 is the most modular product with the highest SMI while Case 3 is integral.

Table 3 NZF and SMI of Cases 1—3
Using LSM and FSM,one can further obtain the clustering solutions as illustrated in Table 4 for the three cases in Fig.17. One can easily find that the modularity of a project can influence the clustering results of algorithms.
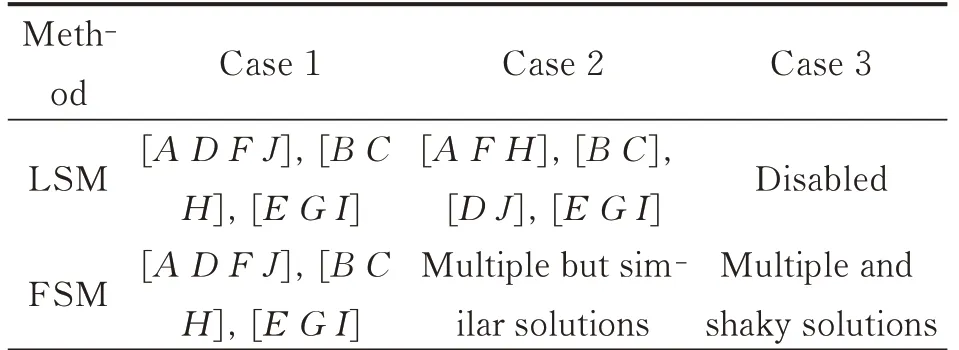
Table 4 DSM clustering solutions for Cases 1—3 by using LSM and FSM

Fig.17 Three cases in Zone B.
In Table 4,both LSM and FSM work well in Case 1 with the same optimal solution[A D F J],[B C H],[E G I],which indicates that they are suitable for high modular cases. However,when the degree of modularity begins to drop,such as that in Case 2,FSM generates more than one solution while LSM still works well. When SMI decreases to 0.131 1 in Case 3,LSM cannot work at all while FSM still has more than one solutions although they are shaky.
3.2.2 Working area for DSMs with different SMIs
Since the difference between LSM and FSM cannot be identified by using only NZF,Cases in Zone B and Zone D in Figs.15,16 are discussed in this section from the perspective of SMI. For the sake of being more general,1 000 cases are randomly chosen in Zones B and D,and divided into three parts according to the value of SMI,i.e.,high(0.7—1.0),middle(0.4—0.7),and low(0—0.4).The chosen cases are then clustered using LSM and FSM,and the results are given in Table 5.
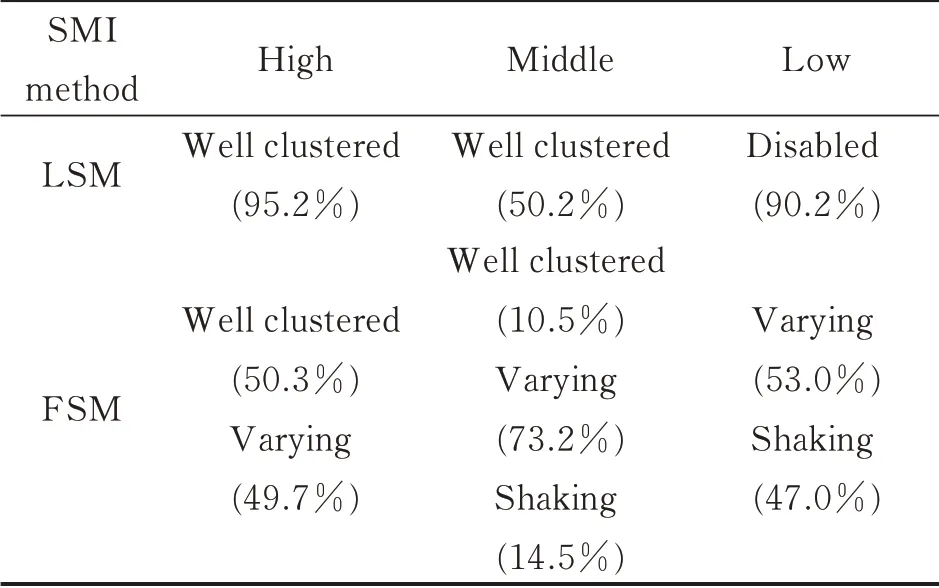
Table 5 DSM clustering solutions for Case 1—3 by using LSM and FSM
In Table 5,cases with higher SMI have a greater chance to be well clustered by either LSM or FSM because there are few connections between activities in these cases with high modularity. For FSM,a higher value of SMI makes the results more stable while a relatively lower SMI may lead to varying solutions. Hence,the LSM method performs better in cases with high SMI.
When the value of SMI decreases to the middle level,LSM becomes disabled in half of cases whereas FSM can still provide varying solutions,which are close to the optimal ones. Therefore,FSM is more suitable for middle SMI cases. However,when SMI drops to the low level,LSM is almost disabled,and half of the solutions obtained by FSM are questionable and unsatisfactory. If a choice has to be made between LSM and FSM,the latter is more preferred.
In conclusion,for cases in Zones B and D,when the value of SMI is high(0.8—1.0),LSM should be selected. When the value of SMI is middle(0.4—0.7)or low(0—0.4),FSM should be the better choice. For cases in these two zones,the density metric as well as the modularity metric should be combined to determine which DSM clustering method should be chosen.
3.3 A approach for reducing reworks using DSM clustering methods
A judgement procedure is developed in Fig.18 to facilitate the choice of DSM clustering methods in project management.
As shown in Fig.18,one need to calculate the numbers of activities and the value of NZF first.Subsequently,a judgment should be done to check which zone the investigating case falls into. If it is in Zone A,LSM should be chosen;if it is in Zone C or E,one should choose FSM;if it belongs to Zone B or D,SMI should be further calculated to determine whether LSM or FSM is a good choice for this case according to the conclusions in Table 5. Note that if it is in Zone F,no methods can be utilized to handle this case.
The judgement procedure in Fig.18 is obtained from numerous cases,and is tenable enough to make wise choices about clustering methods without doing calculation and comparison on both LSM and FSM,which can greatly save time and energy for project managers. Based on the approach in Fig.18,the conceptual model for reducing reworks of a project can be constructed as shown in Fig.19.
As illustrated in Fig.19,when analyzing a real-world project,one should firstly judge whether a network of the project can be drew. If it is possible,the preventive activities can be identified from the network. If a network of the project cannot be obtained,the optimal DSM clustering method can be determined according to the proposed procedure in Fig.18. Subsequently,the possible clustering solutions can be obtained and their complexity can be calculated. Then,one can decide whether or not it is necessary to reduce the complexity. If it is yes,the preventive activities need to be identified and added to reduce reworks in the project. If it is unnecessary,analysis process is done.
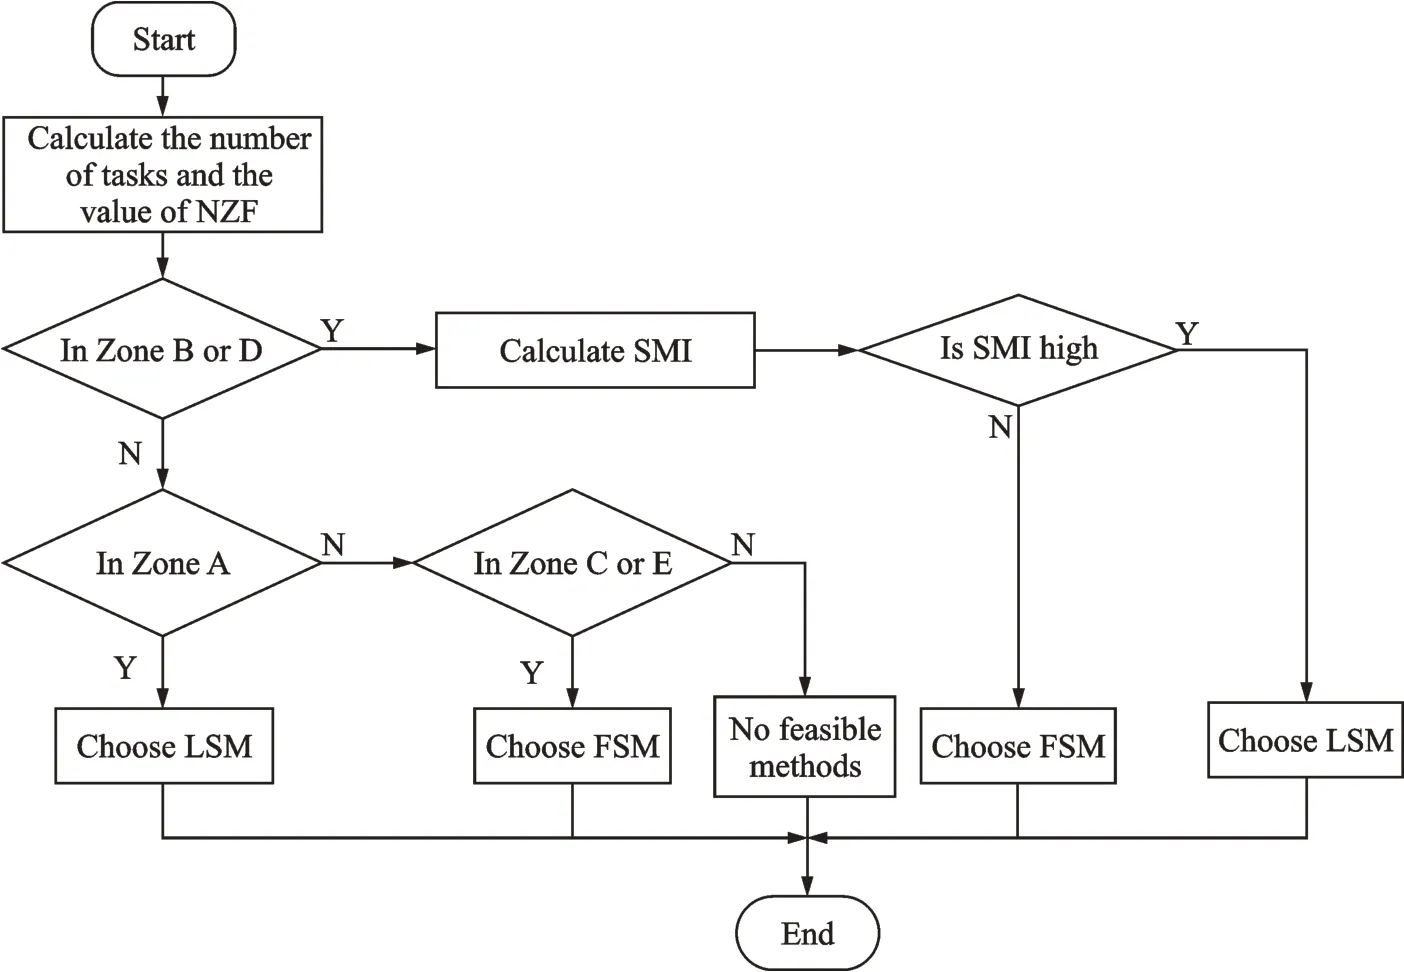
Fig.18 Procedure of choosing the optimal DSM clustering method
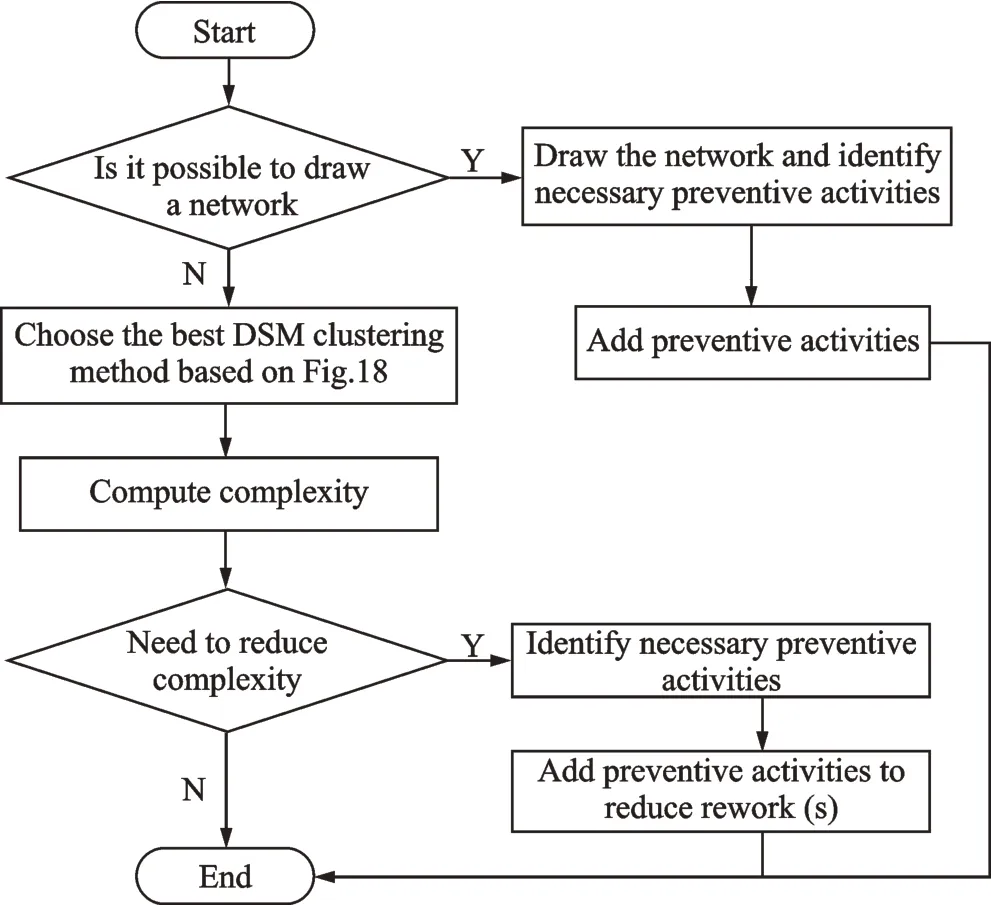
Fig.19 Conceptual model for reducing reworks in complex projects
4 Application: Aircraft Design Process
The aircraft design process is restricted in sequential design. It will take 4—5 a to design a combat aircraft using the sequential approach from initial concept to metal cutting. To significantly reduce the lead-time,concurrent engineering is applied to the design process. The designer of an aircraft provides a conceptual design of that aircraft to the system groups using product data management tools,and the experts of system group comment simultaneously on the design relative to their area[31-32]. For instance,the experts of assembly consider assembly problems,the experts of process-planning investigate the process sequence,and the experts of metal removal consider new removal methods,available machine tools,etc[33]. The designer of the aircraft organizes redesign suggestions and the comments on the concept of the aircraft from each expert of the domain around the hub. The DSM for the aircraft design process is built in Fig.20.
According to the procedure in Fig.19,the DSM for the aircraft design process can be analyzed as follows.
Step 1It is not possible to draw the network using usual methods.
Step 2The number of activities in Fig.20 is 17 and the NZF is 0.62,which means that it is located in Zone C. According to Fig.18,FSM is a better choice than LSM. Actually,it is easy to see that this is integral with many strong connected entries,so the likelihood exists that LSM may not work.
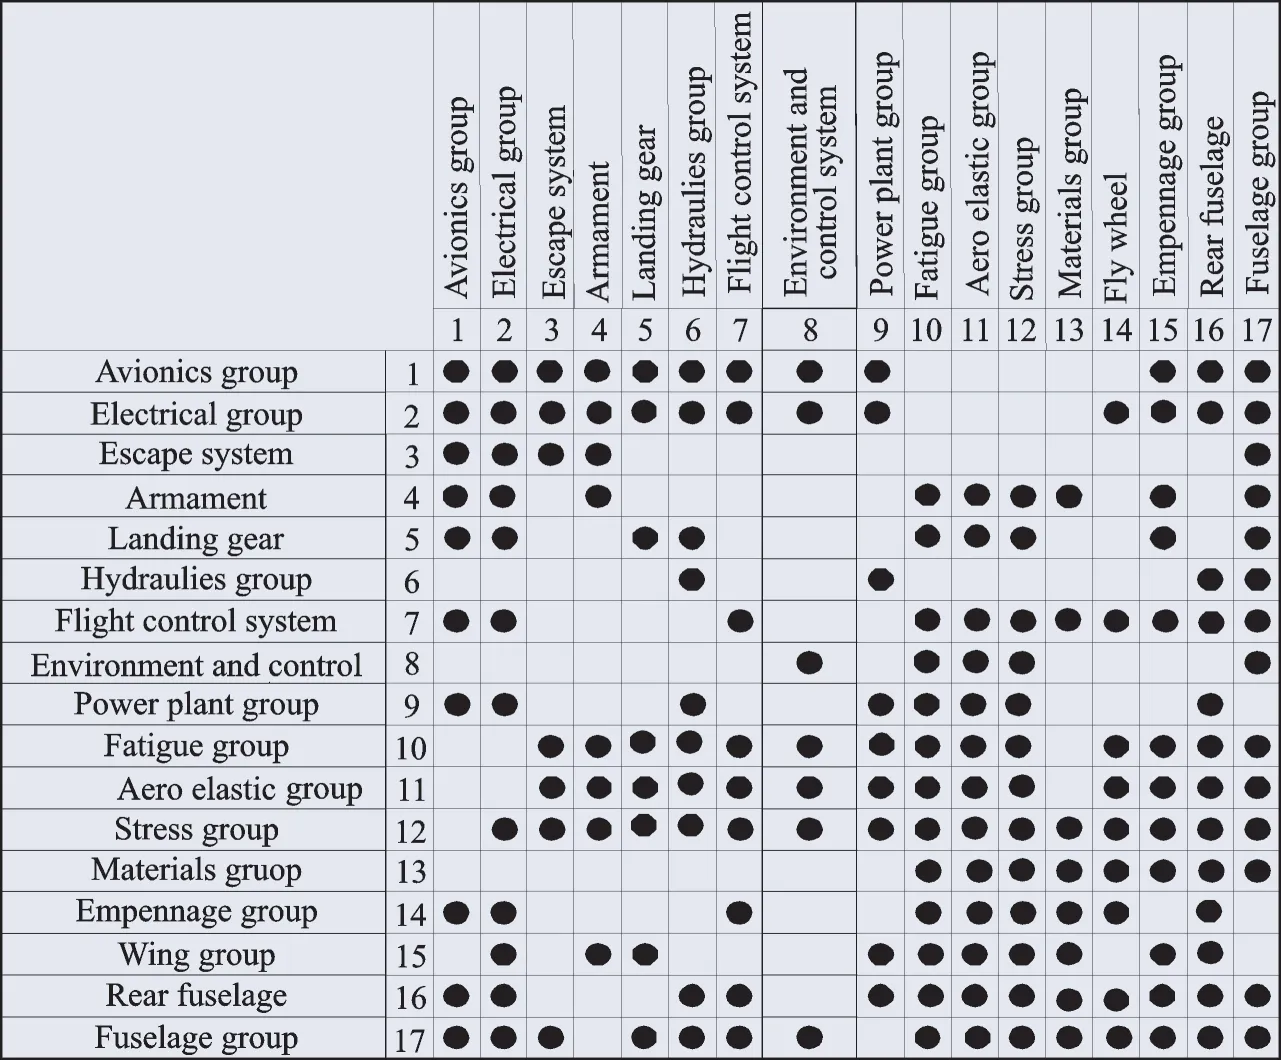
Fig.20 DSM for aircraft design process
The above results confirm preliminary conclusions. LSM is disabled in this case because all activities are connected after searching the loop. On the other hand,three clustering solutions are obtained using FSM:[12 3 4 5],[6 7 8 9 10 11 12],[11 12 13 14 15 16 17](solution 1);[1 2 3 4],[5 6 7 8 9 10 11],[7 9 10 11 12 13],[8 13 14 15 16 17](solution 2);[1 2 3 4 5],[6 7 8 9 10 11],[8 9 10 11 12 13],[12 14],[15 16 17](solution 3). Furthermore,solution 1 is the optimal one with the coordination cost being 320.8,and its corresponding DSM is given Fig.21.
Step 3The complexity of the optimal solution in Fig.24 is CFig.21= 52 + 72 + 72 = 123.
Step 4To reduce the complexity and reworks of the aircraft project,a preventive action can be added between activities 2 and 3 as shown in Fig.22. The complexity of the DSM with the preventive activity is

Locations of the above two cases are shown in Fig.23. To sum up,for cases in Zone A,LSM is more efficient and can clearly represent the structure and relationship between activities or elements.LSM can always find the optimal solution in Zone A,while FSM may miss some connections because it is a random process. On the contrary,in Zone C the situation is totally different. LSM is disabled,whereas FSM is more robust because it still can provide available solutions even though the value of NZF is growing.
5 Conclusions
Loops,sometimes,come into being in project management networks because of the uncertainty in different phases of project management,especially in the initial phase. Consequently,the probability of creating reworks always exists in research and product improvement projects. Most of project management techniques such as CPM,PERT and CCPM,cannot handle project management networks with loops. Although some techniques such as GERT support loops,their computations are complicated for big projects. Hence,a preliminary judgment mechanism based on DSM is developed in this research for greatly reducing the reworks in project management.
To begin with,two DSM clustering methods,LSM and FSM,are compared and their own particular characteristics are identified. Through the analysis of various cases,we can conclude that LSM can determine the coupled activities and clusters but cannot handle the strength of connections,which may lead to difficulty when the connections cross over the activities. On the other hand,FSM are random processes led by an objective function,which may not find the optimal solution each time but the solutions are near to the best one. To sum up,LSM is more structural while FSM is more quantitative and can generate more solutions.
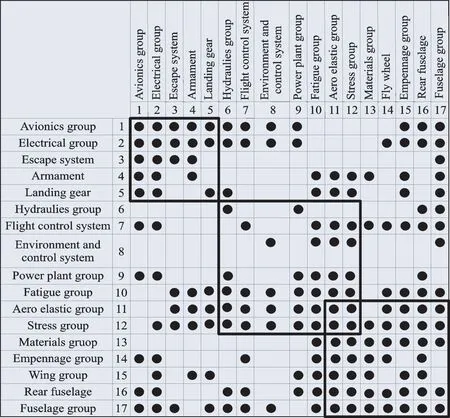
Fig.21 Optimal clustering solution for the aircraft design process
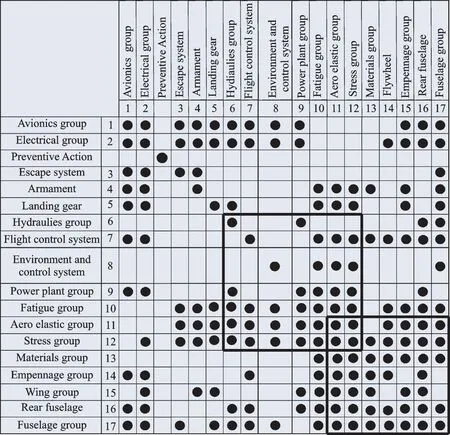
Fig.22 A preventive activity between activities 2 and 3
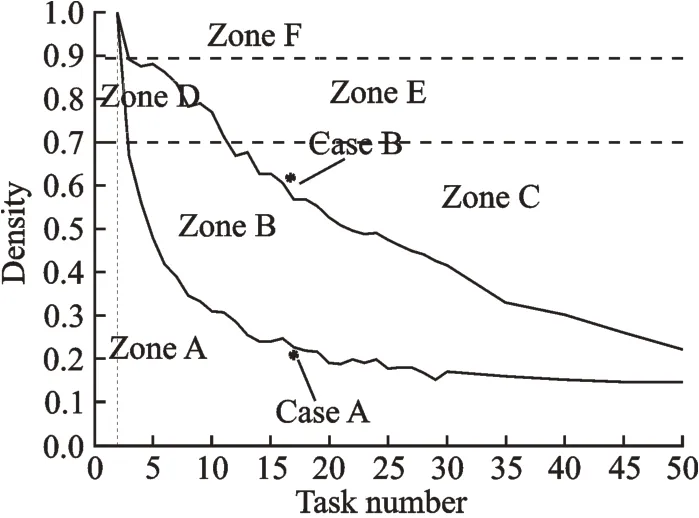
Fig.23 Locations of Cases A and B
In Section 3.3,the judgement procedure is proposed to determine the optimal DSM clustering method when facing a real-world production development process. The whole working area was divided into 6 sub-zones,in which Zone A is the optimal working area for LSM while Zones C and E constitute the optimal working area for FSM. Subsequently,SMI is utilized to make a more precise division for Zones B and D from the perspective of modularity degrees. Then,the conceptual model is constructed for reducing reworks in complex projects. Finally,the above approaches are applied to a real-world project.
杂志排行
Transactions of Nanjing University of Aeronautics and Astronautics的其它文章
- A Generic Plug-and-Play Navigation Fusion Strategy for Land Vehicles in GNSS-Denied Environment
- Ballistic Trajectory Extrapolation and Correction of Firing Precision for Multiple Launch Rocket System
- An Edge-Boxes-Based Intruder Detection Algorithm for UAV Sense and Avoid System
- Application of Fuzzy Bilateral Boundary DEA Model in Selection of Energy-Saving and Environmental Protection Enterprises
- An Experiment on Cavitating Flow in Rocket Engine Inducer
- Numerical Analysis on Thermal Function of Clothing with PCM Microcapsules
