Role of the inter-pass cooling rate in recrystallization behaviors of Ni-based superalloy during interrupted hot compression
2019-06-03XinZHANGHongweiLIMeiZHANSilingYANNingZHANG
Xin ZHANG ,Hongwei LI ,*,Mei ZHAN ,Siling YAN ,b,Ning ZHANG
a State Key Laboratory of Solidification Processing,School of Materials Science and Engineering,Northwestern Polytechnical University,Xi'an 710072,China
b School of Material Science and Engineering,Hefei University of Technology,Hefei 230009,China
KEYWORDS Cooling rate;Hot compression test;Kinetic equation;Ni-based superalloy;Recrystallization
Abstract The microstructural evolution of a Ni-based superalloy under interrupted hot compressive deformation with different cooling rates in the inter-pass stage is investigated.It is found that metadynamic recrystallization(MDRX)in the inter-pass stage is more sensitive to the accumulated strain than the deformation temperature which is above the recrystallization temperature.The variations of both the grain distribution and the texture intensity caused by MDRX during the interpass stage result in variations of the yield stress(YS)and the work hardening(WH)rate in each stage.Results also show that the MDRX process in the inter-pass stage has a considerable influence on the final microstructure of three-pass compression.The final grain distribution is more uniform,and the compression texture gradually transforms into recrystallization texture with an increasing degree of MDRX.In order to predict the MDRX fraction in the inter-pass cooling stage,a modified kinetic equation is established,which can reasonably predict the MDRX behavior under multi-pass compression with different conditions in the inter-pass stage.Meanwhile,the influence of the interpass cooling stage on the mechanism of dynamic recrystallization(DRX)is studied.It is universally acknowledged that the discontinuous dynamic recrystallization(DDRX)process is the major deformation mechanism for the Ni-based superalloy.However,the continuous dynamic recrystallization(CDRX)process is promoted in the compression stage with a decrease of the cooling rate in each inter-pass stage.
1.Introduction
Ni-based superalloys have been widely used in aeronautical,petrochemical, nuclear, chemical, and marine applications due to their excellent mechanical properties and corrosion resistance.1-5However,when components are formed in room temperature,the YS and flow stress of an alloy limits its formability.Hot working is commonly used for manufacturing superalloy components.During a hot working process,processing parameters,e.g.,deformation temperature,strain rate,and strain,significantly affect the microstructure and consequently mechanical properties of the final product,6-8which are important for satisfying the higher requirements of such industrial applications.An obvious characteristic of hot working processes,such as hot ring rolling,9thermal local loading forging of a large-scale complex component,10thermal power spinning,11and so on,is that a material undergoes a multipass deformation and inter-pass cooling process.The combined effect of the thermal deformation and inter-pass cooling process,during which the temperature drop is affected by the billet size,processing temperature,cooling time,etc.,makes the microstructural control of the final product extremely hard.To solve this problem,it is essential to study the complex microstructural evolution of a material during the multi-pass thermal deformation and inter-pass cooling process.
WH,dynamic recovery(DRV),and recrystallization12usually occur during hot deformation of metals or alloys.13Generally, DRX,14,15MDRX,16,17and static recrystallization(SRX)18,19mainly dominate the complex microstructural evolution and final properties of a component.20Up to now,some investigations have been done on the microstructural evolution of Ni-based superalloy during hot deformation.21-27The most typical experiment is a one-pass hot compression test under different temperatures and strain rates.It is widely believed that temperature and strain rate affect microstructure patterns mainly by the DRX process.However,when multi-pass deformation exists,the typical compression is insufficient to study the actual microstructural evolution in view of the existence of an inter-pass process.Additionally,the rules of DRXrelated microstructural evolution may also be different.To this end,Lin et al.28,29designed a two-stage isothermal compression test to study the influence of the pass interval on the MDRX process of Ni-based superalloy,and then the kinetic equations for MDRX were given.Their results showed that parameters in the inter-pass had considerable influences on MDRX.However,the effect of the inter-pass cooling process was not reflected in their study because an isothermal compression test was adopted.
To study the unclear effect of the inter-pass cooling process on the microstructural evolution of Ni-based superalloy,the stress-strain characteristics is a considerable parameter because it reflects the microstructural evolution and decides the subsequent behavior.The competition between DRV and DRX determines the characteristics of stress-strain curves,i.e.,WH and flow softening,the correlation of which has attracted more and more attentions.30-33The complex microstructural evolution during multi-pass deformation may result in more complicated stress-strain characteristics.During the process,the deformation before the inter-pass cooling stage serves as an accumulate-strain (energy storage), the microstructural evolution in the inter-pass cooling stage will affect the present stress-strain response,and then the present stress-strain response will affect the subsequent deformation and microstructural evolution.Therefore,it is clear that the correlation between stress-strain characteristics and the microstructural evolution during multi-pass deformation is particularly important.
The billet's size has a significant influence on the cooling rate during the inter-pass process.In this study,a three-pass hot compression test on a Ni-based superalloy with different inter-pass cooling rates was adopted to simulate the multipass hot deformation process of billets with different sizes.During the test,the temperature drop in each inter-pass stage kept constant,while the cooling time varied(viz.different cooling rates).Then,the microstructure of the Ni-based superalloy was observed by the electron backscatter diffraction(EBSD)technology.The effects of recrystallization in the inter-pass stage on the evolutions of grain size,texture,and misorientation distribution as well as on the competition between DRV and DRX were studied.Moreover,MDRX kinetic equations applicable for the multi-pass cooling process were established.
2.Material and experiment
The chemical composition(wt%)of the Ni-based superalloy adopted in this work is listed in Table 1.
Cylindrical specimens(∅8 mm×12 mm)were prepared for the experiment.Three-pass hot compressive tests were performed on a Gleeble-3500 thermo-mechanical simulator,and detailed procedures are indicated in Fig.1.Firstly,a specimen was progressively heated to 1150°C at 10°C/s,being held for 5 min to eliminate temperature gradients.Deformation temperatures were set to 1150,1050,and 950°C,respectively.The compression strain in each stage was 0.2,and the strain rate was 0.1 s-1.As shown in Fig.1,the temperature reduction between any two stages was 100°C.In order to simulate situations of the material in different-size billets or at different positions of a large-scale complex component under hightemperature forging,five cooling times,i.e.,5,60,120,180,and 240 s,were selected for inter-pass cooling,and the interpass temperature drop kept constant.At the same time,the thermo-mechanical simulator kept the cooling rate,i.e.,the temperature of the sample decreased linearly under a constant inter-pass time,namely,a longer cooling time indicates a slower cooling rate,and detailed parameters in the inter-pass stage are listed in Table 2.
To study the microstructural evolution in the three-pass compression test,the microstructures at the beginning of each pass(at the points of M1and M2indicated in Fig.1)and at the end of the test(at the point of M3indicated in Fig.1)were retained by interrupting the experimental procedure,and thecenter area of the sample was quantitatively analyzed by the EBSD technology.Samples for EBSD analysis were fabricated by a wire-cut machine along the transverse direction(TD)of the compressed specimens.Then,the sections for EBSD analysis were polished by a mechanical polishing machine and then electro-polished in a solution(30 mL HClO4and 270 mL CH3-CH2OH).The detailed step size and scan area are shown in the EBSD map,and the hit rates of all EBSD are above 90%.HKL channel 5 software was used for EBSD data acquisition and analysis.The distribution of initial grains before hot compression is observed in Fig.2,and the texture pole figure is in Fig.3.It is shown that the grain distribution is uniform,and the initial average grain size is 11.08 μm.

Table 1 Chemical composition of the Ni-based superalloy in the present work.

Fig.1 Experimental procedures for three-pass hot compression tests.

Table 2 Parameters in the inter-pass stage.
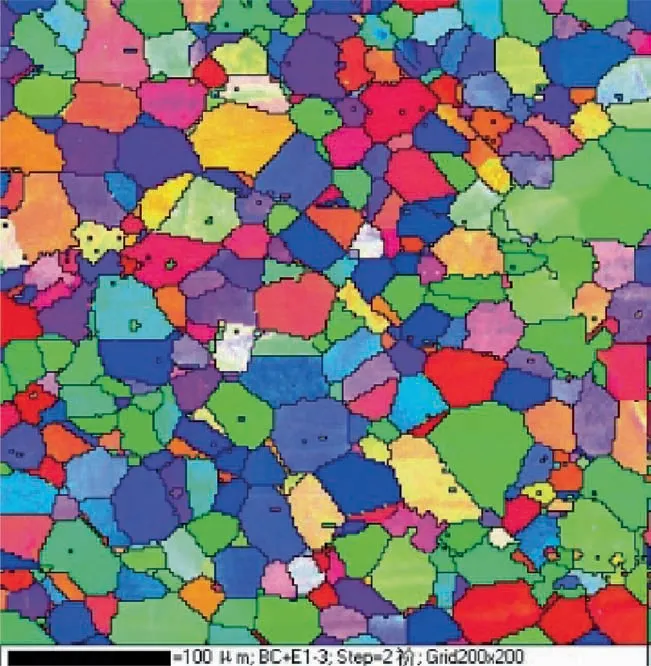
Fig.2 Initial microstructure of the studied Ni-based superalloy before hot compression.

Fig.3 Initial texture of the studied Ni-based superalloy before hot compression.
3.Results and discussion
3.1.Macroscopic stress-strain responses
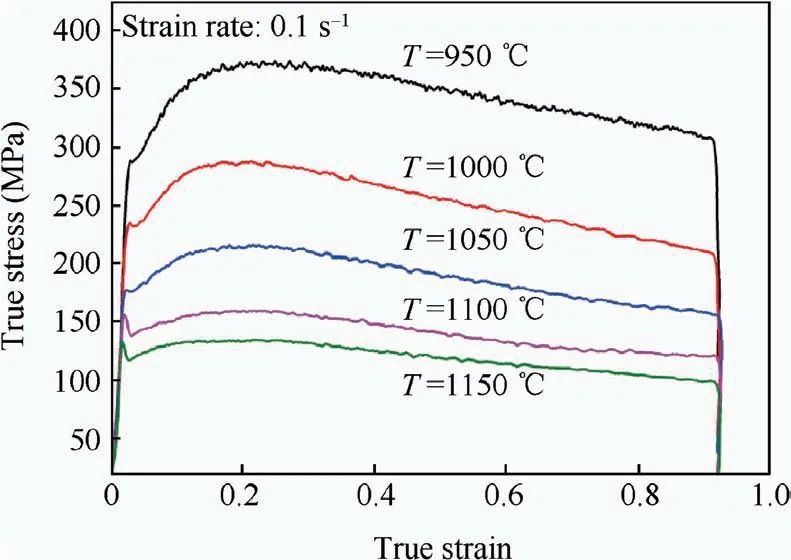
Fig.4 True strain-stress curves of the Ni-based superalloy in typical hot compression with different temperatures.
Fig.4 illustrates typical stress-strain curves of the Ni-based superalloy compressed at a strain rate of 0.1 s-1,in which T is the temperature.It is shown that the true stress abruptly increases at a very small strain,showing a typical elastic deformation.With continued deformation,the YS is reached,which means that the elastic deformation is over.It is a remarkable phenomenon that there exist an upper yield point and a lower yield point,and the difference between them is obvious when the deformation temperature is above 1050°C.However,the lower yield point disappears when the deformation temperature is lower than 1050°C.It is well believed that the appearance of a lower yield point is related to the solute pinning effect which is sensitive to temperature according to the experimental results,as shown in Fig.4.In the plastic deformation stage,the true stress increases and then decreases with the true strain,which indicates the competition between WH and flow softening.Besides,the true stress is distinctly affected by the deformation temperature. It is obvious that the true stress decreases with an increasing temperature,which is because the flow softening effect is more significant at a high deformation temperature.
The true stress-strain curves of three-pass hot compressive experiments at temperatures of 1150,1050,and 950°C are compared with typical ones,as shown in Fig.5 at a strain rate of 0.1 s-1.In the first stage at 1150°C,all true stress-strain curves with different cooling times are consistent well with the typical ones,which indicates that the experimental condition is stable.However,after the first inter-pass stage,varying inter-pass cooling times result in a variation of the YS in the second compressive stage.The relationship between the cooling time and the variation of the YS is given in Fig.6(a).The YS in the second compressive stage is higher than that in the typical compression under 1050°C with all of the cooling times,and it is shown that the YS decreases firstly and then increases rapidly with an increase of the cooling time.Meanwhile,both an upper yield point and a lower yield point exist in the second compressive stage,and the difference between the upper and lower yield points increases with the cooling time.The results indicate that not only the temperature but also the variation of cooling rates in the inter-pass stage affect the solute pinning effect,and a slower cooling rate results in a stronger pinning effect.
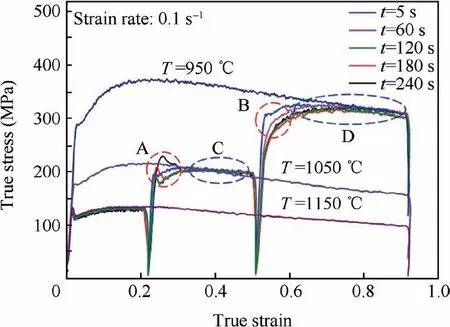
Fig. 5 True strain-stress curves obtained by three-pass hot compression tests of the Ni-based superalloy at a strain rate of 0.1 s-1.
The relationship between the cooling time and the YS variation in the third compressive stage is given in Fig.6(b).It is shown that the YS decreases continually with an increase of the cooling time before 180 s and then increases slightly after 180 s.When the cooling time is less than 60 s,the YS is higher than that in typical compression at 950°C,but it is lower when the cooling time exceeds 60 s.The differences between the second and third compressive stages are the temperature and the accumulated strain,which affect the microstructural evolution of the Ni-based superalloy.
The aforementioned results indicate that the yield characteristics change with different cooling rates in the inter-pass stage;meanwhile,the subsequent WH behavior also changes with different cooling rates.WH is an important feature during metal deformation,which has been widely used to investigate microstructural evolution during hot deformation.The WH curve is an effective method to study the corresponding microstructural evolution, which was described by the Kocks-Mecking(K-M)34and Estrin-Mecking(E-M)35relations.Ning et al.33have done some works on the evolution relation before and after the DRX critical strain that was identified by a combination of K-M,E-M,and WH models.36The relationship between the WH rate θ and the stress σ before DRX onset could be demonstrated as33
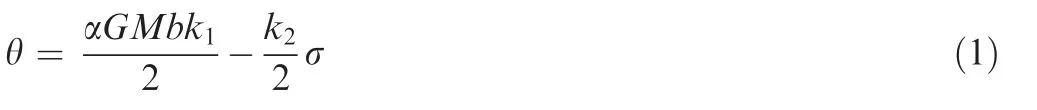
where α is the Taylor constant,and M is the conversion factor.G denotes the shear modulus,and b is the magnitude of the Burgers vector.k1and k2are coefficients to account for hardening and recovery,respectively.The WH effect after DRX onset could be expressed as33


Fig.6 Relationship between the cooling time and the YS.
where k represents the multiplication constant independent on deformation parameters. Eq. (1) describes the correlation between the true stress and the WH effect before DRX happens,which is caused by the competition between WH and DRV.It could be obtained from Eq.(1)that the WH rate decreases linearly with the true stress.The linear decrease of the WH rate by DRV disappears when DRX starts to operate,as given in Eq.(2).Therefore,the onset of DRX is the intersection point of Eqs.(1)and(2).According to the above discussion,the correlation curves of the WH rate and the true stress were created as shown in Fig.7.
Fig.7 illustrates the WH curves of the second and third stages of the Ni-based superalloy with different cooling times in the inter-pass stage.The data is derived from each plastic stage of true stress-strain curves as shown in Fig.5(sections C and D).From Fig.7(a),after the first inter-pass stage,it is obvious that the WH rate is higher than the others when the cooling time is 5 s under the same stress.When the cooling time exceeds 60 s,the variation of the WH rate with the cooling time has almost no difference.Fig.7(b)shows that the WH rate decreases more significantly with the cooling time except for 240 s after the second inter-pass stage.The WH rate with a cooling time of 240 s is higher than that with a cooling time of 120 s.This phenomenon could be attributed to a microstructural evolution that will be discussed in Section 3.2.However, the DRX onset continuously decreases with an increase of the inter-pass cooling time.It indicates that the DRX onset is affected by the inter-pass cooling significantly.The peak stress is the balance point of the competition between WH and DRX,as shown in Fig.7(b),in which WH dominates before the peak stress is reached,and DRX dominates after the peak stress.
3.2.Influence of microstructural evolution in the inter-pass stage on three-pass compression
Microstructural evolutions of the Ni-based superalloy during three-pass compression are shown in Figs.8 and 9,where Daverageis the average grain size.It is well known that MDRX dominates the evolution process in the inter-pass stage.In the first inter-pass stage with an accumulated strain of 0.2 and a cooling temperature from 1150°C to 1050°C,a small amount of recrystallization grains can be observed at the grain boundary when the cooling time is 5 s,and the distribution of grains is uneven,as shown in Fig.8(a)and(b).The same phenomenon was also reported by Lin et al.26,28When the cooling time reaches 60 s,the recrystallization grains grow and swallow up the surrounding small grains,resulting in an increase of the grain size and a more uniform distribution of grains,as shown in Fig.8(c)-(j).The statistical results indicate that the average grain size increases rapidly at first and then keeps a stable value when the cooling time exceeds 60 s in the first inter-pass stage.The saturated average grain size is about 30 μm,which is twice of that at a cooling time of 5 s.
In the second inter-pass stage,the accumulated strain is 0.4,and the cooling temperature is from 1050°C to 950°C.A similar phenomenon is observed when the cooling time is 5 s,while the area density of recrystallization grains is much higher than that in the first stage,as shown in Fig.9(a).It can be observed from Fig.9(c)-(j)that the grain distribution is more and more uniform with an increasing cooling time.Compared with the first inter-pass stage,the grain size is smaller in the second inter-pass stage.The statistical results show that the average grain size keeps a continuous growth with the cooling time in the second inter-pass stage.The grain size reaches 13.4 μm when the cooling time is 240 s.These results indicate that the grain size evolution during the inter-pass stage with different cooling times is affected by the accumulated strain significantly,which means that grain growth is decided by the accumulated strain and its limit increases with an increasing accumulated strain even under a lower-temperature condition.
The texture is also changed with the variation of cooling times in the inter-pass stage,which is shown in Fig.10(a).In the first inter-pass stage,the texture type is{1 1 2},and the intensity of texture is 9.37 when the cooling time is 5 s.With an increase of the cooling time,the texture type changes from{1 1 2}to{1 0 0}that is a typical recrystallization texture in FCC metals.It is found from Fig.10(c)that with an increase of the cooling time,the texture intensity decreases firstly and then increases.When the cooling time exceeds 120 s, texture is eliminated, and recrystallization texture appears. As shown in Fig. 10 (a), the texture types are{1 1 2}and{1 2 3}when the cooling time is 120 s,and the texture turns into{1 0 0},and its intensity increases when the cooling time is 240 s.

Fig.7 WH rate curves of the Ni-based superalloy with different cooling times in the inter-pass stage.

Fig.8 Microstructural evolution and grain diameter distribution at the center area of alloy during the first inter-pass cooling stage.
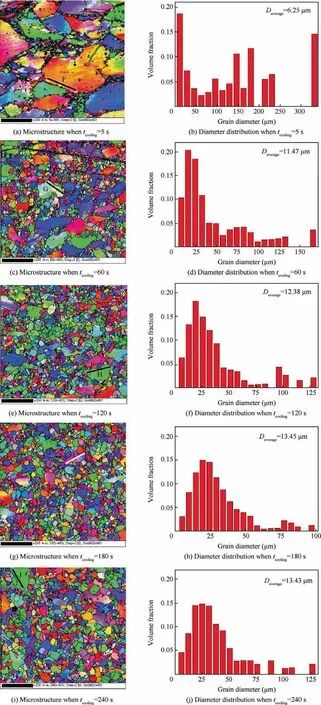
Fig.9 Microstructural evolution and grain diameter distribution at the center area of alloy during the second inter-pass cooling stage.
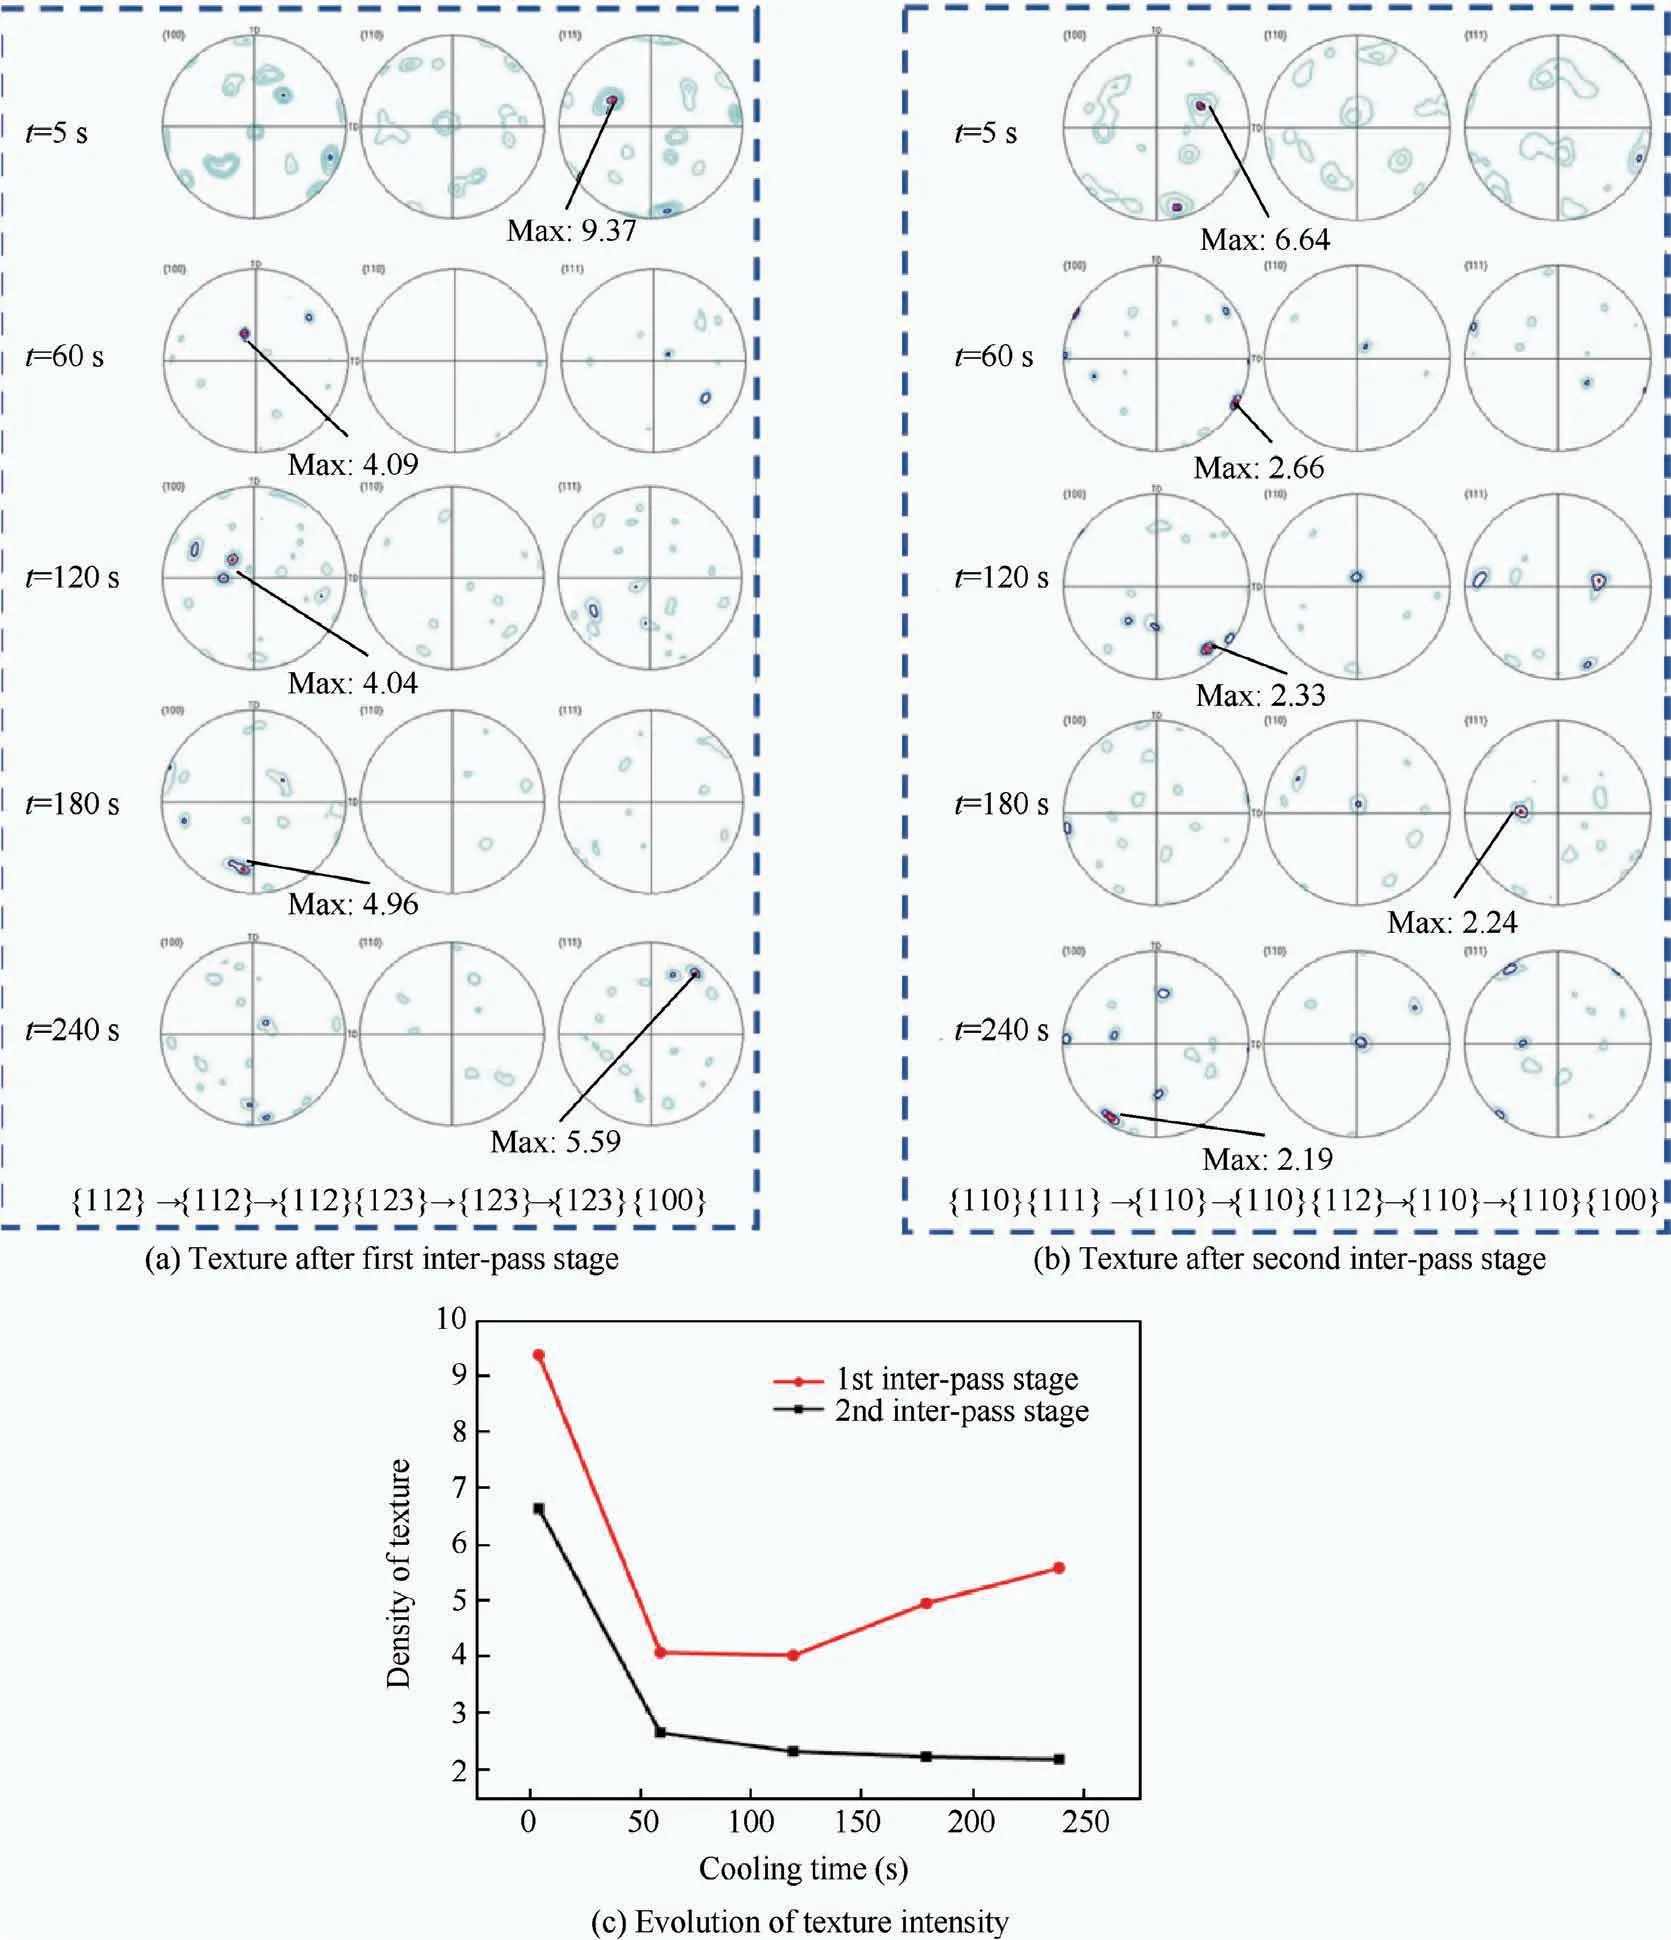
Fig.10 Evolutions of the texture type and intensity during inter-pass under different conditions.
The texture evolutions in the second inter-pass stage with different cooling times are shown in Fig.10(b).Although the accumulated strain is higher and the cooling temperature is lower in this stage,the texture intensity is lower when compared with that in the first inter-pass stage with the same cooling time,which can be observed in Fig.10(c).It is caused by adequate MDRX in the second inter-pass stage,which results in a decrease of the intensity of texture.From Fig.10(b),texture types are{1 1 0}and{1 1 2}when the cooling time is 5 s,which are similar to those in the first inter-pass stage.With an increase of the cooling time,the{1 1 2}texture disappears,and a weak{1 0 0}cube texture occurs at last.
The microstructural evolution decides the subsequent macroscopic responses. As previously mentioned, the YS decreases firstly and then increases rapidly with an increase of the cooling time in the second compressive stage,but decreases continuously with an increase of the cooling time when the cooling time is less than 240 s during the third compressive stage.It can be found that the variation rule of texture consists well with the YS variation rule under different cooling times.MDRX is insufficient when the cooling time is short.The recovery is the main reason that results in a decrease of the YS in this stage.While the cooling time increases,MDRX dominates at a relatively long cooling time.The uniformity of grains size is higher,and the texture type changes into a recrystallization texture with an increased intensity.Therefore,the YS changes with a variation of the cooling time.The above results show that the texture evolution in the inter-pass stage is the main reason that leads to a YS variation in the compressive stage.
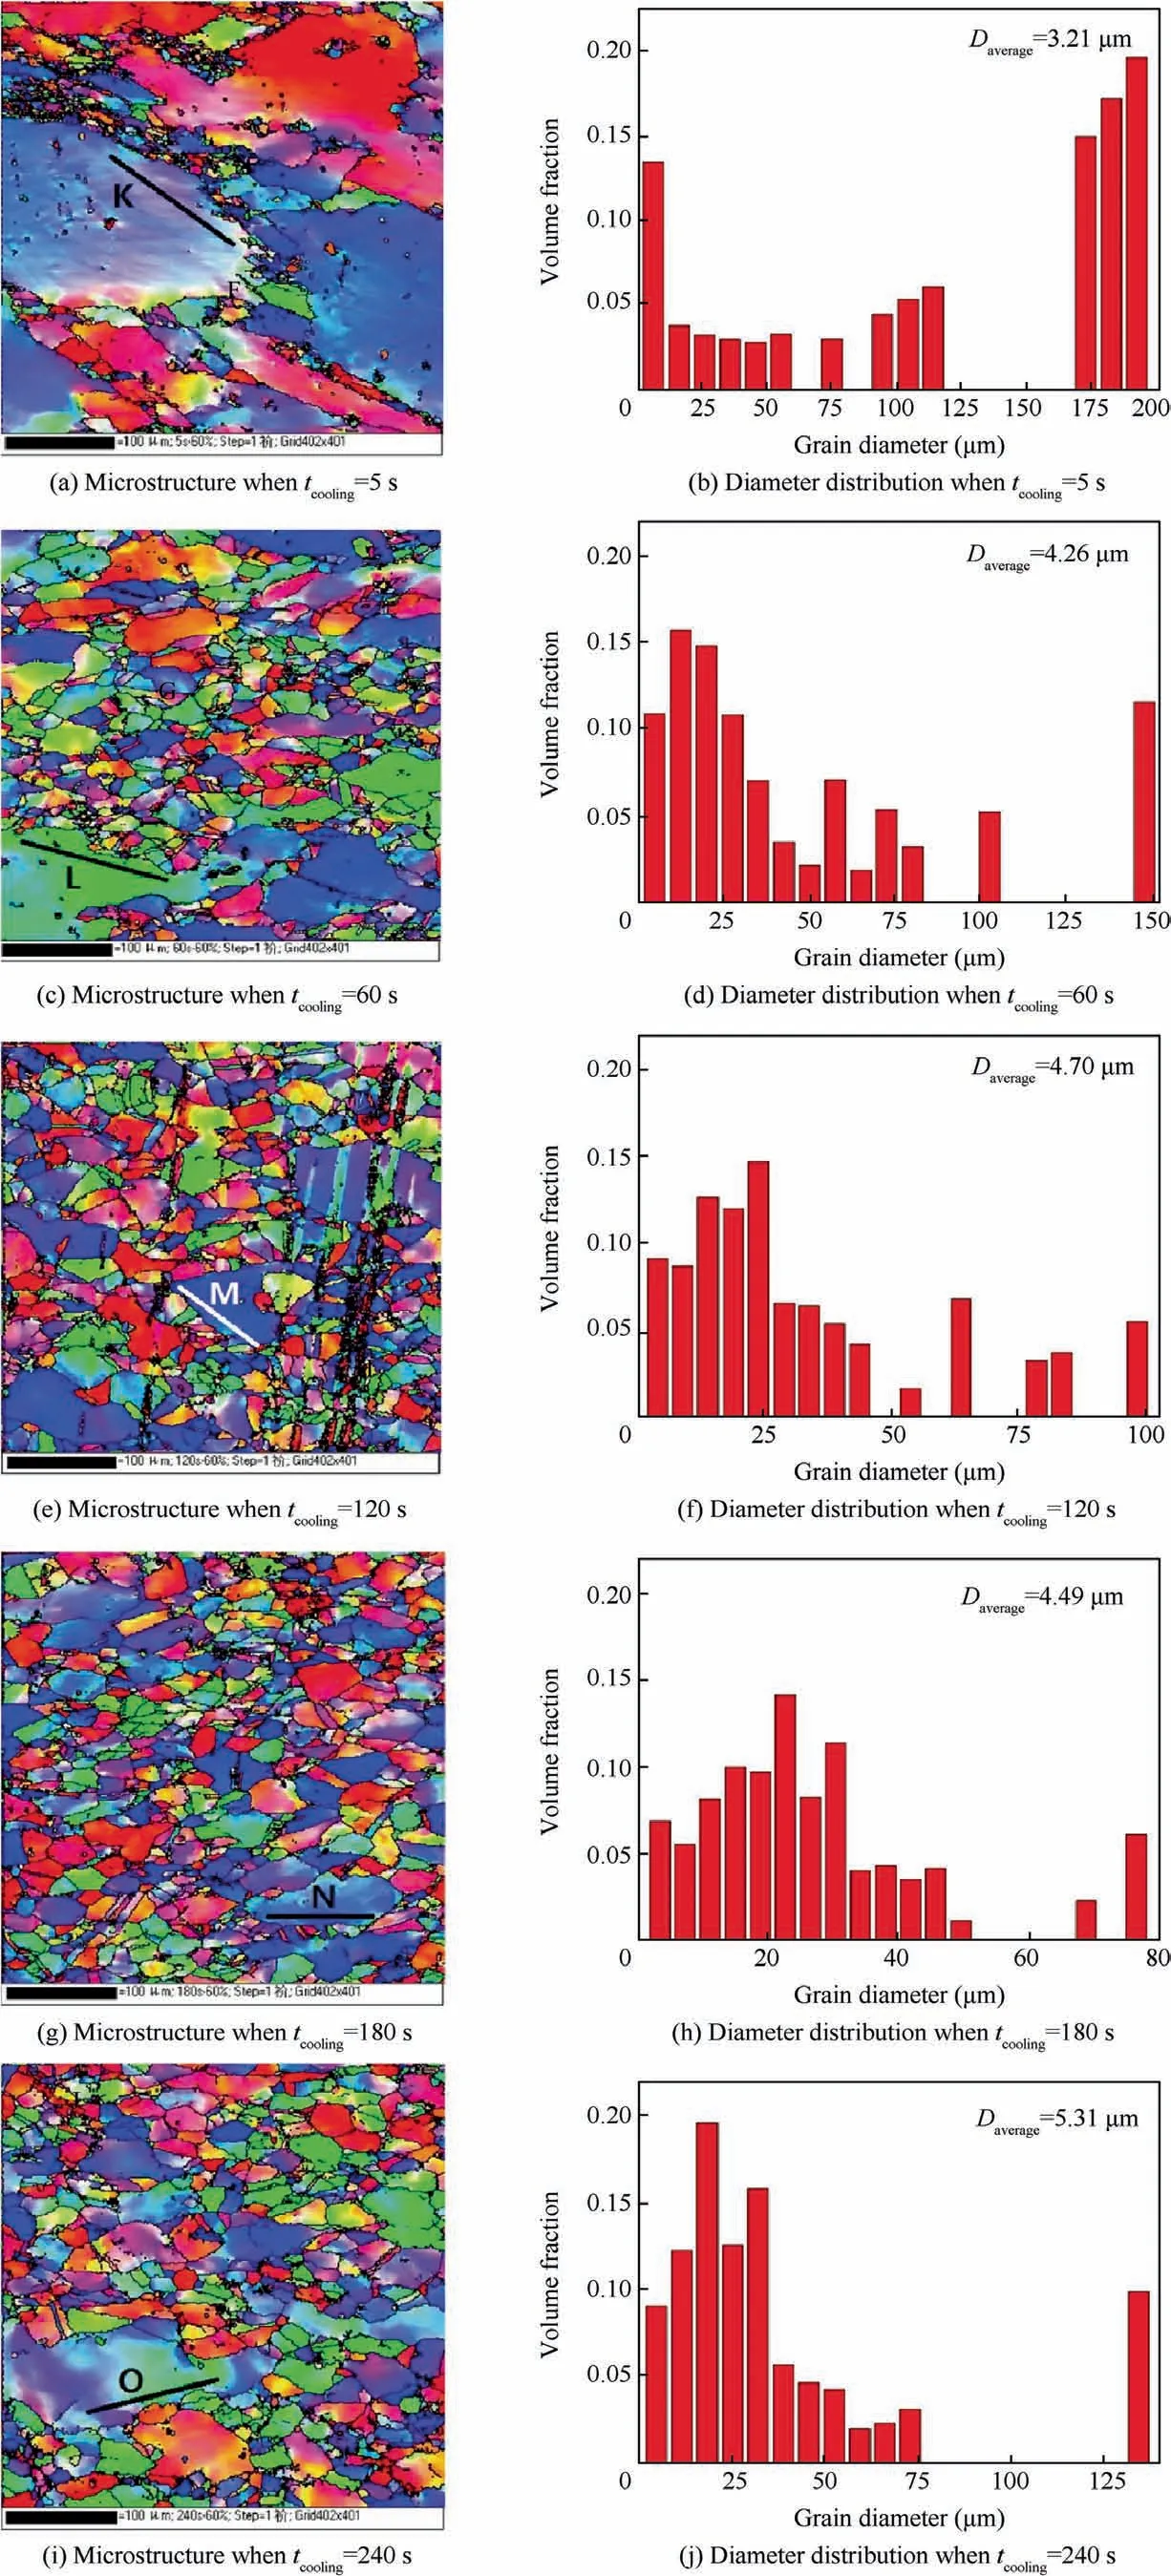
Fig.11 Microstructural evolution and grain diameter distribution of alloy at the end of complex thermal three-pass compression.
As for the WH behavior,it is obvious that the WH rate is higher than others when the cooling time is 5 s after the first inter-pass stage.When the cooling time exceeds 60 s,there is almost no difference in the variation of WH rates with an increase of the cooling time.It means that MDRX,which changes the texture in the inter-pass stage,has no obvious influence on the WH behavior when the accumulated strain is small.After the second inter-pass stage,WH decreases more obviously with the cooling time except for the 240 s condition.When the cooling time is 240 s,the WH rate is higher when compared with that under the 180 s condition.Above mentioned results indicate that the variation of WH behaviors with the cooling time and accumulated strain is also caused by the MDRX in the inter-pass.According to the phenomena of the texture evolution and the WH behavior,it is not difficult to perceive that the variation rules of the WH rate consist with the change of the texture intensity.According to the above discussion,the texture evolution is a key parameter during hot compression.Texture stands for the anisotropy of materials,which has a significant influence on macroscopic responses.The competition between deformation texture and recrystallization texture during the compression process decides the final texture type and intensity,and it is affected by the strain rate and temperature.Under a certain strain rate and temperature condition,the inter-pass stage decides the texture evolution.The MDRX process promotes a recrystallization texture with a decreasing cooling rate,and then the subsequent macroscopic responses will change.
MDRX in the inter-pass does affects not only on the macroscopic responses but also on the DRX process.Fig.11 shows the final microstructure of three-pass hot compression with different cooling times in the inter-pass.With above conditions in mind,the microstructural evolution in the third-pass is only affected by DRX.Fig.11(a)shows the microstructure at an inter-pass cooling time of 5 s during three-pass hot deformation,and it is obvious that the grains distribution is nonuniform.With an increase of the cooling time in the first and second inter-pass stages,the grains distribution is more uniform.The results show that the degree of MDRX in the inter-pass stage has a significance influence on the process of DRX.When the inter-pass cooling time is long,the process of MDRX is sufficient,and the final distribution of grains is more uniform,which can be found by comparing it with that in short-interruption hot compressive deformation.Fig.12 illustrates the variation of the average grain size.It is shown that with an increase of the cooling time,the average grain size increases.
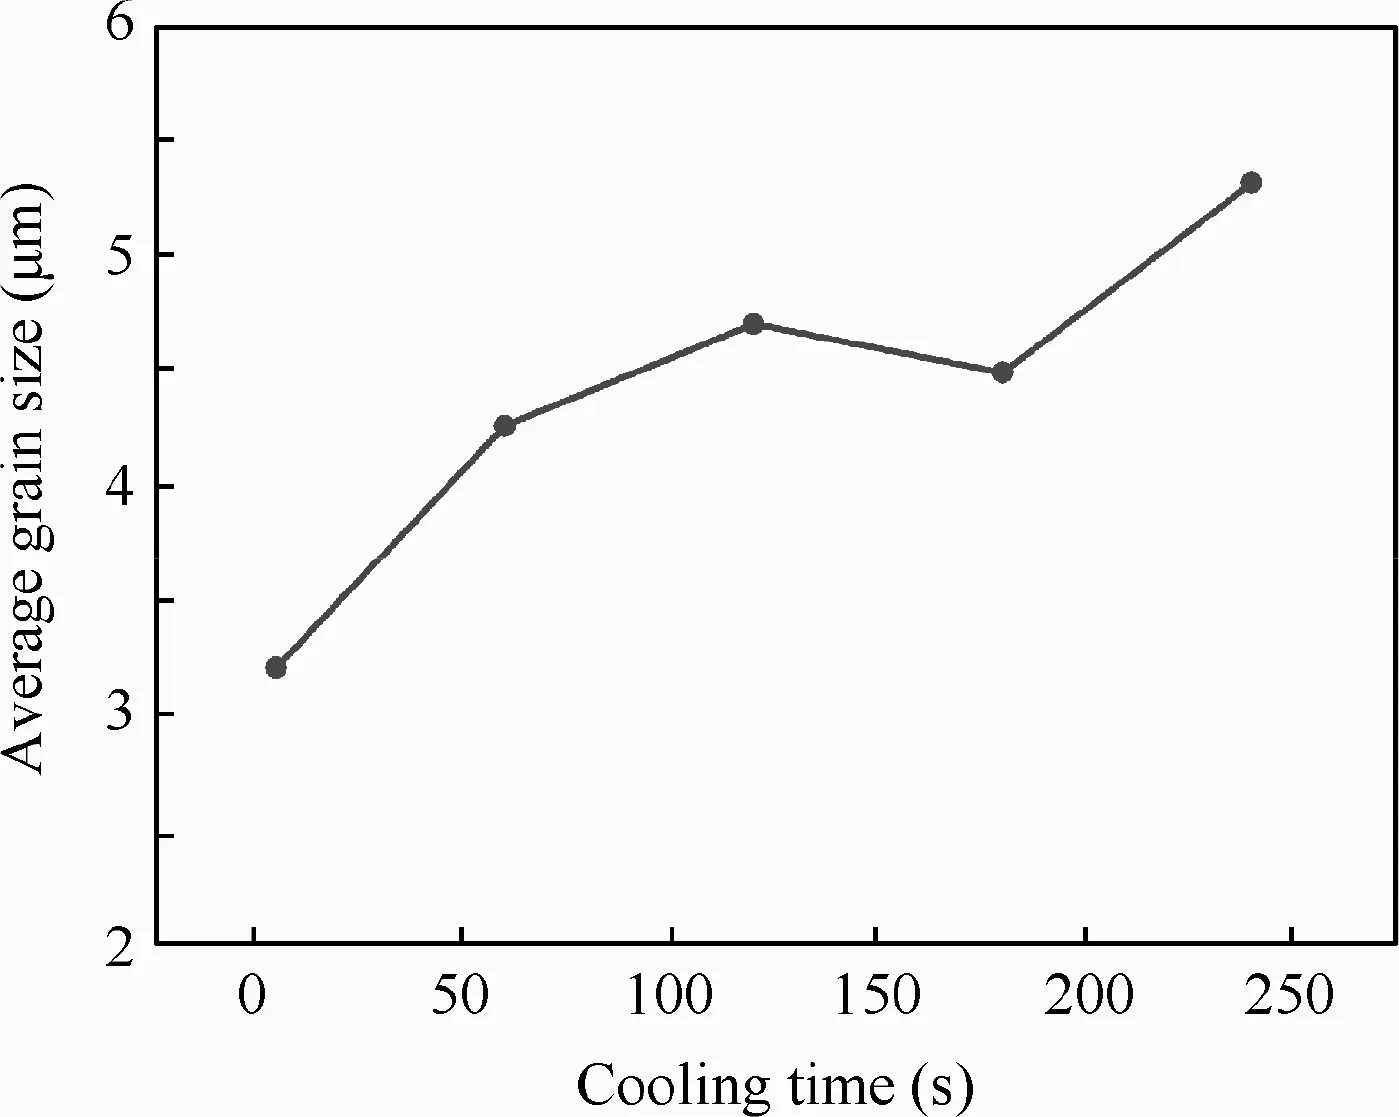
Fig.12 Evolution of the average grain size at the end of threepass compression.
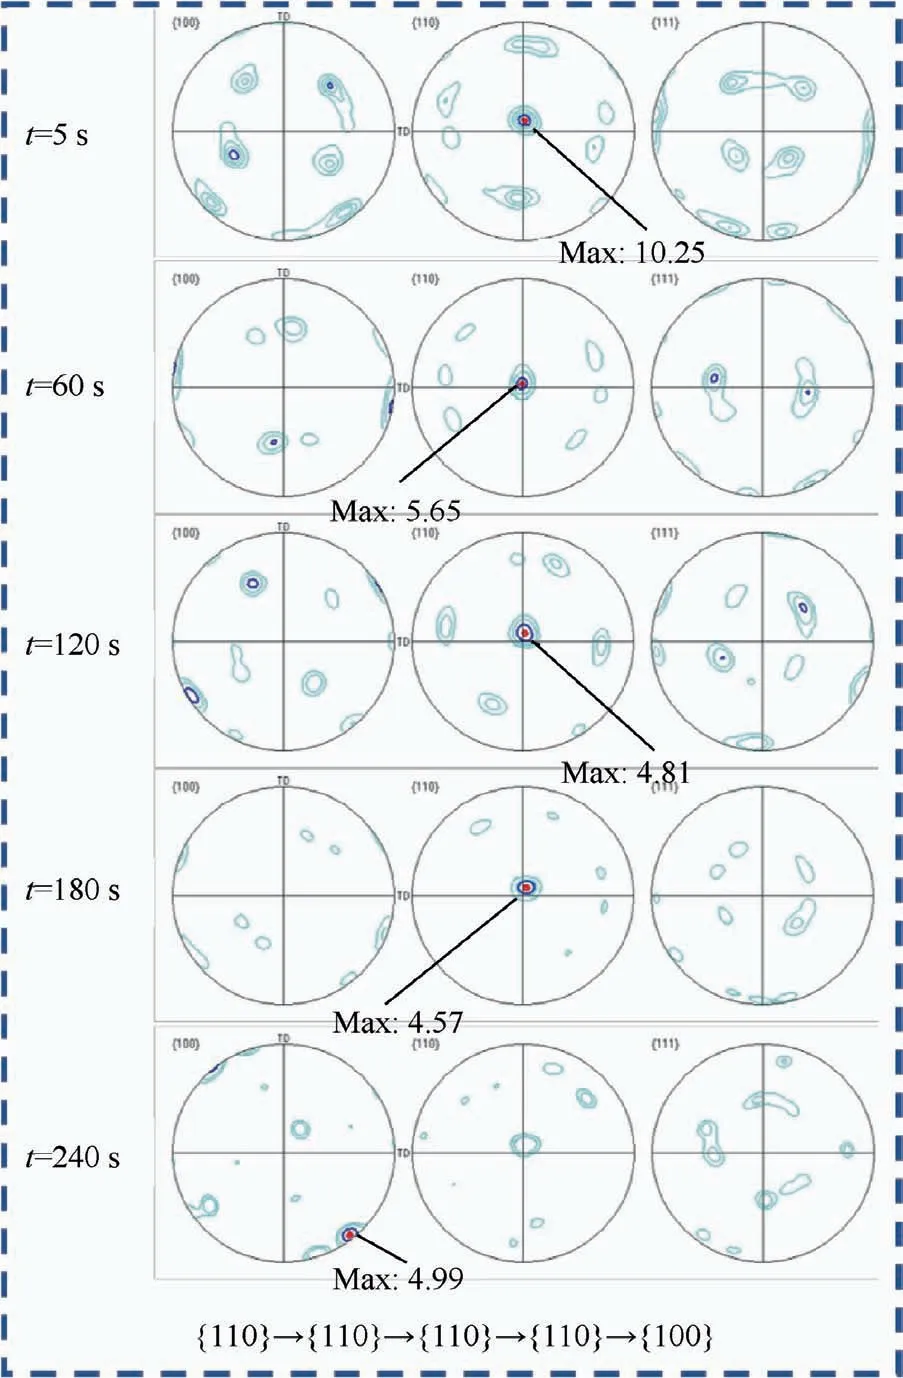
Fig.13 Evolution of the texture type at the end of three-pass compression.

Fig.14 Evolution of the texture intensity at the end of threepass compression.
However,the variation of texture type in the inter-pass stage almost has no influence on the final texture type when the cooling time is less than 240 s.Fig.13 shows the texture of deformed samples at the end of three-pass hot compression.The texture is the same in type,i.e.,the typical compressive texture{1 1 0},when the cooling time is less than 180 s during three-pass hot deformation.The texture intensity decreases with an increase of the cooling time in the inter-pass stage as shown in Fig.14.However,when the cooling time is 240 s during three-pass hot deformation,the texture type changes into{1 0 0}that is a recrystallization texture,and the texture intensity increases slightly.The main reasons can be explained below:MDRX is insufficient in the inter-pass stage when the cooling time is short,and the texture type is compression texture when the next compression stage begins.With an increase of the cooling time,the intensity of compression texture is weakened while the recrystallization texture becomes stronger,and thus the final texture intensity decreases even the texture type is still compression texture.When the texture type transforms into recrystallization texture completely in the inter-pass stage,the recrystallization texture dominates the final texture type after the third stage compression;meanwhile,the intensity of texture is increased.
3.3.A modified kinetic equation of MDRX for three-pass compression with different cooling times
In general, MDRX is the main mechanism resulting in microstructural evolution in the inter-pass stage,and the volume fraction of recrystallization determines the subsequent macro and micro behaviors.Therefore,a prediction of the MDRX fraction in the inter-pass stage under three-pass hot deformation is particularly important. According to the above-mentioned results,the MDRX behavior with different cooling times in the inter-pass stage is complex and more sensitive to the accumulated strain.The behavior of MDRX for the Ni-based superalloy during the two-pass stage in an isothermal condition was studied by Lin et al.,28and the kinetic equations were expressed as
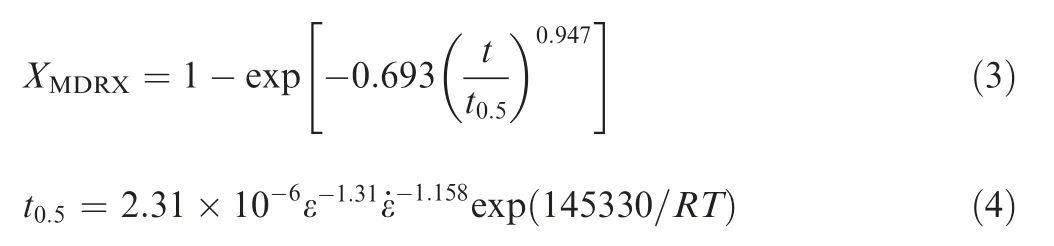
where t0.5represents the critical time for 50%MDRX,R is the gas constant(8.314 J·mol-1·K-1),and ε and ˙ε represent the strain and strain rate,respectively.Considering the kinetic equations that are deduced from an isothermal condition,and the uniform cooling condition in this work,temperature denoted by T(K)decreases for 100 K uniformly with different cooling times,which results in an increase of t0.5.The variation of temperature with an increasing cooling time,lntcooling,and the variation of t0.5with an increasing lntcoolingare shown in Fig.15.
A comparison between the calculated MDRX fraction and the experimental measurement is shown in Fig.16.In the first inter-pass stage(Fig.16(a)),it is obvious that the tendencies of these two results keep consistent;meanwhile,the difference between measured and calculated ones with different cooling times is very small.The maximal error between them is 5.3%when the cooling time is 120 s.The result indicates that the kinetic equations for calculating the fraction of MDRX in an isothermal condition is suitable for the three-pass interrupted deformation condition with only one cooling interval.
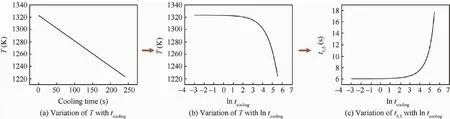
Fig.15 Calculations of parameters.
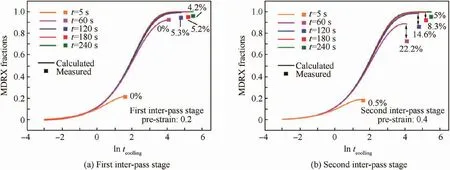
Fig.16 Comparison between calculated and experimentally measured values.
However,the difference between calculated and experimental results in the second inter-pass stage is large,as shown in Fig.16(b).When the cooling time is 60 s in the second inter-pass stage,the experimental result is smaller than the calculated one,and the error reaches 22.2%.Meanwhile,the error also decreases with an increase of the cooling time.The results show that the MDRX behavior is related to the hot deformation history,and a large error between calculated and measured values is due to a decrease of the accumulated strain energy because of the MDRX behavior in the former inter-pass stage.A slower cooling rate results in more fully recrystallization in the former inter-pass stage,and the accumulated strain energy in the present inter-pass is lower.However, the MDRX kinetic equation for two-pass hot deformation has not considered the former inter-pass stage.It can be found that t0.5is a critical parameter in the kinetic equations which are affected by the deformation history,and the value of ε is changed with different deformation histories,such as the former inter-pass stage,the cooling rate in the inter-pass,and so on.The modified t0.5is as follows:

where Xarepresents the volume fraction of MDRX in the former inter-pass stage,and εaand εbrepresent the previous and present compression strains,respectively.The accumulated strain energy decreases because of MDRX in the former inter-pass,and the present strain energy is determined by Xathat is influenced by the cooling time.The strain value is the sum of the residual strain in the former compression stage and the strain in the present compression stage.The relationships between the measured value and those predicted by the modified equation with different cooling times are illustrated in Fig.17.It shows that the experimental results consist well with the calculated ones.Therefore,the modified kinetic equation can predict the MDRX behavior under multi-pass compression with different conditions in the inter-pass of the investigated superalloy.
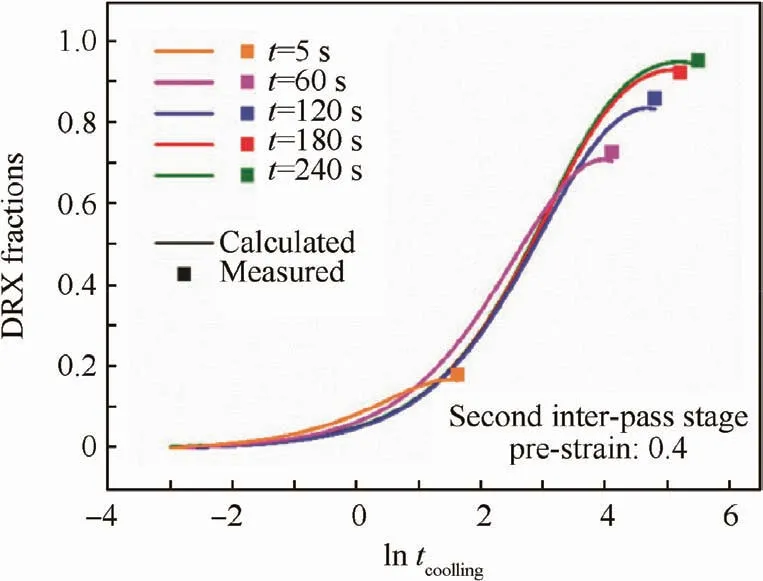
Fig.17 Comparison between measured and calculated values by the modified equation in the second inter-pass stage.
3.4.Nucleation mechanisms of DRX during three-pass hot compression with a cooling process
In order to investigate the influence of the deformation path on the DRX nucleation process during the hot compression stage,the fraction change of misorientation angles with varying cooling times in the inter-pass stage has been evaluated,as shown in Fig.18.It is found that the fraction of misorientation angles of 10°-15°is very small,and no obvious change can be found in the fraction under different strains or cooling times.LABs decrease while HABs increase with an increase of the cooling time when the accumulated strain is 0.2,but the variations of LABs and HABs are irregular with the change of cooling times when the accumulated strain is 0.4.
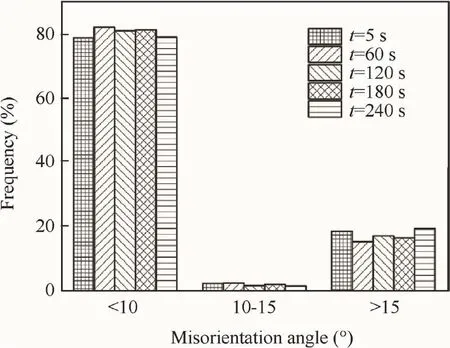
Fig.19 Fraction of misorientation angles with different cooling times before each stage at the end of three-pass compression.
However,the variations of LABs and HABs under different cooling times in the inter-pass stage almost have no influence on the distribution of misorientation angles during the third compressive stage,as shown in Fig.19.The LABs dominate the most part of misorientation angles,and the fraction of 10°-15° misorientation angles is very small. It is extensively acknowledged that a certain fraction of grain boundaries with misorientation angles of 10°-15°is considered as the requirement of CDRX nucleation,which is characterized by subgrain rotation.The results indicate that CDRX is not the primary nucleation mechanism,while DDRX is the main nucleation mechanism of the studied superalloy regardless of the complex deformation path.
The point-to-point(local)and point-to-origin(cumulative)misorientations are plotted along lines A-E in Fig.8 and lines F-J in Fig.9,and studied to assess the impact of the inter-pass cooling time on the misorientation distribution.As observed in Fig.20(a),the maximum of the local and cumulative misorientations does not exceed 2.2°within a distance of 60 μm in the sample at a cooling time of 5 s in the first inter-pass stage.When the cooling time increases,the value of the cumulative misorientation is essentially unchanged,as shown in Fig.20(a)-(e).It can be concluded that at a low accumulated strain,most of the subgrain boundaries are still under development.From Fig.20(f),the maximum of the local and cumulative misorientations increases slightly at a cooling time of 5 s and an accumulated strain of 0.4.However,when the cooling time increases,the cumulative misorientation increases obviously,which differs from that in the first inter-pass stage.Moreover,the value of the cumulative misorientation reaches 16°within a distance of 60 μm when the cooling time is 120 s,as shown in Fig.20(g)-(j).This indicates an occurrence of continuous progressive subgrain rotation at a higher strain.Recrystallization takes place in the inter-pass cooling process,which increases the misorientation gradient with an increase of the cooling time.
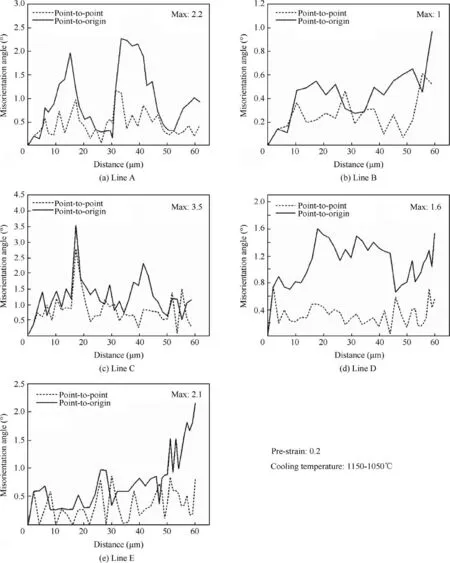
Fig.20 Orientation analysis of the Ni-based superalloy in complex thermal compression of which the misorientations are measured along lines A-E marked in Fig.8 and lines F-J in Fig.9.
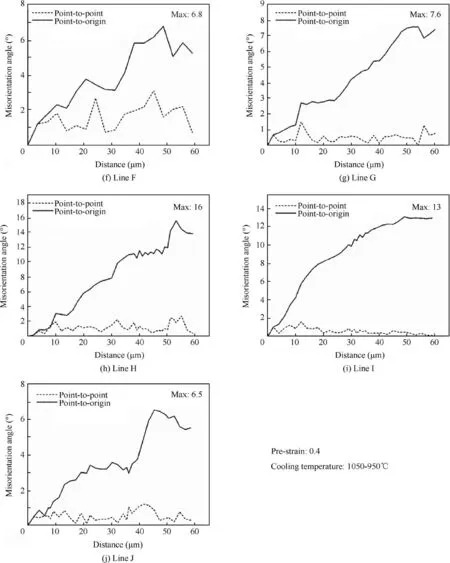
Fig.20(continued)
The local and cumulative misorientations of final microstructures are plotted along lines K-O drawn in Fig.11.As observed in Fig.21(a),the maximum of the local and cumulative misorientations is 4.1°for the sample with a cooling time of 5 s in the inter-pass stage and being compressed to a strain of 0.6.However,when the cooling time increases to 60 s,the cumulative misorientation along line L1 exceeds 14°within a distance of 60 μm,as shown in Fig.21(b).With an increase of the cooling time,the cumulative misorientation increases,and the cumulative misorientation is 28°within a distance of 50 μm when the cooling time is 180 s,as shown in Fig.21(d).Fig.21(a)-(e)show that the cumulative misorientations at the end of the three-pass compression display significant differences with different cooling times in the first and second inter-pass stages.This implies that the mechanism of CDRX plays a significant role in the DRX process during complex thermal compression.

Fig.21 Orientation analysis of the Ni-based superalloy in complex thermal compression of which the misorientations are measured along lines K-O marked in Fig.11.
It is well believed that DDRX and CDRX are the two main mechanisms for DRX.25,37DDRX characterized by bulging of the grain boundary contains nucleation and growth of DRX grains commonly,which usually occurs at low-stacking fault energy metals.38On the contrary,the nucleation mechanisms of CDRX can be described as progressive subgrain rotation,and usually occurs at metals with high-stacking fault energy.39The present study investigates the DRX nucleation mechanisms in complex thermal compression with different cooling times during deformation.The changes in the fractions of misorientation angles with different cooling times and accumulated strains have been evaluated to investigate the effect of subgrain rotation on the DRX nucleation mechanism.The results indicate that CDRX is not the main nucleation mechanism;however,with the variation of the cooling times in interrupted hot compression, the local and cumulative misorientations change under the same strain.These results indicate that both DDRX and CDRX occur in the third stage.DDRX is the primary nucleation mechanism of the studied superalloy under typical hot compression, while with an increase of the cooling time in the inter-pass stage,the degree of CDRX is increased.
4.Conclusions
The microstructural evolution of a Ni-based superalloy was studied by interrupted hot compression tests with inter-pass cooling.The effect of the cooling time(viz.different cooling rates in the present study)on the microstructural evolution was analyzed.The following conclusions can be made.
(1)MDRX is more sensitive to the accumulated strain than the temperature when the deformation temperature is above the recrystallization temperature.The variation rules of both the grain distribution and the texture intensity which are affected by MDRX coincide well with the variation rules of the YS and the WH rate in each stage.
(2)The degree of MDRX in the inter-pass stage affects the process of DRX during the subsequent deformation.The grain distribution is more uniform,and the texture type transforms to recrystallization texture from compression texture gradually with the degree of MDRX increasing in the inter-pass stage.
(3)A modified kinetic equation is established,and it can reasonably predict the MDRX behavior under multipass compression with different conditions in the interpass of the investigated superalloy.
(4)For the studied superalloy,both DDRX and CDRX occur under three-pass hot compression with different cooling times in the inter-pass.The DDRX mechanism is the major deformation mechanism for the Ni-based superalloy.However,the CDRX mechanism is promoted with an increasing cooling time in the inter-pass stage.
Acknowledgements
The authors would like to acknowledge supports from the National Natural Science Foundation of China(U1737212 and U1637102),the Research Fund of the State Key Laboratory of Solidification Processing(NWPU,China)(Grant No.149-QZ-2016),and the Fundamental Research Funds for the Central Universities(3102017jc03009).The Analytical&Testing Center at Northwestern Polytechnical University is also acknowledged for the experimental support on this work.
杂志排行

CHINESE JOURNAL OF AERONAUTICS的其它文章
- Guide for Authors
- Effect of W addition on phase transformation and microstructure of powder metallurgic Ti-22Al-25Nb alloys during quenching and furnace cooling
- Thermoelastohydrodynamic analysis of misaligned bearings with texture on journal surface under high-speed and heavy-load conditions
- Crystal orientation and morphology of α lamellae in wrought titanium alloys:On the role of microstructure evolution in β processing
- Three-dimensional finite-time cooperative guidance for multiple missiles without radial velocity measurements
- Data-driven model-free adaptive attitude control of partially constrained combined spacecraft with external disturbances and input saturation