Penman-Monteith模型模拟Venlo型温室黄瓜植株蒸腾
2019-05-24闫浩芳赵宝山付翰文鱼建军SamuelJoeAcquah
闫浩芳,赵宝山,张 川,黄 松,付翰文,鱼建军,Samuel Joe Acquah
Penman-Monteith模型模拟Venlo型温室黄瓜植株蒸腾
闫浩芳1,赵宝山1,张 川2,黄 松1,付翰文1,鱼建军1,Samuel Joe Acquah1
(1. 江苏大学流体机械工程技术研究中心,镇江 212013;2. 江苏大学农业工程研究院,镇江 212013)
准确模拟温室作物蒸腾对于制定科学合理的灌溉制度及温室环境调控具有重要意义,该研究基于2017年秋冬季和2018年春夏季Venlo型温室黄瓜生育期内微气象数据、黄瓜生长发育指标和植株蒸腾,对Penman-Monteith(PM)模型中关键参数—冠层阻力和空气动力学阻力进行研究。通过分析黄瓜叶片孔阻力与温室内气象因子的响应关系,构建了由黄瓜有效叶面积指数及叶片孔阻力模拟冠层阻力的子模型;采用基于风速的Perrier对数法和基于温室对流类型的热传输系数法计算温室内低风速环境下的空气动力学阻力,并评价不同方法的适用性。结果表明:叶片孔阻力与太阳辐射呈指数关系(2= 0.89),可通过观测温室内太阳辐射计算黄瓜叶片孔阻力;应用热传输系数法确定空气动力学阻力时,温室内对流类型绝大多数时间为混合对流;2种方法计算的温室内空气动力学阻力变化幅度均较小,Perrier对数法计算的春夏季和秋冬季空气动力学阻力平均值分别为388和383 s/m,热传输系数法计算的空气动力学阻力平均值分别为141和158 s/m;基于2种空气动力学阻力计算方法,PM模型模拟的植株蒸腾与实测值均具有较好的一致性,但采用Perrier对数法计算空气动力学阻力时,PM模型低估了植株蒸腾,春夏季和秋冬季拟合线斜率分别为0.87和0.91;而采用热传输系数法计算空气动力学阻力时,PM模型可更准确的模拟该地区温室黄瓜植株蒸腾,春夏季和秋冬季拟合线斜率分别为1.00和0.94,2分别为0.91和0.95,均方根误差分别为46.15和12.45 W/m2。该研究结果为实现PM模型在Venlo型温室环境的准确应用提供了参考。
蒸腾;热传输系数; 空气动力学;气孔阻力;冠层阻力;对流类型
0 引 言
准确模拟温室作物蒸腾(transpiration,T),对于制定科学合理的灌溉制度、实现温室环境调控及提高温室作物产量和品质具有重要意义[1-3]。目前,Penman- Monteith(PM)模型是温室作物蒸腾估算研究中应用最广泛和有效的机理模型[4-5],而准确应用PM模型的关键在于确定模型中2个主要参数—冠层阻力(r)和空气动力学阻力(r)[6-7]。r与r难以直接测量,国内外学者通常通过作物叶片气孔阻力(r)和有效叶面积指数的比值计算r[5,8-9],r可通过构建其与气象因子的相关关系来确定,如Qiu等[10-11]建立了观测温室内太阳辐射模拟温室辣椒和番茄叶片气孔阻力的关系。r控制冠层表面至参考高度处的水汽和热量传输,Perrier[12]基于紊流传输理论和假设对数的风速剖面,提出基于作物冠层特征和风速的对数函数来计算r(Perrier对数法),该方法在大田条件下被普遍应用,但刘浩等[13-15]认为在温室内风速较低的环境下,采用Perrier对数法高估了r。Bailey等[16]指出温室内水汽通过涡流方式扩散,认为r可通过热传输系数(h)来计算(热传输系数法),通过区分温室内对流类型(自由对流、强迫对流、混合对流)选取不同公式计算h。温室内对流类型的确定对r的估算精度具有重要影响[10,16],且对流类型的划分取决于温室通风状况及当地气候条件。Qiu等[10]研究表明,中国西北地区温室内对流类型主要为混合对流;Morille等[17]研究表明,法国西北部温室内白天为自由对流,夜间为混合对流。目前,针对Venlo型温室内对流类型的划分及基于该方法确定r的研究还未见报道,参数r和r的不确定性使得PM模型在中国南方地区Venlo型温室内的准确应用受到了限制。
因此,本研究选取温室内种植广泛的黄瓜为研究对象,通过观测温室内微气象数据、作物生长指标及植株蒸腾等数据,对PM模型中关键参数(r和r)进行确定;通过分析黄瓜叶片气孔阻力r与微气象因子的响应关系,构建基于r及作物有效叶面积指数的r子模型;分别采用Perrier对数法与热传输系数法计算r,比较并评价2种方法计算的r对PM模型输出精度的影响,基于Lysimeter称质量法实测的温室黄瓜植株蒸腾检验模型的估算精度,旨在为Venlo型温室内黄瓜精确灌溉和环境调控提供依据。
1 材料与方法
1.1 模型描述
1.1.1 计算温室作物蒸腾的PM模型
Penman-Monteith模型基于能量平衡和水汽扩散理论,综合考虑了冠层表面水汽蒸发过程中的物理和作物生理特性,被广泛应用于模拟温室作物蒸腾[18-19]。其表达式为


式中R为冠层上方的净辐射,W/m2,为作物冠层消光系数,LAI为叶面积指数。
冠层阻力r由叶片气孔阻力r与作物有效叶面积指数(LAIe)的比值计算[16]:
式中LAIe计算方法为[20]
1.1.2 计算空气动力学阻力的Perrier对数法
空气动力学阻力r受风速和气流流态等影响,采用Perrier[12]提出的公式计算r为

1.1.3 计算空气动力学阻力的热传输系数法
由于温室内水汽以涡流扩散方式为主,可通过热传输系数h确定温室内r[16]


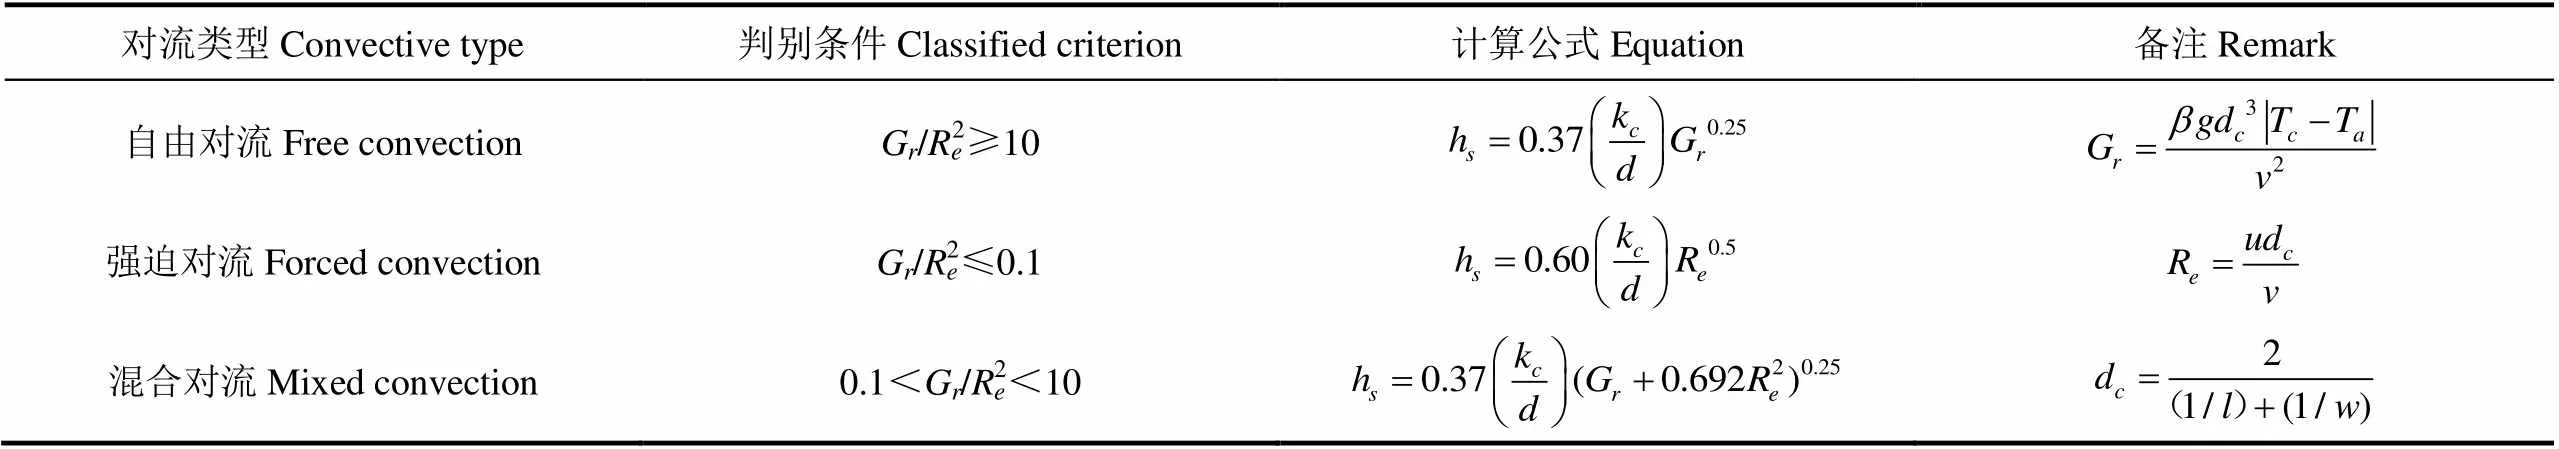
表1 温室内对流类型的判别及热传输系数hs的计算方法
注:G为高尔夫数,R为雷诺数,k为空气的导热系数,W·m–1·K–1;d为叶片特征长度,m;为叶片长度,m;为叶片宽度,m. T为冠层温度,℃;T为空气温度,℃;为空气的热膨胀系数,–1;为空气的运动黏度,m2·s–1;为风速,m·s–1;为重力加速度,m·s–2。
Note:Gis the Grashoff number;Ris the Reynolds number,kis the thermal conductivity of air, W·m–1·K–1;dis the characteristic dimension of the leaf, m;is the length of the leaves, m;is the width of the leaves , m;Tis the canopy temperature , ℃; Tis the air temperature, m;is the thermal expansion coefficient of air,–1;is the kinematic viscosity of air, m2·s–1;is the wind speed, m·s–1;is the the gravity acceleration, m·s–2.
1.2 试验方法
1.2.1 试验概况
试验地位于江苏省镇江市(32°11′N、119°125′E,海拔23 m),属亚热带季风气候区,多年平均降雨量为1 088 mm,常年平均气温15.4 ℃,年日照时数2 051.7 h,无霜期239 d。试验于江苏大学现代农业装备与技术实验室Venlo型温室内进行,温室覆盖材料为厚4 mm的浮法玻璃,屋脊南北走向,占地面积640 m2(32 m × 20 m)。温室天沟高3.8 m,檐高4.4 m,跨度 6.4 m,共5跨,每跨有2个小屋顶。秋冬季黄瓜于2017年8月21日育苗,9月2日移栽;春夏季黄瓜于2018年3月2日育苗,3月23日移栽,两季黄瓜品种均为油亮3-2。为预防黄瓜生长期发生病虫害,移栽前土壤中施50 %多菌灵可湿性粉剂杀菌,移栽后定期喷药。黄瓜移栽前在土壤中施有机肥作为底肥,并分别在开花坐果期和结果期补施含腐殖酸水溶性肥料(腐殖酸≥3.0%,N+P2O5+K2O≥35%)。试验地土壤质地为沙壤土,土壤中按约15 kg/hm2的比例均匀混合生物炭,混合后土壤容重为1.27 g/cm3,田间持水量为0.41 cm3/cm3。
1.2.2 黄瓜植株蒸腾及生长指标的测量
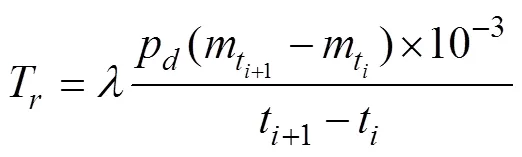
采用Lysimeter称质量法测量黄瓜植株蒸腾,用2台自动连续称质量电子天平(MS32000L,Mettler Toledo,荷兰)对桶栽黄瓜植株蒸腾进行观测,试验桶内径0.31 m,高0.50 m,试验过程中用塑料薄膜覆盖桶内土壤表面以阻止土面蒸发,桶内黄瓜植株间距和行距与温室内作物一致。天平放置于温室内黄瓜种植区域的中间位置,以减小边界条件的影响,天平每10 min自动读数,由数据采集器(CR1000,Campbell,美国)记录。本研究中蒸腾量在PM模型中以能量的单位(W/m2)表示,蒸腾量实测值由式(7)转换为

1.2.3 气象数据及黄瓜叶片气孔阻力的测定
温室内安装自动气象观测系统采集黄瓜生育期内气象数据。温室内1.5 m高处气温和相对湿度由温湿度传感器(S-THB-M002,Hobo,美国)测定,2 m高处风速由超声波风速仪(WindSonic,Gill,英国)测量。2.5 m处太阳净辐射由净辐射仪(NR Lite2,Kipp & Zonen,荷兰)观测,2.5 m处太阳辐射由辐射传感器(S-LIB-M003,Hobo,美国)观测,所有气象数据每10 s取样并取10 min的平均值,由数据采集器(CR1000,Campbell,美国)记录。黄瓜叶片气孔阻力由光合仪(GFS-3000,WALZ,德国)测量,选择晴朗天气每隔1 h测量黄瓜叶片气孔阻力,测量时段为08:00-18:00。黄瓜冠层温度由红外测温仪(SI-111,Apogee,美国)测量。
1.3 统计分析指标的计算
采用平均绝对误差(mean absolute error,MAE)、均方根误差(root mean square error,RMSE)和Nash-Sutcliffe效率系数(Nash-Sutcliffe efficiency coefficient,NSE)评价模型的计算精度。计算公式如下[22]:


2 结果与分析
2.1 黄瓜植株蒸腾与气象因子的演变规律
水分供给充足的情况下,作物蒸腾主要受气象因子的影响[23-24]。选择两季(春夏季(2018年5月8日-11日))和秋冬季(2017年11月8日-10日))黄瓜生长中期典型晴朗天气对温室内主要气象因子及黄瓜植株蒸腾的变化规律进行分析,图1数据为每日相同时刻相对应数据的平均结果。由图可知,T与R、T、T的变化趋势基本相同,与RH变化趋势相反。R在正午时段达到最大值,分别约为500 W/m2(春夏季)和180 W/m2(秋冬季)。RH的最大值、最小值和平均值依次约为85%、35%、60%(春夏季)和87%、45%、70%(秋冬季),秋冬季温室内RH整体高于春夏季。T在夜间很小,春夏季和秋冬季均值分别为14和6 W/m2,且基本保持恒定;白天T随R的增大而增大,在13:00左右达到最大值340 W/m2(春夏季)和140 W/m2(秋冬季),春夏季和秋冬季T日(24 h)平均值分别为98和36 W/m2,春夏季黄瓜T明显高于秋冬季。由于作物蒸腾作用使T降低,白天T较强时T明显低于T,这种趋势在T相对较强的春夏季更为明显,T与T的最大差值在春夏季为4.4℃,秋冬季为2.0℃;夜间春夏季T与T极为接近,但在秋冬季T高于T。在没有强制通风情况下,温室内风速极低,且基本保持恒定,春夏季和秋冬季温室内平均风速均为0.06 m/s。
2.2 黄瓜叶片气孔阻力的确定
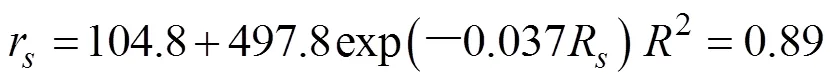
叶片气孔阻力r是确定PM模型中冠层阻力r的关键参数,r的大小由作物叶片气孔开闭程度决定,在充分供水条件下,气孔的开闭主要受气象因子的影响[17],因此可通过分析r与温室内气象因子的响应关系来确定r[6,17]。本研究对r与温室内气象因子相关关系分析结果显示,太阳辐射R为影响r的主要气象因子,两者呈指数函数关系,r随R的变化规律如图2所示,其关系式如下:
该研究结果与Jolliet等[8]、Qiu等[10]对温室番茄和甜椒的研究结果有相似的回归关系,即通过构建单一气象因子R与r的关系来确定温室作物r,但不同作物种类及温室气候环境使得不同研究中R与r的回归系数存在差异。从图2可看出,在R较低时,r较高,其原因为黄瓜叶片气孔在R较低时基本处于关闭状态,随着R的增大,叶片气孔打开并进行光合作用,气孔阻力迅速下降[4,21]。随着R继续增大,r降低速度变缓,当R大于100 W/m2时,气孔阻力基本稳定在100 s/m,该结果与罗卫红等[2]在附近地区对Venlo型温室冬季黄瓜r的研究结果相符,但低于Yang等[25]对美国中东部地区温室黄瓜的研究结果,不同的地区气候条件和温室内种植管理方式可能是造成结果存在差异的主要原因。
注:R为太阳辐射,T为黄瓜蒸腾量,RH为相对湿度,T为气温,T为冠层温度,为风速。
Note:Ris solar radiation,Tis cucumber transpiration, RH is relative humidity,Tis air temperature,Tis canopy temperature, andis wind speed.
图1 不同种植季节黄瓜植株蒸腾及温室内气象因子的变化
Fig.1 Variations of transpiration and meteorological factors of cucumber at different planting seasons in greenhouse
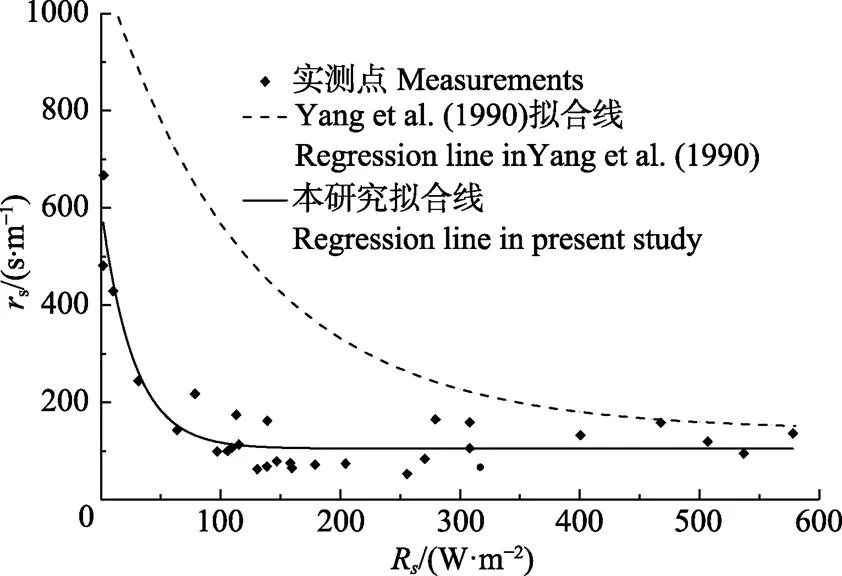
图2 黄瓜叶片气孔阻力rs与太阳辐射Rs的关系
2.3 模型参数rc与ra的确定
通过观测作物冠层温度、空气温度、温室内风速及黄瓜生长特征等资料,基于表1对温室内对流类型进行判别,并采用热传输系数法计算r。结果显示,在温室没有强制通风的条件下,春夏季和秋冬季温室内主要对流类型为混合对流,发生混合对流的时段占总计算时段的比例分别为80%(春夏季)和94%(秋冬季)。不同种植季节,自由对流和强迫对流发生的时段存在差异,春夏季5%的时间为自由对流,主要发生在白天,15%的时间为强迫对流,全部发生在夜间;秋冬季2%的时间为自由对流,全部在白天,4%的时间为强迫对流,白天和夜间均有发生。温室内大多数时间的对流类型为混合对流,与Qiu等[10]在西北地区日光温室内研究得出的结果相似,但本研究中自由对流主要发生在白天,Qiu等[10]的研究表明自由对流主要发生在夜间和清晨,强迫对流没有发生,温室类型的不同和地区气候的差异可能是造成结果不同的原因。
图3为根据黄瓜叶片气孔阻力r和有效叶面积指数确定的冠层阻力参数r,以及采用Perrier对数法和热传输系数法计算的空气动力学阻力(P和H)在晴天的变化规律,图3a与图3b为不同种植季节黄瓜生长中期(春夏季:2018年5月9日,秋冬季:2017年11月8日)的计算结果。从图中可看出,r在夜间较大且恒定,春夏季和秋冬季r值分别为533和574 s/m;白天日出前后变幅较大,其值随日出迅速下降,春夏季07:00-17:00变化稳定,该时段r均值为96 s/m,18:00之后r值迅速升高;秋冬季09:00-15:00变化幅度较小,该时段r均值为112 s/m,16:00之后r迅速升高。2种方法计算的r(P和H)变化较r稳定,其值在白天均高于r,且P法的计算值在两季中整体高于H法的计算结果,春夏季和秋冬季P的平均值分别为388和383 s/m;而H值较P变化幅度小,计算的平均值分别为141和158 s/m。以往学者对不同地区温室作物r的研究取得了不同的结果,Villarreal-Guerrero等[21]在美国西南部研究表明,温室甜椒和番茄的r分别为59和70 s/m,Morille等[17]在法国西北部研究结果显示温室内新几内亚凤仙花的r平均为220 s/m。
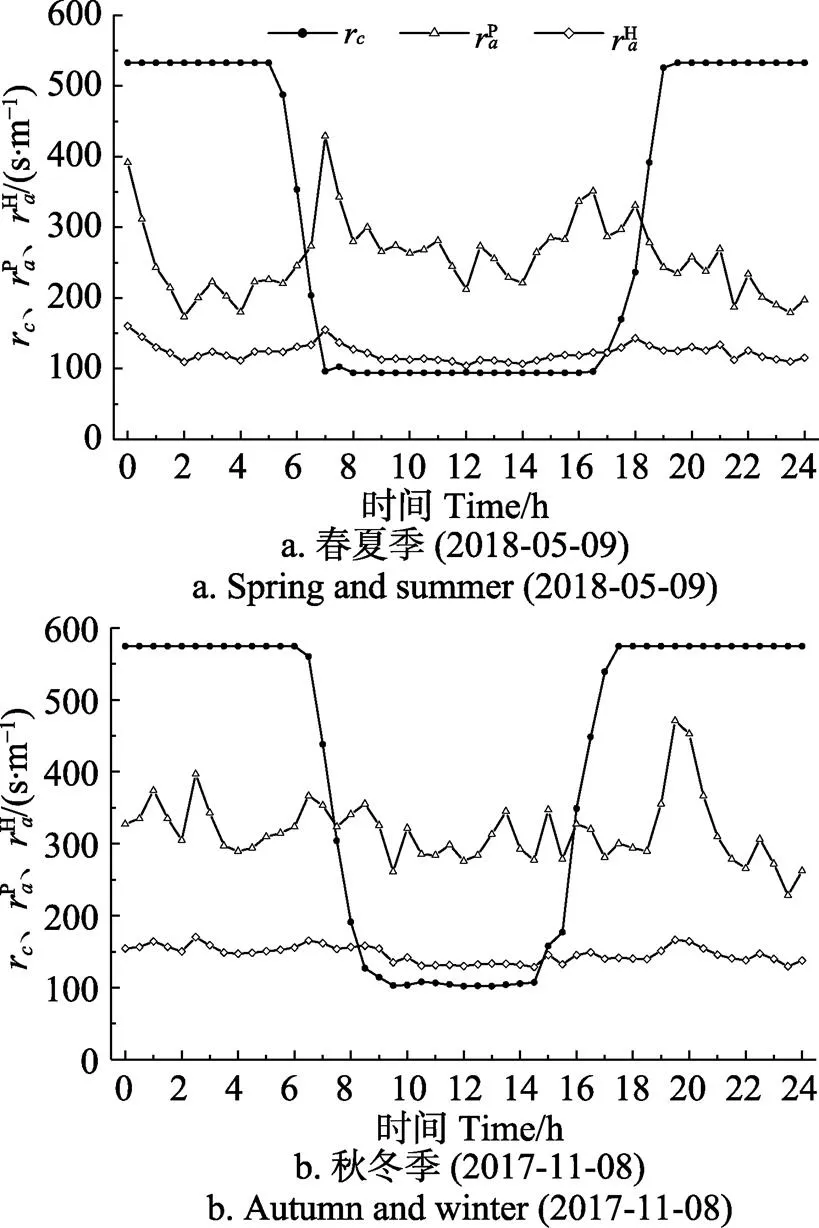
注:rP a和rH a分别为采用Perrier对数法和热传输系数法计算的空气动力学阻力。
2.4 基于不同ra及rc评价PM模型的模拟精度
将基于气孔阻力r估算的r及2种r计算方法(Perrier对数法和热传输系数法)分别应用于PM模型,对不同种植季节温室黄瓜植株蒸腾T进行模拟。基于2种r方法模拟的T与实测值的比较结果如图4所示,图中数据为黄瓜生育中期选取晴天每日相对应数据的平均值(春夏季:2018年5月8日-15日,秋冬季:2017年11月7日-10日)。由图4可知,采用PM-P法和PM-H法计算的T与实测值变化趋势基本相同,且较为接近。PM-P法和PM-H法在上午时段均高估了T;但在下午时段PM-H法的模拟结果与实测值极为接近,PM-P法却明显低估了T实测值。在T较小的夜间,PM-P和PM-H法的模拟结果均略低于实测T。此外,在12:00左右,PM-P和PM-H的模拟结果出现突然下降的趋势,引起该下降的原因为该时段PM模型中主要输入变量太阳净辐射在观测过程中受到温室横梁的遮挡而产生突然下降。
图5为不同种植季节PM-P法和PM-H法模拟T与实测值的线性拟合结果(春夏季:2018年5月8日—15日,秋冬季:2017年11月7日—10日)。当T较小时,PM-P法和PM-H法的模拟结果与实测T的拟合点均分布在1∶1线附近,表明当T较小时,Perrier对数法和热传输系数法计算r对于PM模型输出精度影响不大,2种方法均适用于PM模型对T的模拟,随着实测T逐渐增大,拟合点的分散程度逐渐增大。PM-P法在两季中的模拟值与实测T的拟合线都在1∶1线的下方,表明采用Perrier对数法计算r都使得PM模型低估T,其低估程度在秋冬季略高于春夏季。在不同种植季节,采用PM-H法的模拟结果与实测值的拟合线与1∶1线极为接近。

注:PM-rP a和PM-rH a分别表示PM模型中参数ra采用Perrier对数法和热传输系数法确定。
为进一步评价PM模型对南方地区温室黄瓜T的模拟精度,将基于2种r计算方法的PM模型模拟的T与实测值进行统计分析(表2)。结果表明,Perrier对数法计算r应用于PM模型时低估了T,春夏季和秋冬季模拟值与实测值拟合线斜率分别为0.91和0.78, RMSE分别为52.48和17.89 W/m2;而热传输系数法计算r应用于PM模型时可准确模拟温室黄瓜T,春夏季和秋冬季模拟值与实测值的拟合线斜率分别为1.00和0.94,RMSE分别为46.15和12.45 W/m2, NSE均大于0.8。春夏季实测T的均值为94.00 W/m2,PM-P和PM-H法模拟均值分别为78.58和90.07 W/m2;秋冬季实测T均值为31.79 W/m2,2种方法模拟均值分别为23.30 和30.20 W/m2,PM-H法模拟的T均值在不同种植季节均与实测T的均值极为接近。综合各项统计指标可知,模拟温室黄瓜T时,PM-H法较PM-P法具有更高的精度,基于PM-H法可准确模拟温室黄瓜T。

图5 基于不同ra计算方法PM模型模拟蒸腾值与实测值的比较

表2 基于不同ra计算方法PM模型模拟温室黄瓜Tr与实测值的统计分析
注:Testimated和Tmeasured分别表示T的模拟值和实测值;2为决定系数;MAE、RMSE和NSE分别为绝对误差、均方根误差和Nash-Sutcliffe 效率系数;`Testimated和`Tmeasured分别表示T实测值和模拟值的平均值;为样点个数。
Note:TestimatedandTmeasuredare estimated and measured transpiration values, respectively;2is coefficient of determination; MAE is mean absolute error; RMSE is root mean square error; NSE is Nash-Sutcliffe efficiency;`Testimatedand`Tmeasuredare the mean transpiration of estimated and measured, respectively;is total number of observations.
3 讨 论
温室作物生产中,灌溉管理和环境调控通常需要准确模拟短时间尺度作物的蒸腾[26-27]。本研究基于0.5 h时间尺度下温室黄瓜T,确定了PM模型中关键参数r和r的计算方法,实现了PM模型在Venlo型温室内的准确应用。参数r可通过叶面积指数将植株叶片气孔阻力扩展到冠层尺度推算而来[28],而气孔阻力的大小在作物水分供给充足的条件下主要受气象因子的影响,因此气孔阻力可表示为不同气象因子的函数关系。本研究发现黄瓜叶片气孔阻力与太阳辐射呈显著的指数函数关系(图2,式(11)),通过实测太阳辐射可模拟黄瓜叶片气孔阻力,与以往对温室其他作物,如西葫芦[5]、辣椒[10]和番茄[8,11]等的研究结果一致。
Perrier对数法在大田条件下被普遍应用于计算r,但在温室低风速环境下,本研究得出采用该方法计算r使得PM模型低估了T,与以往学者[13-15]指出的Perrier对数法不适合温室低风速环境的观点相符,但也有研究报道Perrier对数法可应用于计算温室内r,如Gong等[11]认为采用该方法计算r应用于PM模型可用来模拟中国华北地区日光温室番茄的蒸发蒸腾量。本研究中,基于Perrier对数法计算的温室内r均高于热传输系数法的计算结果,热传输系数法计算的r应用于PM模型可准确模拟南方地区温室黄瓜T。采用热传输系数法时,需要确定温室内对流类型,Rouphael等[5]在地中海地区研究表明,当假定温室内对流类型为强迫对流或混合对流时,基于该方法计算的r应用于PM模型可准确模拟温室西葫芦蒸腾,而Montero等[4]通过分别假设试算3种对流条件下温室内r并应用于PM模型,发现温室对流类型为自由对流时,模型结果表现最好。本研究结果表明,中国南方地区Venlo型温室内对流类型主要为混合对流,采用混合对流条件下热传输系数计算r,PM模型可准确模拟温室黄瓜T,与Qiu等[10]在中国西北地区日光温室内取得相似的研究结果。此外,Stanghellini[29]和Villarreal-Guerrero等[21]指出由于温室内风速较稳定,使得r变化幅度较小,对r取固定值对PM模型模拟精度的影响并不显著。综上,在不同地区温室或不同作物条件下,温室内的对流类型,以及温室低风速环境下 PM模型中参数r的研究结果仍存在较大差异。
基于本研究确定的模型参数r和热传输系数法计算的r,PM模型可准确估算该地区Venlo型温室内黄瓜T,研究成果为温室黄瓜的精确灌溉和温室环境调控提供了重要依据。作物生长中期是整个生育期需水最旺盛的阶段,也是果实生长和收获的关键时期[30]。本研究针对PM模型估算温室黄瓜生长中期T及模型关键参数的确定进行了研究,该生长阶段作物冠层完全覆盖地面,而对于作物冠层覆盖稀疏的其他生育阶段,PM模型的适用性及模型参数的确定方法仍存在争议[31]。因此,该研究结果对于预测温室黄瓜其他生长阶段T的适用性有待进一步验证。
4 结 论
本研究通过观测Venlo型温室黄瓜不同种植季节微气象数据、黄瓜生长生育指标、叶片气孔阻力及植株蒸腾等数据,对PM模型中关键参数的确定方法进行了研究。通过分析温室黄瓜叶片气孔阻力r与温室内气象因子的相关关系,确定了太阳辐射为影响黄瓜气孔阻力的主要气象因子,且与气孔阻力呈指数函数关系(2= 0.89);通过r及有效叶面积指数对冠层阻力参数r进行模拟并分析其变化规律。采用2种方法(Perrier对数法和热传输系数法)对空气动力学阻力参数r进行了计算,检验了不同r计算方法对PM模型估算温室黄瓜植株蒸腾T的精确性的影响,并采用Lysimeter称重法实测T验证PM模型的估算精度。具体结论如下:
1)温室黄瓜T与太阳辐射、气温及冠层温度呈相似的变化规律,均在中午达到最大值,与空气相对湿度变化趋势相反。由于作物蒸腾降低冠层温度,白天冠层温度明显低于气温,气温和冠层温度的最大差值为4.4 ℃(春夏季)和2.0 ℃(秋冬季)。
2)通过叶片气孔阻力r和有效叶面积指数确定的r在夜间保持恒定,春夏季和秋冬季均值分别为533和574 s/m,在T较强的白天,均值分别为96(春夏季)和112 s/m(秋冬季)。Perrier对数法计算的春夏季和秋冬季r平均值分别为388和383 s/m,热传输系数法计算的r变化幅度较小,平均值分别为141和158 s/m。
3)在没有强制通风设置时,温室内的对流类型主要为混合对流,春夏季和秋冬季混合对流发生时间占研究时段的80 %和94 %。基于热传输系数法计算空气动力学阻力参数r,PM模型可以更准确模拟南方地区温室黄瓜T,实测值与模拟值拟合线斜率分别为1.00(春夏季)和0.94(秋冬季),基于Perrier对数法计算r时,PM模型低估了温室黄瓜T,实测值与模拟值拟合线斜率分别为0.91(春夏季)和0.78(秋冬季)。
[1] 李建明,樊翔宇,闫芳芳,等. 基于蒸腾模型决策的灌溉量对甜瓜产量及品质的影响[J]. 农业工程学报,2017,33(21):156-162. Li Jianming, Fan Xiangyu, Yan Fangfang, et al. Effect of different irrigation amount based on transpiration model on yield and quality of muskmelon[J]. Transactions of the Chinese Society of Agricultural Engineering (Transactions of the CSAE), 2017, 33(21): 156-162. (in Chinese with English abstract)
[2] 罗卫红,汪小旵,戴剑峰,等. 南方现代化温室黄瓜冬季蒸腾测量与模拟研究[J]. 植物生态学报,2004,28(1):59-65. Luo Weihong, Wang Xiaohan, Dai Jianfeng, et al. Measurement and simulation of cucumber canopy transpiration in a subtropical modern greenhouse under winter climate conditions[J]. Acta Phytoecologica Sinica, 2004, 28(1): 59-65. (in Chinese with English abstract)
[3] 刘浩,段爱旺,孙景生,等. 温室番茄节水调质灌水方案评价[J]. 排灌机械工程学报,2014,32(6):529-534. Liu Hao, Duan Aiwang, Sun Jingsheng, et al. Evaluation of irrigation scheme with high quality and efficiency for greenhouse grown tomato[J]. Journal of Drainage and Irrigation Machinery Engineering, 2014, 32(6): 529-534. (in Chinese with English abstract)
[4] Montero J I, Antón A, Muñoz P, et al. Transpiration from geranium grown under high temperatures and low humidities in greenhouses[J]. Agricultural & Forest Meteorology, 2001, 107(4): 323-332.
[5] Rouphael Y, Colla G. Modelling the transpiration of a greenhouse zucchini crop grown under a Mediterranean climate using the Penman-Monteith equation and its simplified version[J]. Crop & Pasture Science, 2004, 55(9): 931-937.
[6] Yan H, Zhang C, Miriam C G, et al. Parametrization of aerodynamic and canopy resistances for modeling evapotranspiration of greenhouse cucumber[J]. Agricultural and Forest Meteorology, 2018, 262: 370-378.
[7] Yan H, Zhang C, Hiroki O. Parameterization of canopy resistance for modeling the energy partitioning of a paddy rice field[J]. Paddy & Water Environment, 2018, 16(2): 1-15.
[8] Jolliet O, Bailey B J. The effect of climate on tomato transpiration in greenhouses: Measurements and models comparison[J]. Agricultural & Forest Meteorology, 1992, 58(1/2): 43-62.
[9] 邱让建. 温室环境下土壤-植物系统水热形态与模拟[D]. 北京:中国农业大学,2014. Qiu Rangjian. Water and Heat Dynamics and Simulation in Soil-plant System in Greenhouse[D]. Beijing: China Agricultural University, 2014. (in Chinese with English abstract)
[10] Qiu R, Kang S, Du T, et al. Effect of convection on the Penman–Monteith model estimates of transpiration of hot pepper grown in solar greenhouse[J]. Scientia Horticulturae, 2013, 160(3): 163-171.
[11] Gong X, Liu H, Sun J, et al. A proposed surface resistance model for the Penman-Monteith formula to estimate evapotranspiration in a solar greenhouse[J]. Journal of Arid Land, 2017(4): 1-17.
[12] Perrier A. Etude de l’évapotranspiration dans les conditions naturelles. III Evapotranspiration réelle et potentielle des couverts végétaux[J]. Ann Agronomiques 1975, 26: 229-245.
[13] 刘浩,段爱旺,孙景生,等. 基于Penman-Monteith方程的日光温室番茄蒸腾量估算模型[J]. 农业工程学报,2011,27(9):208-213. Liu Hao, Duan Aiwang, Sun Jingsheng, et al. Estimating model of transpiration for greenhouse tomato based on Penman-Monteith equation[J]. Transactions of the Chinese Society of Agricultural Engineering (Transactions of the CSAE), 2011, 27(9): 208-213. (in Chinese with English abstract)
[14] 赵宝山,闫浩芳,张川,等. Venlo型温室内参考作物蒸散量计算方法比较研究[J]. 灌溉排水学报,2018,37(7):61-66. Zhao Baoshan, Yan Haofang, Zhang Chuan, et al. Comparison of different methods for calculating the evapotranspiration in a Venlo-type Greenhouse[J]. Journal of Irrigation and Drainage, 2018, 37(7): 61-66. (in Chinese with English abstract)
[15] 王健,蔡焕杰,李红星,等. 日光温室作物蒸发蒸腾量的计算方法研究及其评价[J]. 灌溉排水学报,2006,25(6):11-14. Wang Jian, Cai Huanjie, Li Hongxing, et al. Study and evaluation of the calculation methods of reference crop evapotranspiration in solar-heated greenhouse [J]. Journal of Irrigation and Drainage, 2006, 25(6): 11-14. (in Chinese with English abstract)
[16] Bailey B J, Montero J I, Biel C, et al. Transpiration of Ficus benjamina: Comparison of measurements with predictions of the Penman-Monteith model and a simplified version[J]. Agricultural & Forest Meteorology, 1993, 65(3/4): 229-243.
[17] Morille B, Migeon C, Bournet P E. Is the Penman–Monteith model adapted to predict crop transpiration under greenhouse conditions? Application to a New Guinea Impatiens crop[J]. Scientia Horticulturae, 2013, 152(152): 80-91.
[18] Allen R G, Pereira L S, Raes D, et al. Crop evapotranspiration. guidelines for computing crop water requirements[R]. Irrigation and Drainage Paper No. 56. Rome: FAO, 1998.
[19] 邱让建,杜太生,刘春伟,等. 温室作物蒸发蒸腾发估算模型研究进展[J]. 灌溉排水学报,2015,34(增刊2):134-139. Qiu Rangjian, Du Taisheng, Liu Chunwei, et al. Review of evapotranspiration estimation model of crops grown in greenhouses[J]. Journal of Irrigation and Drainage, 2015, 34(Supp.2): 134-139. (in Chinese with English abstract)
[20] Allen R G, Pruitt W O, Wright J L, et al. A recommendation on standardized surface resistance for hourly calculation of reference ET0by the FAO56 Penman-Monteith method[J]. Agricultural Water Management, 2006, 81(1/2): 1-22.
[21] Villarreal-Guerrero F, Kacira M, Fitz-Rodríguez E, et al. Comparison of three evapotranspiration models for a greenhouse cooling strategy with natural ventilation and variable high pressure fogging[J]. Scientia Horticulturae, 2012, 134(2): 210-221.
[22] 邵崇斌,徐钊. 概率论与数理统计[M]. 北京:中国农业出版社,2007.
[23] Prenger J J, Fynn R P, Hansen R C. A comparison of four evapotranspiration models in a greenhouse environment[J]. Transactions of the ASAE, 2002, 45(6): 1779-1788.
[24] 陈新明,蔡焕杰,李红星,等. 温室大棚内作物蒸发蒸腾量计算[J]. 应用生态学报,2007,18(2):317-321. Chen Xinming, Cai Huanjie, Li Hongxing, et al. Calculation of crop evapotranspiration in greenhouse[J]. The Journal of Applied Ecology, 2007, 18(2): 317-321. (in Chinese with English abstract)
[25] Yang X, Short T H, Fox R D, et al. Transpiration, leaf temperature and stomatal resistance of a greenhouse cucumber crop[J]. Agricultural & Forest Meteorology, 1990, 51(3): 197-209.
[26] Bontsema J, Hemming J, Stanghellini C, et al. On-line estimation of the transpiration in greenhouse horticulture[J]. Proceedings Agricontrol, 2008, 90(1): 71-77.
[27] Demrati H, Boulard T, Fatnassi H, et al. Microclimate and transpiration of a greenhouse banana crop[J]. Biosystems Engineering, 2007, 98(1): 66-78.
[28] 李彩霞,周新国,孙景生. 基于冠层上下部温差的冠层阻力计算[J]. 农业工程学报,2013,29(10):123-129. Li Caixia, Zhou Xinguo, Sun Jingsheng. Calculation of canopy resistance using air temperature difference between canopy top and bottom[J]. Transactions of the Chinese Society of Agricultural Engineering (Transactions of the CSAE), 2013, 29(10): 123-129. (in Chinese with English abstract)
[29] Stanghellini C. Transpiration of Greenhouse Crops: An Aid to Climate Management[D]. Netherlands: Agricultural University of Wageningen, 1987.
[30] 闫浩芳,毋海梅,张川,等. 基于修正双作物系数模型估算温室黄瓜不同季节腾发量[J]. 农业工程学报,2018,34(15):117-125. Yan Haofang, Wu Haimei, Zhang Chuan, et al. Estimation of greenhouse cucumber evapotranspiration in different seasons based on modified dual crop coefficient model[J]. Transactions of the Chinese Society of Agricultural Engineering (Transactions of the CSAE), 2018, 34(15): 117-125. (in Chinese with English abstract)
[31] 张宝忠,许迪,刘钰,等. 多尺度蒸散发估测与时空尺度拓展方法研究进展[J]. 农业工程学报,2015,31(6):8-16. Zhang Baozhong, Xu Di, Liu Yu, et al. Review of multi-scale evapotranspiration estimation and spatio-temporal scale expansion[J]. Transactions of the Chinese Society of Agricultural Engineering (Transactions of the CSAE), 2015, 31(6):8-16. (in Chinese with English abstract)
Estimating cucumber plants transpiration by Penman-Monteith model in Venlo-type greenhouse
Yan Haofang1, Zhao Baoshan1, Zhang Chuan2, Huang Song1, Fu Hanwen1, Yu Jianjun1, Samuel Joe Acquah1
(1.,,212013,;2.,,212013,)
Accurate determination of crop transpiration in greenhouses is very important in making exact irrigation scheduling and climate control. The most common method for calculating crop transpiration is the Penman-Monteith (PM) model. In this study, we analyzed the estimating methods of cucumber transpiration by PM method in greenhouse of South China. We measured meteorological data, transpiration and plant growth indicators of cucumber during 2 planting seasons (autumn-winter season in 2017 and spring-summer in 2018) in a Venlo-type greenhouse in south China. The PM model was used to predict the transpiration based on the data averaged over 30-min intervals using different approaches in the calculation of aerodynamic resistance (Perrier logarithm approach and heat transfer coefficient approach). The results showed that transpiration of the cucumber plants was mainly affected by meteorological factors when there was sufficient water supply. The fluctuations of transpiration were consistent with solar radiation, air temperature and canopy temperature, and reached the maximum at noon, while relative humidity of air had the opposite trends. Canopy temperature of the cucumber plants were lower than the air temperature during daytime. The maximum differences between air temperature and canopy temperature were 4.4 ℃ (spring-summer season) and 2.0 ℃ (autumn-winter season) due to the evaporative cooling during high transpiration rates at noon time. By analyzing the response relationships between the stomatal resistance and the meteorological factors, a sub-model was constructed by using the effective leaf area index and stomatal resistanceto simulate the canopy resistance of the PM model. A significant exponential relationship between stomatal resistance and solar radiation was observed in the study (2= 0.89). The simulated canopy resistance determined by stomatal resistance and leaf area index remained constant during the night, with 533 and 574 s/m for spring-summer and autumn-winter season, respectively, and 96 and 112 s/m during the daytime when transpiration was high. The transpiration simulated by PM model were compared with the values measured by lysimeters. Results showed that the convection types of the greenhouse were conducted through mixed convection in about 80% and 94% of the study periods, respectively, for the spring-summer and autumn-winter seasons, while free and forced convection occurred at the rest periods at different times in the 2 planting seasons. In spring-summer season, free convection occurred in 5% of the study period during the day, forced convection occurred in 15% of the study period at night; In autumn-winter season, 2% of the study period was free convection, which all occurred during the day, 4% of the study period was forced convection, which occurred day and night. The variation ranges of aerodynamic resistance calculated by the Perrier logarithm approach and the heat transfer coefficient approach were small, and the average values was 388 and 383 s/m for the spring-summer and the autumn-winter season by the Perrier logarithm approach and 141 and 158 s/m for the spring-summer and the autumn-winter season by the heat transfer coefficient approach,respectively. The study showed that based on the PM model to simulate the cucumber transpiration had a good consistency with the measured values. However, the PM model underestimated transpirationwhen the Perrier logarithm approach was applied, the determination coefficients were 0.87 and 0.91 for spring-summer and autumn-winter seasons, respectively, and the PM model can accurately simulate the greenhouse cucumber transpiration using the heat transfer coefficient approach, the determination coefficients were 0.91 and 0.95, respectively, for spring-summer and autumn-winter seasons.
transpiration; heat transfer coefficients; aerodynamics; stomatal resistance; canopy resistance; convection type
2018-08-04
2019-03-10
国家自然科学基金(51609103、51509107);江苏省自然科学基金(BK20150509);中国农业科学院农田灌溉研究所/农业部作物需水与调控重点实验室开放基金(FIRI2019-03-0203)
闫浩芳,副研究员,主要从事农业节水灌溉与水分高效利用方面的研究。E-mail:yanhaofang@yahoo.com
10.11975/j.issn.1002-6819.2019.08.018
S161.4
A
1002-6819(2019)-08-0149-09
闫浩芳,赵宝山,张 川,黄 松,付翰文,鱼建军,Samuel Joe Acquah. Penman-Monteith模型模拟Venlo型温室黄瓜植株蒸腾[J]. 农业工程学报,2019,35(8):149-157. doi:10.11975/j.issn.1002-6819.2019.08.018 http://www.tcsae.org
Yan Haofang, Zhao Baoshan, Zhang Chuan, Huang Song, Fu Hanwen, Yu Jianjun, Samuel Joe Acquah. Estimating cucumber plants transpiration by Penman-Monteith model in Venlo-type greenhouse[J]. Transactions of the Chinese Society of Agricultural Engineering (Transactions of the CSAE), 2019, 35(8): 149-157. (in Chinese with English abstract) doi:10.11975/j.issn.1002-6819.2019.08.018 http://www.tcsae.org