Flash X-ray radiography technique to study the high velocity impact of soft projectile on E-glass/epoxy composite material
2019-05-24VenkataRamuduJayaramiReddyMadhu
B.Venkata Ramudu,C.Jayarami Reddy,V.Madhu
Armour Design and Development Division,Defence Metallurgical Research Laboratory,Kanchanbagh,Hyderabad,500058,India
Keyw ords:Flash X-ray radiography E-Glass/epoxy composite Ballistic impact Numerical simulation
A B S T R A C T In the present paper,the high velocity impact of 9 mm soft lead projectile on 10 mm and 30 mm thick Eglass/epoxy composites w as studied using a 450 k V Flash X-ray radiography(FXR)system.The basic parameters of FXRimaging,such as effect of ratio of target to f i lm(TF)and source to target(ST)distances and X-ray penetration thickness of the composite material w ere optimized based on clarity and the actual dimensions of the objects.The optimized parameters were used in the FXRimaging of the ballistic event of 9 mm soft projectile on E-glass/epoxy composite.The real time deformation patterns of both the projectile and composite target during the ballistic impact w ere captured and studied at different time intervals.The notable failure modes of the 10 mm thick target w ith time include f i bre breakage,bulging on the back side,delamination,recovery of the bulging,reverse bulging and its recovery.How ever,w ith increase in thickness of the target to 30 mm the only failure mechanism observed is the breaking of f i bres.The ballistic impact event w as also numerically simulated using commercially available LS-DYNA software.The numerically simulated deformation patterns of the projectile and target at different time intervals are closely matching w ith the corresponding radiographic images.
1.Introduction
Flash X-ray radiography(FXR)has become an important diagnostic technique in the f i eld of terminal ballistics and detonation research.In terminal ballistics,real time imaging of the penetration events of the projectile in the target is very essential to analyze the ballistic ef f i ciency of the target materials[1].During these events visible light based conventional optical diagnostic techniques like high speed photography,laser interferometry,schlieren photography etc are not useful for imaging the projectiles inside the target materials[2,3].FXR can be effectively used over the above optical techniques due to its advantages such as penetration ability through dust clouds and target materials.Penetration ability of Xrays depends on the energy of X-ray beam and density of the target material[4,5].
The FXR system has w idely been used in capturing the dw ell phenomena in ceramic materials under ballistic impact.K.Thoma et al.[6]studied the dw ell phenomena on B4Cbacked by Aluminum alloy under impact of 7.62 AP projectiles.They have used X-ray cinematography technique to capture the ballistic event at different time intervals.They also have numerically simulated the dw ell phenomena and compared w ith radiographic images.E.Strassburger et al.[7]studied the dw ell and erosion of the projectile in various SiCceramic materials against 7.62 mm APprojectiles using multi anode 450 k V f l ash X-ray tube.The FXRsystem is also being w idely used to study the jet characteristics of the shaped charge jet[8].SG Tatake and D K Karat[9]have used 450 k V FXRsystem to calculate various shaped charge jet characteristics like jet particle velocities,jet break-up time,quality factor for a liner,scaled breakup time and expected penetration.Clark[10]has used the FXR system to study the patterns of fragmentation and ejection of projectile from a gun in the internal ballistics.The FXRsystem has also been used to study the jet pattern of Argon gas released from a nozzle[11]at 1 bar pressure.The study involves using a FXRsystem in the voltage range of 10-35 k V.In all the above studies,FXRhas been used to the study the real time deformation of projectile and target w hile the projectile is outside the target material only.It is also a challenge to capture the real time deformations of the projectile inside the target at different intervals,due to the fact of optimization of various parameters such as X-ray penetration thickness in the materials,source to target and target to f i lm distances,clarity and actual size of images,damage to the f i lm cassettes and X-ray channels/sources,constraints in the accurate triggering mechanisms etc.Above all,no studies w ere carried out to study the real time deformation of the projectile and FRPcomposite target material at different time intervals w hile the projectile is moving inside the target material.
In the present study,a single channel FXR system w as used to study the real time deformation behaviour of 9 mm soft lead projectile w hile penetrating 10 mm and 30 mm thick composite target material.The real time response of the target material w as also studied.The ratio of the target to f i lm(TF)and source to target(ST)distances w as optimized to capture radiographic images of good clarity w ith actual dimensions of the lead objects.Studies w ere also carried out to optimize X-ray penetration thickness or maximum absorption thickness of E-glass/epoxy composite material.The optimized parameters w ere used in the dynamic experiments to capture the radiographic images at different time intervals.The rates of deformation of the projectile and the various deformation patterns of the target material have been studied.The ballistic impact w as also numerically simulated using LS-DYNA FEsoftw are and the results are compared w ith the experiments.
2.Experimental description and m aterials
2.1.Materials
E-glass f i bre reinforced epoxy composite was supplied from M/s.Peramali Wallace Pvt Ltd.,Bhopal,India.Each ply is plain w eave type w ith 0.25 mm thick.There are 40 plies in 10 mm thick and 120 plies in 30 mm thick composite target.The mechanical properties of the composite material w ere evaluated as per the ASTM standards and are show n in Table 1.A 9 mm×19 mm soft lead projectile w as used in all the experiments.10 mm thick E-glass/epoxy composite and the lead projectile are show n in Fig.1.
2.2.Static experiments
Experimental setup for static experiments is show n in the Fig.2(a).The setup includes a 450 k V Flash X-ray tube,target plate and f i lm cassette containing imaging plate.As show n in the Fig.2,the FXR tube and f i lm cassette are placed on either side of the target plate in the cross-sectional direction.After the exposure,the imaging plate is scanned through the CRNDT35 scanner to convert the latent image on the radiographic f i lm into a digitized image.These experiments w ere carried out to optimize various parameters such as TF to ST ratio and X-ray penetration thickness of the material.In these experiments lead symbols of different shapes w ere used for radiographic imaging.The length of lead symbols is measured using the D-tect softw are provided along w ith the FXR system.The technical characteristics of the FXR system supplied by M/s ScandiFlash AB,Sw eden,are tabulated at Table 2[12].
2.2.1.Optimization of TFto STratio
The E-glass/epoxy composite of 30 mm thickness w as clamped and used as target in these studies.The distance betw een the X-ray source and composite target is kept constant at 1500 mm.This distance was preferred based on the safety limits assessed for dynamic testing.The distance betw een the target and f i lm cassette w as varied from 150 mm to 650 mm.Diamond shaped lead symbol w as placed on the side of the composite target facing the X-ray tube.
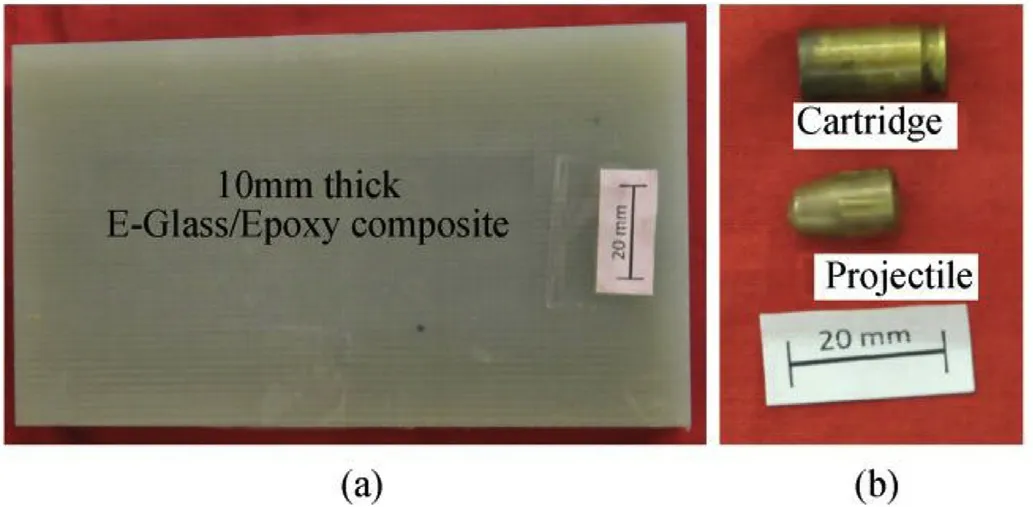
Fig.1.(A)E-glass/epoxy composite material of 150 mm×85 mm×10 mm(b)9 mm lead projectile w ith Jacket and Cartridge.
2.2.2.Optimization of X-ray penetration thickness
The experimental set up w as arranged by clamping the E-glass epoxy composite target of various w idths ranging from 85 mm to 105 mm using Cclamps as show n in Fig.2.The distance betw een the X-ray source to E-glass/epoxy composite target and target to f i lm w as maintained as 1500 mm and 250 mm respectively.The lead symbol“R”w as f i xed on the side of the composite target facing the X-ray tube.
2.3.Dynamic experiments
The schematic and experimental set up of the dynamic experiments is show n in Fig.2(b)and 2(c).The E-glass/epoxy target was clamped to target stand using C clamps.The dimensions of the target are 150 mm×85 mm×10 mm.The X-ray tube w as positioned in the thickness side of the target at 1500 mm distance.The f i lm cassette containing image plate w as f i xed at 250 mm distance on the other side of the target.The dynamic experiments on 10 mm and 30 mm thick E-glass/epoxy composites w ere carried out using 9 mm soft lead projectiles at velocity of 400±15 m/s.
During the experiments,f l ash X-ray tube w as triggered at different time intervals using the 500μm aluminum foil w hich w as stuck to the target.The foil w as connected to the trigger port of the control panel of the X-ray tube through an electrical cable.The trigger port of the control panel of FXR system generates a voltage of-11 V continuously in short circuit mode.When projectile hits the aluminum foil the cable short circuits and-11 V electrical signal is passed in the circuit.This signal is fed into a delay generator.The delay generator produces a signal suf f i cient to trigger the 450 k V f l ash X-ray system to deliver the X-ray f l ash,after the programmed time delay.The radiographic images of ballistic events w ere captured at different time intervals ranging from 2μs to 800μs after the impact of projectile on aluminum foil w hich w as stuck to the target.The contrast observed in the radiographic images is due to the different X-ray absorption of the projectile and target materials.The projectile length and extent of bulge in the target are measured using the D-tect softw are.The Dtect softw are is image processing softw are used to process the Xray images and is supplied by M/s Scandi f l ash AB,Sw eden alongw ith FXR system.An image of a length scale at the identical conditions is used as a reference to measure the length of projectile in the X-ray images.

Table 1Mechanical properties of E-glass/epoxy composite material.
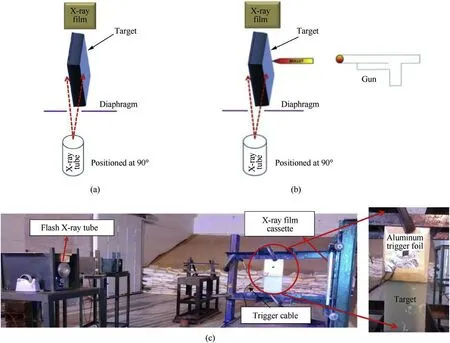
Fig.2.(A)Schematic of Flash X-ray radiography setup for static experiments(b)Schematic of Flash X-ray radiography setup for dynamic experiments(c)Experimental setup for Flash X-ray radiography setup for dynamic experiments.

Table 2Main characteristics of the f l ash X-ray source[12].
3.Finite elem ent m od el
The ballistic event was modelled using commercial f i nite element code LS-DYNA version R 971 and the numerical simulations w ere run in single precision mode.The f i bre reinforced composite material w as modelled w ith MAT_59/MAT_COMPOSITE_FAILURE_SOLID[13]material of LS-DYNA.The material model is capable of modelling the features of progressive damage of the f i bre reinforced composite materials[14-17].The material model is capable of predicting the eight failure modes of the composite materials.The failure modes are longitudinal tension and compression,transverse tension and compression,throughthickness tension and compression,through-thickness shear in normal and transverse directions.
The projectile lead core and copper jacket w ere modelled w ith MAT_15/MAT_JOHNSON_COOK[13,18].
All the materials w ere modelled w ith 8-node solid elements w ith constant stress formulation.The composite consists of plies of 150 mm×85 mm×0.25 mm thick each.The ballistic event w as modelled as quarter plane i.e.75 mm×42.5 mm×0.25 mm each ply as plane symmetry exists in the problem.Based on the mesh sensitivity studies w hich w ere performed at different element sizes the mesh size of 1.5 mm×1.5 mm×0.25 mm w as optimized and used to model the target.Total number of elements in 10 mm and 30 mm targets is 27700 and 77370,respectively.The composite target of E-glass/epoxy was modelled w ith solid-ortho elements and material properties are given in Table 3.To model the target as per experimental conditions,rigid boundary conditions w ere applied on top and bottom side of the target,and no boundary conditions w ere applied on the sides.The numerical model of the ballistic event is show n in Fig.3.The 9×19 mm projectile w ith lead core and copper jacket w as modelled using solid elements.The material properties of lead and copper[19]used in numerical simulations,are tabulated at Table 4.The projectile w as given an initial velocity of 400 m/s in impact direction.
Maximum strain failure criterion w as used for erosion of the elements in the composite material and Johnson-Cook damage model parameters are used for Lead and Copper.Contact occurring betw een the projectile and the composite plate w as modelled using ERODING_NODES_TO_SURFACE algorithm that allow s subsequent failure of elements in each layer.Contact betw een copper jacket and lead core w as modelled w ith AUTOMATIC_SURFACE_TO_SURFACE.Delamination mode of failure of the composite laminate w as mod elled in the numerical simulation using a CONTACT_AUTOMATIC_ONE WAY_SURFACE_TO_SURFACE_TIEBREAK algorithm[20]w hich is based on the interlaminar normal and shear strengths of the composite material.The contact algorithm is applied betw een the surfaces of the plies in contact.This contact algorithm is based on failure criterion having normal(σn)and shear(σS)stress components of layer interfaces.In LS-DYNA,this approach is re f l ected by contact tie-break option.
The damage evolution of the contact betw een plies is modelled w ith Benzeggagh-Kenane(B-K)damage model w hich is based on normal and shear modes energies per unit area[21].The model also considers the mixed mode failure of the interface of the composite laminate material.These cohesive damage model parameters for epoxy material have been used from Ref.[23]and ref.[24]and tabulated at Table 3.The images of projectile target interaction and rate of deformation of projectile and target have been compared w ith that of experimental results.

Table 3Material properties of E-glass/epoxy composite[20-22,24].
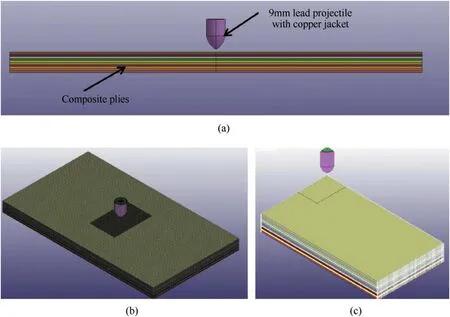
Fig.3.Finite element model of the ballistic impact of 9 mm lead projectile on 10 mm thick E-glass/epoxy composite target(a)front view of 10 mm thick target(b)isometric view of full model 10 mm thick target w ith meshing(c)isometric view of quarter symmetry model w ith boundary conditions.

Table 4Material properties of lead core and copper jacket[19].
4.Results and discussion
4.1.Optimization of TFto ST ratio
in view the f i lm and X-ray tube distances from the target,size and clarity of the object in the images,TF to ST ratio of 0.17 is used in ballistic experiments.From Fig.5,the increment in the height of the lead symbol is linearly increasing w ith TF to ST ratio.The curve is a straight line and its slope is equal to unity.The slope of the straight line can be w ritten as follow ing
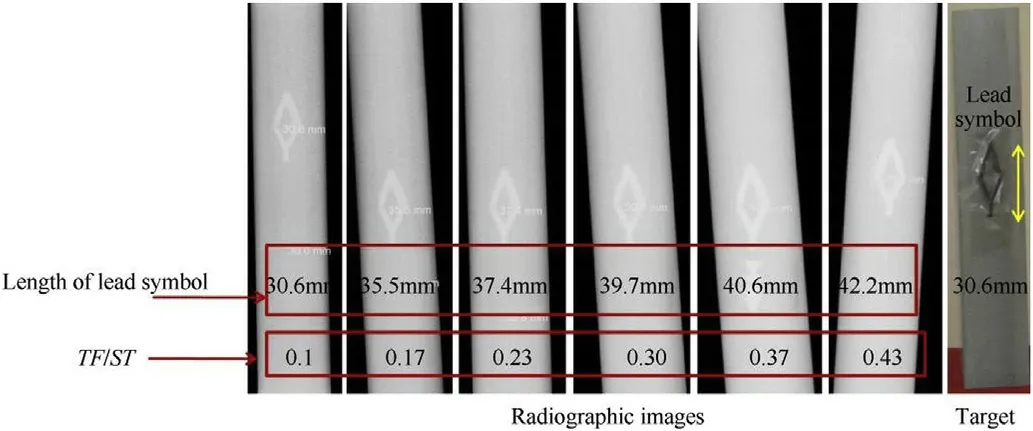
Fig.4.Radiographic images at various TF to ST ratios.
From Fig.4,at TF to ST ratio of 0.1 the length of lead symbol in the image is 30.6 mm w hich is close to the actual length of the lead symbol.But as the TF to ST ratio increases from 0.1 to 0.43,the length of the lead symbol also increases in the same ratio w hich is due to the divergence of the X-ray beam.It is also observed from the Figure that the clarity of the lead symbol reduces w ith increase in TF to ST ratio w hich may be due to the attenuation of X-rays.Keeping
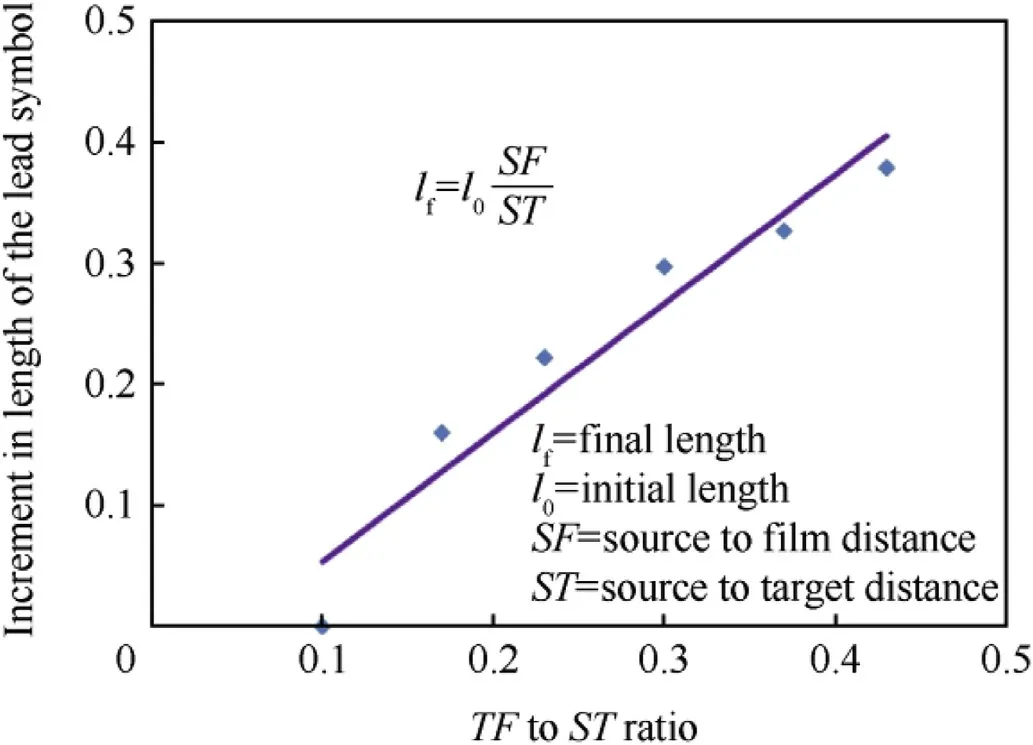
Fig.5.A graph show ing variation of length increment w ith TF to ST ratio.

Here lf,l0are f i nal and initial lengths of the object respectively.From the above equation,the f i nal length(lf)of object can be w ritten as follow ing

w here SF is source to f i lm distance.
From this,it is concluded that the length of the objects in the radiographic images increases as the ratio of source to f i lm to source to target distance increases.
4.2.Optimization of X-ray penetration thickness
The understanding of X-ray penetration thickness is very essential to capture the clarity images of the projectile in the target.From Fig.6,it is observed that at 85 mm X-ray penetration thickness,the X-ray image of the lead‘R’is very clear.But as the thickness increases from 85 mm to 105 mm,the clarity reduced.The reduction in the clarity of the lead symbol in the images is due to the attenuation of X-rays w ith increase in thickness of specimen.Based on the maximum size requirements and the clarity of the images for ballistic events,specimens of 85 mm X-ray penetration thickness w ere used for further studies.
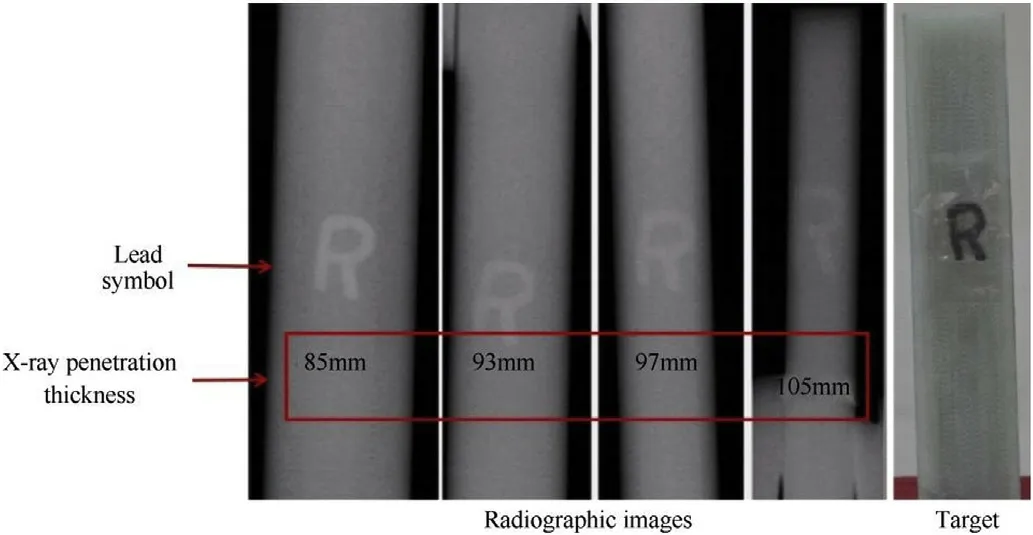
Fig.6.Radiographic images of different X-ray penetration thicknesses.
4.3.Response of 10 mm thick target and projectile deformation
4.3.1.Experimental
The f l ash X-ray radiographs of the ballistic events at different time intervals betw een 2μs to 60μs are show n in Fig.7.From the Fig.7,at 2.8μs f l ash time the projectile started interacting w ith the target and the deformation of the projectile w as initiated on the cone portion of the projectile.How ever,it is observed that the interaction w as only on the surface of the target.The initiation of the deformation is due to the resistance offered by the target to the soft projectile.At this f l ash time f i bre breakage was observed in the target and the length of the projectile w asreduced to 14.5 mm from 15 mm.At 5.8μs f l ash time the projectile penetrated the target of approximately one mm length by breaking the f i bres.And it is also observed that cone portion was deformed by f l attening into thin sheet and merged into the target.How ever,the f l attened projectile cone portion is not separated from the remaining projectile.The projectile length from the f l attened end to the projectile back side was found to be 12.0 mm.At 10.8μs,the projectile penetrated into the target and got deformed and approximately one mm of the cone portion is remaining outside the target.An expansion or buckling of the circumference at the cone portion is also observed due to the compression of cone on interaction w ith the target.The projectile length w as found to be 9.8 mm.At 20.8μs,the cone portion of the projectile was completely penetrated into the target and got deformed into a f l attened mass.At this f l ash time,initiation of the mushrooming of the deformed projectile in lateral direction was also observed.This is due to the less penetration ability of the blunted projectile due to its low er velocity.The overall projectile length w as observed to be 8.5 mm.The projectile pierced almost 2 mm of the target by breaking the f i bers.The initiation of bulging at the back side of the target w as also observed at this f l ash time.This may be due to the insertion of the deformed projectile and corresponding transverse stress propagation to the back side of the target[25,26].Except,f i bre breakage and minor bulging on the back side no other failure mode of the target plate w as observed.At 40.8 μs the projectile w as penetrated almost completely into the target and got deformed.It is also observed that the projectile w as deformed as f l attened mass of 6.7 mm thickness and positioned near the impact(front)side of the target.1 mm of the copper jacket w as remained outside the target.Avery small dark line in the target at the edges of the deformed projectile w asobserved.Thisindicates very small radial gap betw een the adjacent layers in the target.This is due to the stresses induced radially by the deformed projectile.The bulge on the back side of the target w as also increased w hen compared to bulge at 20.8μs f l ash time indicating the movement of the projectile both in deformed and undeformed shapes inside the target thereby transferring the transverse stress to the back side of the target.The f i bre breakage at the front side and bulging at the backside are the tw o modes of failure observed in the target up to this f l ash time.

Fig.7.Radiographic images of 9 mm lead projectile at different time intervals on impact of 10 mm thick E-glass/epoxy composite target.
From the Fig.8,at 60.75μs f l ash time,the deformed projectile w ith its residual velocity slightly moved tow ards the back side of the plate by pushing the layers leading to the increased bulging of 3.4 mm on the back side of the target.During this movement,the deformed projectile mass encountered the back layers of the target material and got further compressed and stretched radially.The length of the radial gap betw een the adjacent layers observed in the target also increases w ith increase in time.As the time increases to 80.8μs,the bulging on the back side of the plate increased to 4.5 mm w hich is 1.1 mm higher w hen compared to the radiographic image at 60.75μs Number of radial gaps at the edges of the projectile are observed to increase w ith increase in f l ash time to 80.8μs The stretching of the deformed projectile also further increased at 80.8μs The movement of the deformed projectile tow ards the back side is also observed in the radiograph.At 100.8μs,the bulge on the back side of the target plate was increased to 5.5 mm w hich is due to the movement of deformed projectile tow ards the back side of the plate.Due to resistance of back layers,the deformed projectile mass was further stretched radially leading to the increase in the lengths of radial gaps at the edges of the projectile.Delamination at the farthest layers on the back side is also observed w hich is indicated as dark gaps in the radiographic image.Normally delamination occurs due to the re f l ection of compressive w ave at air interface on the back side of the target as tensile w ave and releases the compressive stress effect and meets the incoming compression w ave w here the combined stress w ill supersedes the tensile strength of the materials.This tensile w ave further travels tow ards the impact side and pushed the deformed projectile tow ards the front side initiating minor reverse bulging on the front side.As the f l ash time increased to 150.8μs,the bulge on the back side of the target was reduced to 3.5 mm w hich is due to recovery of the back layers and increased stress distribution at the back side.During the relaxation or elastic recovery of the back layers the deformed projectile further got compressed and stretched radially.The stress generated by the stretched deformed projectile further increases the length of the radial gaps at the edges.The stress also initiated the delamination on the front side of the target.Reverse bulging initiated at 100.8μs w as increased at 150.8μs The reverse bulge of 3.6 mm w as observed at this f l ash time.The breakage initiation of deformed projectile w hich is indicated as dark spot is also observed in the radiograph.The delamination at the farthest layers on the back side of the target also increased w ith increase in f l ash time.How ever at 200.8μs,the bulging and delamination on the back side got reduced due to increased recovery of back layers.The bulge at the back side is 2.4 mm.Reverse bulging of 6.8 mm and increased delamination w as observed at the front side.During this process the deformed projectile also broken into fragments.With increase in the interaction time of 300.75μs,the bulging on the back side of the target w as reduced signi f i cantly leaving a bulge of 1.2 mm.At thistime the back side bulging appears to be lessthan the front side reverse bulging due to the phase lag in the recovery of the back side layers and reverse bulging of front layers.The reverse bulging also got reduced to 4.1 mm due to the recovery of front layers and fragmentation of projectile.
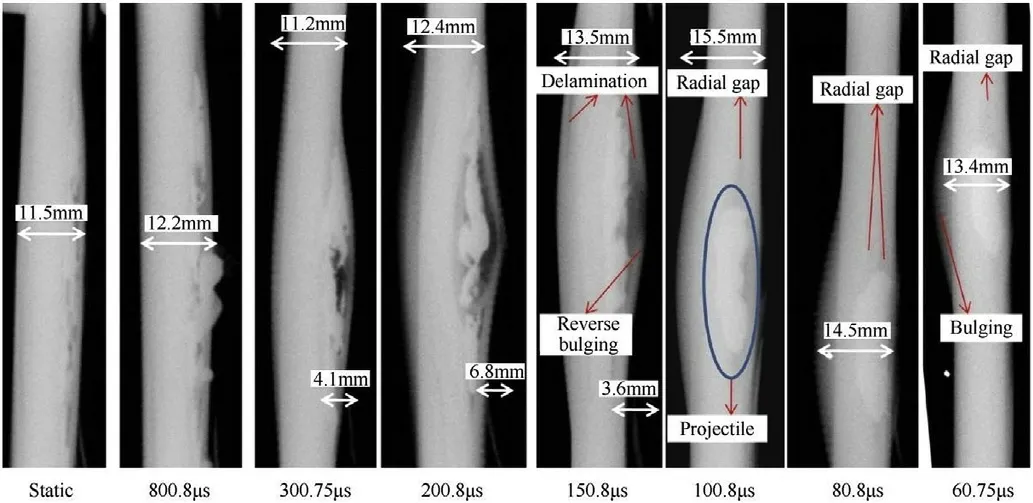
Fig.8.Radiographic images of bulging behaviour of 10 mm thick E-glass/epoxy on impact of 9 mm lead projectile at different time intervals.
The radiograph captured at 800.8μs indicates that the bulge on the back side of the target w as fully recovered and reached its normal position.The delaminated layers on the back side of the target also got united due to the recovery of the layers.Due to this recovery of layers,the fragmentation of the deformed projectile w as increased.As the size and shape of the fragments of the projectile decreased,the delamination at front side due to the insertion of the deformed projectile got reduced.The reduction in reverse bulging and delamination are observed w hich can be attributed to the recovery of the front side layers to their normal position in the absence of the movement of the fragmented projectile.The reverse bulging on the front side is 2.2 mm at this f l ash time.How ever,the radiographic image of the post test sample show n as static in the Figure indicates that the recovery of the front side of the target continued beyond 800μs and leaving a bulge of less than 1 mm on the front side and less than 0.5 mm on the back side.The delamination is also observed at the location of the fragmented projectile.
4.3.2.Numerical
From the Fig.9,in numerical simulation it is observed that the projectile interaction w ith target started at 2μs time and the projectile length is found to be 14.5 mm.As the time increases to 5μs deformation of cone portion of the projectile w as initiated and penetrated into the target by shear cutting the f i bres.The length of the deformed projectile is found to be 12.2 mm.At 10μs the projectile penetrated the target,during the penetration the cone portion of the projectile w asfurther deformed w ith some portion of projectile remaining outside the target.The overall length of the projectile including the deformed portion inside the target is found to be 10.2 mm.The cone portion deformed to form a f l attened shape.Except f i bre breakage at the impact site no additional damage mechanisms w ere observed.The projectile nose portion w as completely f l attened and penetrated in the target at 20μstime.The overall length of the projectile is found to be 8.6 mm.The stress w ave propagation to the back side of the target is also observed initiating a very minor bulging.The projectile w as fully penetrated at 40μsand got f l attened.The projectile length w as5.5 mm.Asmall gap as dark radial lines is also observed in the target at the edges of the projectile w hich may be due to the insertion of the projectile causing radial stresses betw een the adjacent layers.The bulge on the back side also increases slightly at 40μs and found to be less than 0.5 mm.
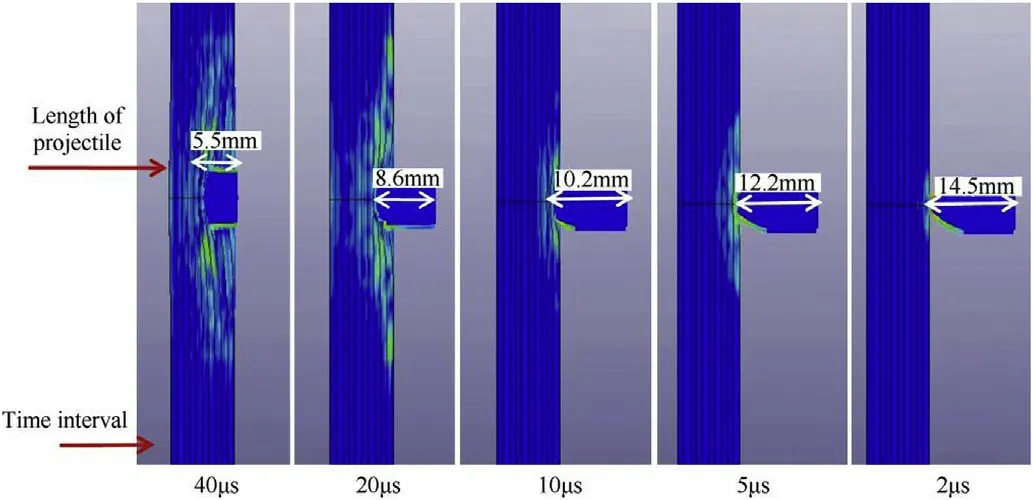
Fig.9.Numerical Simulation show ing the behaviour of 9 mm lead projectile w hen impacts a 10 mm thick E-glass/epoxy composite target.
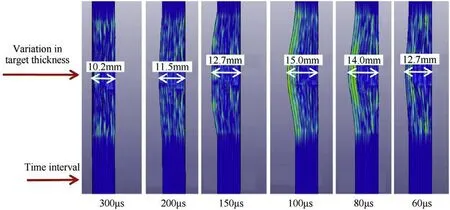
Fig.10.Numerical simulation show ing the behaviour of 10 mm thick E-glass/epoxy composite target on impact of 9 mm lead projectile.
As show n in Fig.10,from numerical simulations at 60μs the deformed projectile further penetrated inside the target increasing the bulge at the back side.The bulge on the back side was found to be 2.7 mm.The number of radial gaps at the edges of the projectile and their lengths also increased at this time.As the time increases to 80μs,the bulging on the back side of the plate increased to 4.0 mm w hich is 1.3 mm higher compared to the bulge at 60μs Then the bulging increased to 5 mm up to 100μs Bulge on the back side w as found to be 2.7 mm,1.5 mm and 0.2 mm at 150μs,200μs and 300μs,respectively.The reduction in the back side bulge is due to the elastic recovery of the strained f i bres.The deformation of the projectile above 60μs was not captured as the elements w ere eroded due to the erosion criterion of J-CModel.
4.3.3.Rate of deformation of the projectile
The length of the projectile at different time intervals during the penetration of 10 mm thick composite target determined by FXR images was compared w ith numerical simulations and is show n in Fig.11.From the Fig.11,it is observed that the rate of deformation of projectile has tw o types of patterns.The experimental deformation rate up to 10μs was found to be about 572±104 m/s and beyond 10 μs it w as observed to be 101±9 m/s.The numerically simulated deformation rate up to 10μs w as found to be 443±129 m/s and beyond 10μs it was observed to be 173±10 m/s.Initially,the deformation rate of the projectile w as very high,due to the resistance offered by the target on the small tip of the soft projectile leading to the blunting of the bullet.Asthe projectile penetratesthe target,the area of the projectile facing the target increases,w hich is due to initial bluntness of the tip and cone shape of the projectile.This leads to more stress distribution and contributes to the decrease in deformation rate.The deformation rate up to 10μs w as found to be more rapid and the variation in deformation rate is high,due to the cone portion of the projectile and high velocity change of the projectile during the interaction of the target.Above 10μs the cone shape of the projectile was completely f l attened/blunted and the area of the projectile facing the target also increased and w hich remained almost same up to 40μs Therefore the deformation rate of the projectile beyond 10μs w as found to be less.
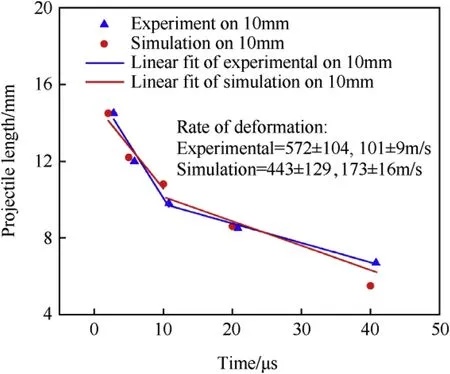
Fig.11.A Graph show ing comparison of the experimental and simulation results of projectile length at different time intervals w hile penetrating 10 mm thick E-glass/epoxy composite target.
4.3.4.Rate of deformation of the target
The rate of deformation of the target in terms of length of the bulge on the back side is compared w ith simulation and show n in Fig.12.From the Fig.12,the rate of formation of bulge in experiments and numerical simulations is 52±1 m/s and 45±11 m/s,respectively.The recovery rate of the bulge in both experiments and numerical simulations is 20±4.4 m/s and 20±3 m/s,respectively.The bulging rate at the back side is higher compare to the recovery rate,due to the propagation of strong compression w ave to the back side.The recovery rate of the back side bulge is decreasing w ith time up to 300μs The less recovery rates are attributed to the inertia of the strained f i bres as w ell as the resistance offered by the deformed projectile mass w hich is located betw een the layers of the target.The experimental and numerically simulated rates of formation and the rates of recovery of the bulge are closely matching.The small variations are due to the experimental uncertainties like minor change in velocity,impact location,variation in target thickness and properties etc.
4.3.5.Post ballistic impact analysis of target
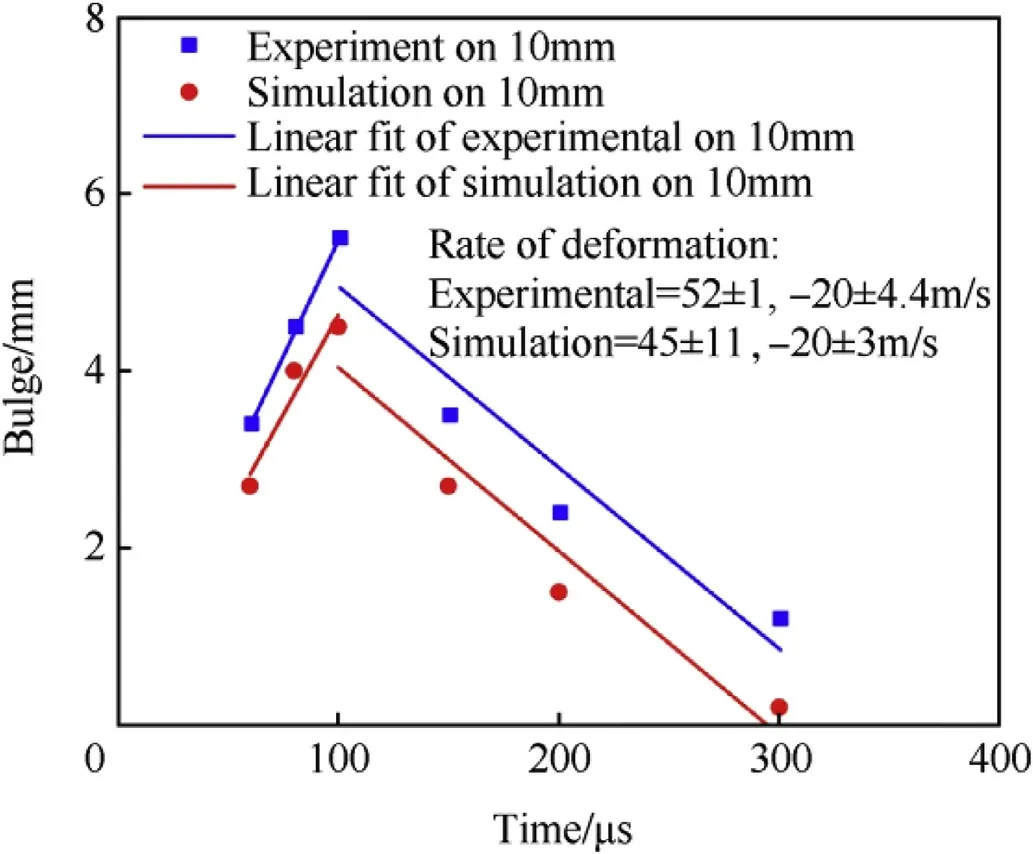
Fig.12.A graph showing comparison of the experimental and simulation results of bulging at different time intervals of 10 mm thick E-glass/epoxy composite target on impact of 9 mm lead projectile.
The experimental and simulate damage patterns of the target after ballistic test are show n in Fig.s 13 and 14,respectively.From the Figs.13(a),(b),14(a),(b),the damage area on the front and back side of target is closely matching w ith the simulated effective strain pro f i les of the target.As show n in Fig.s 13(c)and 14(c),the experimental and simulated f i nal bulge of the target is 1.5 mm and 2.5 mm,respectively.The delamination of the target w as observed both in experiments and simulations at 2 mm and 4 mm from the impact side of the target.
4.4.Response of 30 mm thick target and projectile deformation
4.4.1.Experimental
The f l ash X-ray radiographs of real time deformation of projectile at different intervals are show n in Fig.15.As show n in Fig.15,at 1.8μs f l ash time,the projectile just before the target.Therefore no deformation of the projectile and the target w ere observed.At 6.8μs the projectile interacted w ith the target and the cone portion of the projectile w as deformed by f l attening.How ever,it is observed that the interaction w as only on the surface of the target.The initiation of the deformation is due to the resistance offered by the target to the soft projectile.Fibre breakage at the surface plies of the target w as observed.The projectile length from the f l attened end to the projectile back side w as found to be 13.3 mm.As the f l ash time increased to 12.75μs,the cone portion of the projectile w as further deformed into f l attened thin sheet at the surface of the target.A small portion of the cone portion was still not deformed and visible outside the target.The penetration depth of the projectile in the target appears to be similar to the 6.8μs radiograph,this may be due to the increased resistance of the target caused by the increase in thickness of the sample.The length of the deformed projectile is found to be 11.8 mm.The only failure mechanism observed at this f l ash time w as the breakage of f i bres on the surface of the target.The f l ash radiograph at 20.75μs show s the complete deformation of the cone portion and the mushrooming of the projectile inside the target.The projectile penetrated approximately 1 mm inside the target.The length of the projectile was found to be 9.2 mm.Except f i bre breakage at the impact site no other failure patterns of the target w as observed.From the Figure,the projectile w as observed to be deformed by 35.8μs f l ash time and further expands into f l attened thin sheet as the f l ash time increases to 40.75μs The length of the deformed projectile was found to be 7.1 mm at 35.8μs and 5.5 mm and 40.75μsrespectively.Asthe penetration is limited to only surface of the target,the projectile is either falling dow n or just remained in the surface of the target at time scales beyond 35.8μs Therefore no experiments w ere conducted to capture the ballistic events beyond 40.75μs Post test sample exhibiting failure pattern observed in the radiograph at 35.8 and 40.75μs is show n in Fig.12.
4.4.2.Numerical
From the Fig.16,in numerical simulations at 2.2μs the 15 mm projectile has not reached the target and therefore no deformation of both projectile and target w as observed.The projectile at 6.67μs impacts the target and penetrated into the target but no deformation w as observed on the target as the projectile interaction was on the surface of the target.During the penetration the projectile cone portion got deformed and f l attened due to the resistance offered by the target.Fibre breakage at the surface plies of the target w as observed.The projectile length w as found to be 13.6 mm.As the time increased to 12.2μs,the cone portion of the projectile w as further deformed and got f l attened.The projectile length w as found to be 11.8 mm.The cone portion w as completely deformed at 20μs and the projectile length w as 9.4 mm.The projectile penetrated approximately 5 mm inside the target.At 35μs,the projectile w as completely deformed and positioned at the surface of the target.The penetration depth of the target w as found to be 5 mm near the front of the surface at 41.1μs no bulge and delamination are observed in the simulation.The projectile deformation patterns and target failure are matching w ith the experimental results.
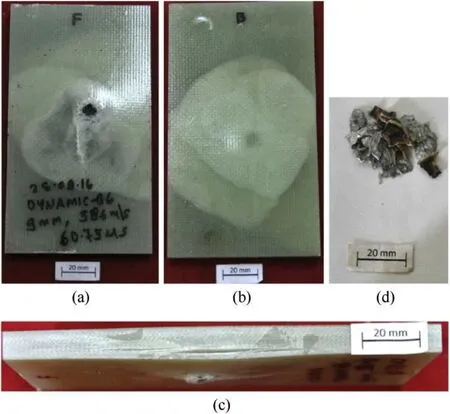
Fig.13.Post test specimen of the 10 mm thick target material(a)front side view(b)back side view(c)thickness view(d)deformed projectile.
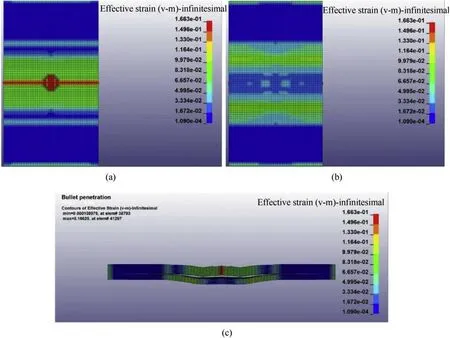
Fig.14.The 10 mm thick target material showing effective strain after 300μs of impact.
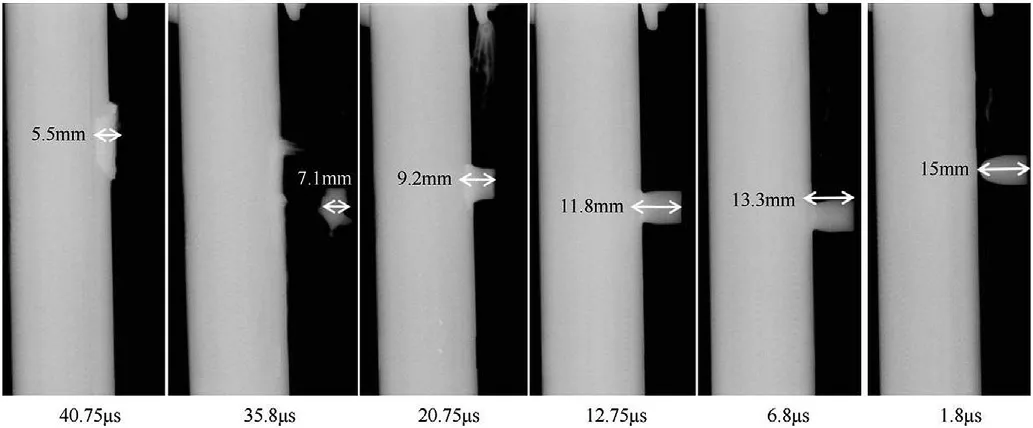
Fig.15.Radiographic images showing the behaviour of 9 mm lead projectile w hen impacts on 30 mm thick E-glass/epoxy composite target.
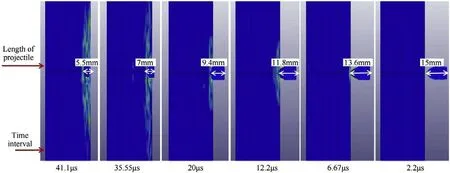
Fig.16.Numerical simulation showing the behaviour of 9 mm lead projectile w hen impacts a 30 mm thick E-glass/epoxy composite target.
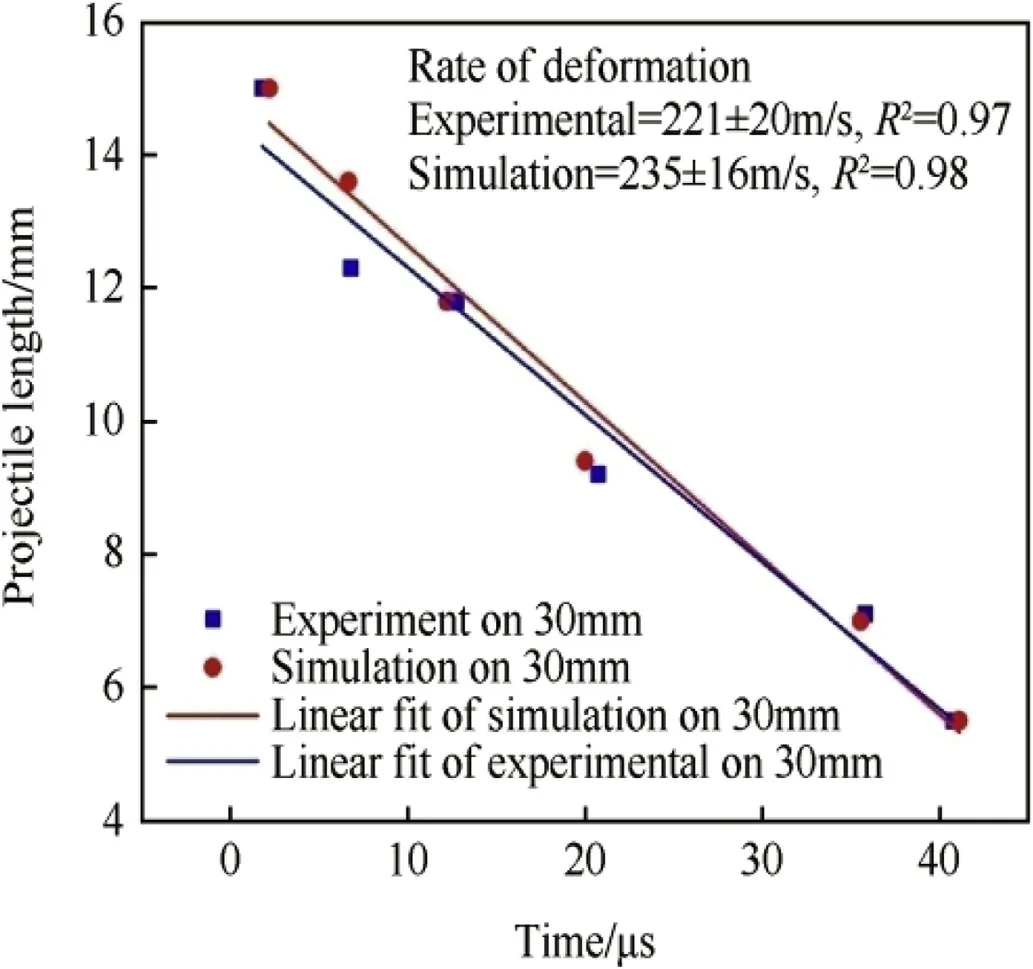
Fig.17.A graph show ing comparison of the experimental and simulation results of projectile length at different time intervals while penetrating 30 mm thick E-glass/epoxy composite target.
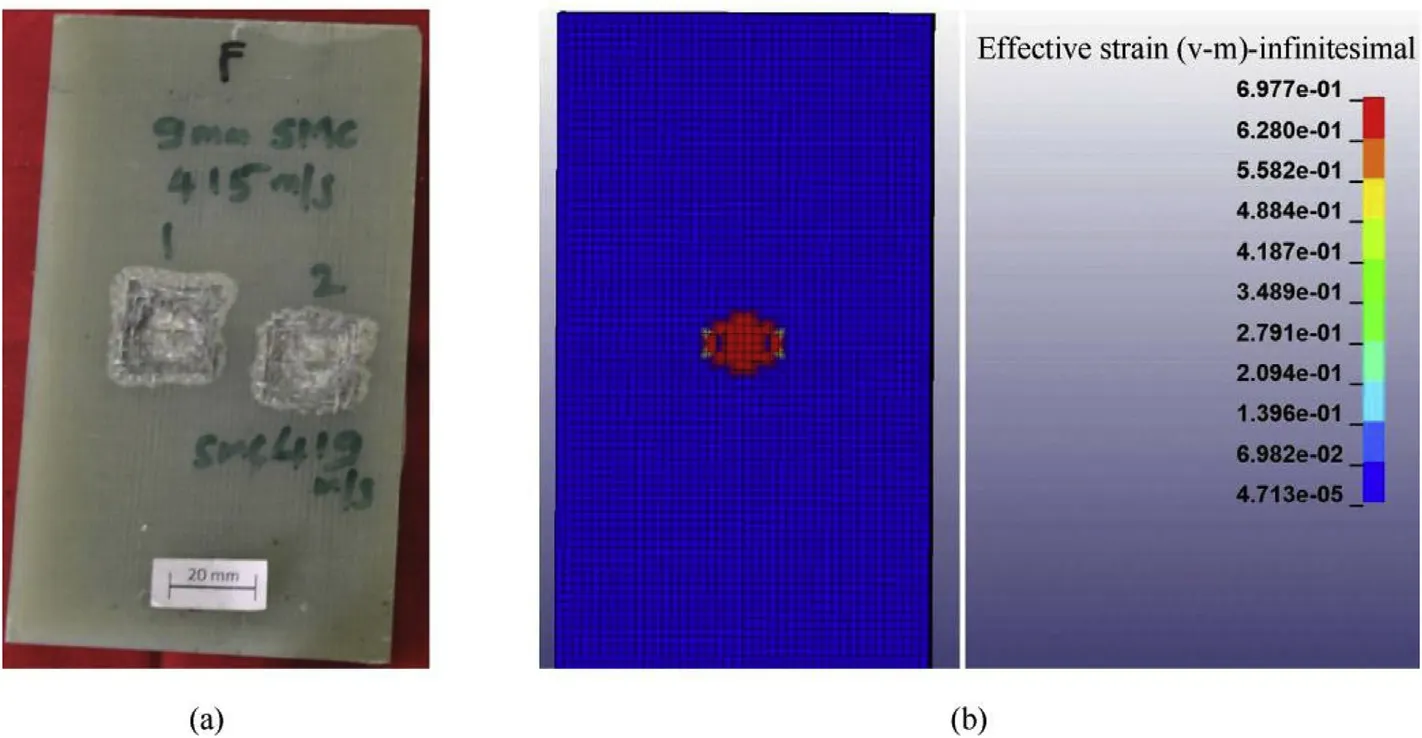
Fig.18.Post test specimen of the 30 mm thick E-glass/epoxy composite target material.
4.4.3.Rate of deformation of the projectile
The length of the projectile at different time intervals during the penetration of 30 mm thick composite target w as compared w ith numerical simulations and is show n in Fig.17.As show n in Fig.17,the rate of deformation of the projectile in experiments and simulations is 221±20 m/s and 235±16 m/s,respectively.This is due to the constant resistance offered by the thicker target at all intervals of the projectile penetration.
4.4.4.Post ballistic impact analysis of target
The experimental and simulate damage patterns of the target after ballistic test are show n in Fig.18.From Fig.18(a)and(b),the damage area on the front and back side of target is closely matching w ith the simulated effective strain pro f i les of the target.The size and shape of damage at impact point is very similar in both the cases.The shape of the damage at impact point from simulations is a rectangular in shape w ith sides of 18.7 mm×14.3 mm,w hereas experimentally the damage is almost a square of size of 20-21 mm each side.This is due to the f l attening of the projectile at the front surface of the target.From this,the variation from numerical to experimental is 12-15%.No damage w as observed the back side of the target.Delamination was also not observed in the target.
5.Conclusions
A 450 k V Flash X-ray radiography system w as used to study the dynamic deformation behaviour of 9 mm soft lead projectile and Eglass/epoxy composite target at different time intervals.Follow ing conclusions w ere draw n from this study.
1.The optimum X-ray penetration thickness of E-glass/epoxy composites is 85 mm and TF to ST ratio is 0.1 to capture radiographic images of good clarity.The size of the object in the radiographic image increases proportional to TF to ST ratio.
2.The deformation patterns of 9 mm soft lead projectile on impacting 10 mm and 30 mm thick target are the cone deformation,f l attening of the cone,circumferential expansion around the cone,mushrooming of the projectile inside the target and fragmentation of the projectile.
3.The target deformations include f i bre breakage,bulging,delamination and recovery of bulging on the back side of the target,delamination,reverse bulging and its recovery at the front side of the target.
4.The ballistic impact of 9 mm lead projectile on 10 mm and 30 mm thick E-glass/epoxy composite material w as numerically simulated and the images at different time intervals of the simulation are compared w ith the corresponding radiographic images.The results from simulations are very close to the experimental results.
5.The simulated deformation rate of the projectile and target are closely matching w ith the experimental results.
Acknow ledgements
Authors w ould like to thank Director,DMRL for giving permission to publish the w ork.Authors w ould also like to thank G.Seshagiri Rao,K.Gopinadha Reddy,Rajesh Kumar and Sunil Kumar for carrying out ballistic tests.Suggestions of Dr.B.Ramakrishna in performing numerical simulations are also acknowledged.
杂志排行
Defence Technology的其它文章
- Comparison of burn rate and thermal decomposition of APas oxidizer and PVCand HTPB as fuel binder based composite solid propellants
- Novel colored f l ames via chromaticity of essential colors Ramy Sadek,Mohamed Kassem,Mohamed Abdo,Ahmed Fahd,Hesham Tantaw y,Amir Elsaidy,Sherif Elbasuney*
- Estimation of projected surface area of irregularly shaped fragments Elvedin Kljuno*,Alan Catovic
- Experimental study of bullet-proo f i ng capabilities of Kevlar,of different w eights and number of layers,w ith 9 mm projectiles
- Parametric study of single con f i ned fragment launch explosive device
- Optimization of gas tungsten arc w elding parameters for the dissimilar welding between AISI 304 and AISI 201 stainless steels
