Content Determination of Trace Elements in Several Vegetables by Atomic Absorption Spectrophotometry
2019-04-25,
,
College of Life Science, Cangzhou Normal University, Cangzhou 061001, China
Abstract The contents of Mn, Zn and Cu, three essential trace elements for human body, in Laminaria japonica, Auricularia auricula (L.ex Hook.) Underwood, Porphyra, Cucurbita pepo L., Spinacia oleracea L. and Coriandrum sativum were determined by atomic absorption spectrophotometry. Vegetable samples were processed by wet digestion. The results showed that among the six vegetables, Mn had the highest content in A. auricula (26.60 μg/g) and the lowest content in C. pepo (1.22 μg/g); Zn had the highest content in Porphyra (38.07 μg/g) and the lowest content in L. japonica (10.32 μg/g); and Cu had the highest content in Porphyra (10.35 μg/g) and the lowest content in S. oleracea (0.61 μg/g). Each determination was repeated five times. The value of RSD was less than 10%, indicating high accuracy.
Key words Atomic absorption spectrophotometry, Vegetable, Mn, Zn, Cu
1 Introduction
Vegetables are indispensable foods in life and contain many different trace elements[1]. Trace elements are closely related to human health, intelligence, beauty,etc. They play a key role in regulating the life process[2]. With the development of modern industry and the improvement of people’s living standards, the content of elements in vegetables is getting more and more attention. Flame atomic absorption spectrophotometry has the advantages of quickness, high sensitivity, high accuracy, good selectivity, less interference and easy operation. It is widely used in the determination of trace elements in different samples[3]. The domestic TAS-990 atomic absorption spectrophotometer is easy to operate, and its test accuracy and sensitivity can meet the requirements of chemical analysis[4]. In this paper, the content of trace elements in six common vegetables was determined by flame atomic absorption spectrophotometry and graphite furnace atomic absorption spectrophotometry.
2 Materials and methods
2.1MaterialsFresh samples ofCucurbitapepoL.,CoriandrumsativumandSpinaciaoleraceaL. and dry samples ofLaminariajaponica,PorphyraandAuriculariaauricula(L.ex Hook.) Underwood were collected as test materials.
2.2InstrumentsandequipmentTAS-990 atomic absorption spectrophotometer (Beijing Purkinje General Instrument Co., Ltd.); KDN-06 intelligent digital digestion furnace (Shanghai Xinjia Electronic Co., Ltd.); hollow cathode lamps of Mn, Zn and Cu elements; electronic balance.
2.3InstrumentworkingconditionsThe content of Mn and Zn were determined by flame atomic absorption spectrophotometry(FAAS), and the content of Cu was determined by graphite furnace atomic absorption spectrophotometry(GFAAS). The instrument working conditions are shown in Table 1.
2.4SampletreatmentFreshC.pepo,C.sativumandS.oleraceawere cleaned with tap water, rinsed with deionized water, and dried naturally. The edible portion of each of the vegetables was cut with knife and scissors and ground into slurry with a mortar. A certain amount (1 g) of the slurry of each vegetable was placed in a conical flask, added with 30 mL of mixed acid (concentrated nitric acid∶perchloric acid=4∶1), sealed and stood for 12 h[5].L.japonica,PorphyraandA.auriculawere cut off with a knife and ground into powder separately. A certain amount (1 g) of the powder of each vegetable was poured into a conical flask, added with 30 mL of mixed acid (concentrated nitric acid∶perchloric acid=4∶1), sealed and stood for 12 h. Then, each sample was poured into a digestive tract. The conical flask was washed with a small amount of deionized water which was poured into the digestive tract too. Heating and digestion was performed under the voltage of 220 V in an intelligent digital digestion furnace. When a large amount of brown gas was generated, the voltage was adjusted to about 100 V, and the micro-boiling state was maintained until the brown gas disappeared, white smoke was generated, and the solution became clear. After cooling, the solution in each digestive tract was transferred to a 50-mL volumetric flask. Each of the digestive tracts was washed several times with a small amount of deionized water, and the washing solution was poured into corresponding 50-mL volumetric flask. The solution in each volumetric flask was diluted to 50 mL with deionized water and mixed for use[6].
3 Results and analysis
3.1StandardcurvesDifferent volumes of Mn, Zn and Cu stock solutions were diluted with 1% nitric acid solution to 50 mL, respectively. Thus, the standard solutions of Mn, Zn and Cu with different concentrations were prepared (Table 2).
Table1Workingconditionsofinstruments

Trace elementLamp currentmAWavelengthnmSpectral bandwidthnmBurning heightmmAcetylene flowmL/minHeating procedure∥℃DryingAshingAtomizationClearanceMn(FAAS)2.0279.50.26.01 700Zn(FAAS)2.0213.90.46.01 000Cu(GFAAS)2.0324.70.41206002 0002 100
The content of Mn, Zn and Cu in the standard solutions was determined under the set working conditions. The standard curve equation wasy=bx+a. The concentration of trace elements in the samples to be tested was calculated as follows:x=(y-a)/b. In the formula,xrepresents mass concentration of trace elements,yrepresents spectral intensity or absorbance,ais the intercept of standard curve, andbis the slope of the standard curve. The linear regression equation of the concentration of each element against its absorbance is shown in Table 3.
The linear equation of Mn wasy=0.349 5x+0.015 5 (R2=0.999 46), the linear equation of Zn wasy=0.489 3x+0.015 2 (R2=0.999 12), and the linear equation of Cu wasy=1.269 3x+0.029 7 (R2=0.998 86). It was indicated that the Mn, Zn and Cu standard solutions had a good linear relationship between concentration and absorbance for both the determination methods of flame atomic absorption spectrophotometry and graphite furnace atomic absorption spectrophotometry.
Table2Contentoftraceelementsinstandardsolutionsμg/g

TraceelementStandardsolution 1Standardsolution 2Standardsolution 3Standardsolution 4Mn0.250.501.002.00Zn0.100.200.400.60Cu0.010.030.050.10
Table3Linearregressionequationsandcorrelationcoefficients

Trace elementLinear equationCorrelation coefficientMny=0.349 5x+0.015 00.999 46Zny=0.489 3x+0.015 20.999 12Cuy=1.269 3x+0.029 70.998 86
3.2 Content of different trace elements in six vegetables
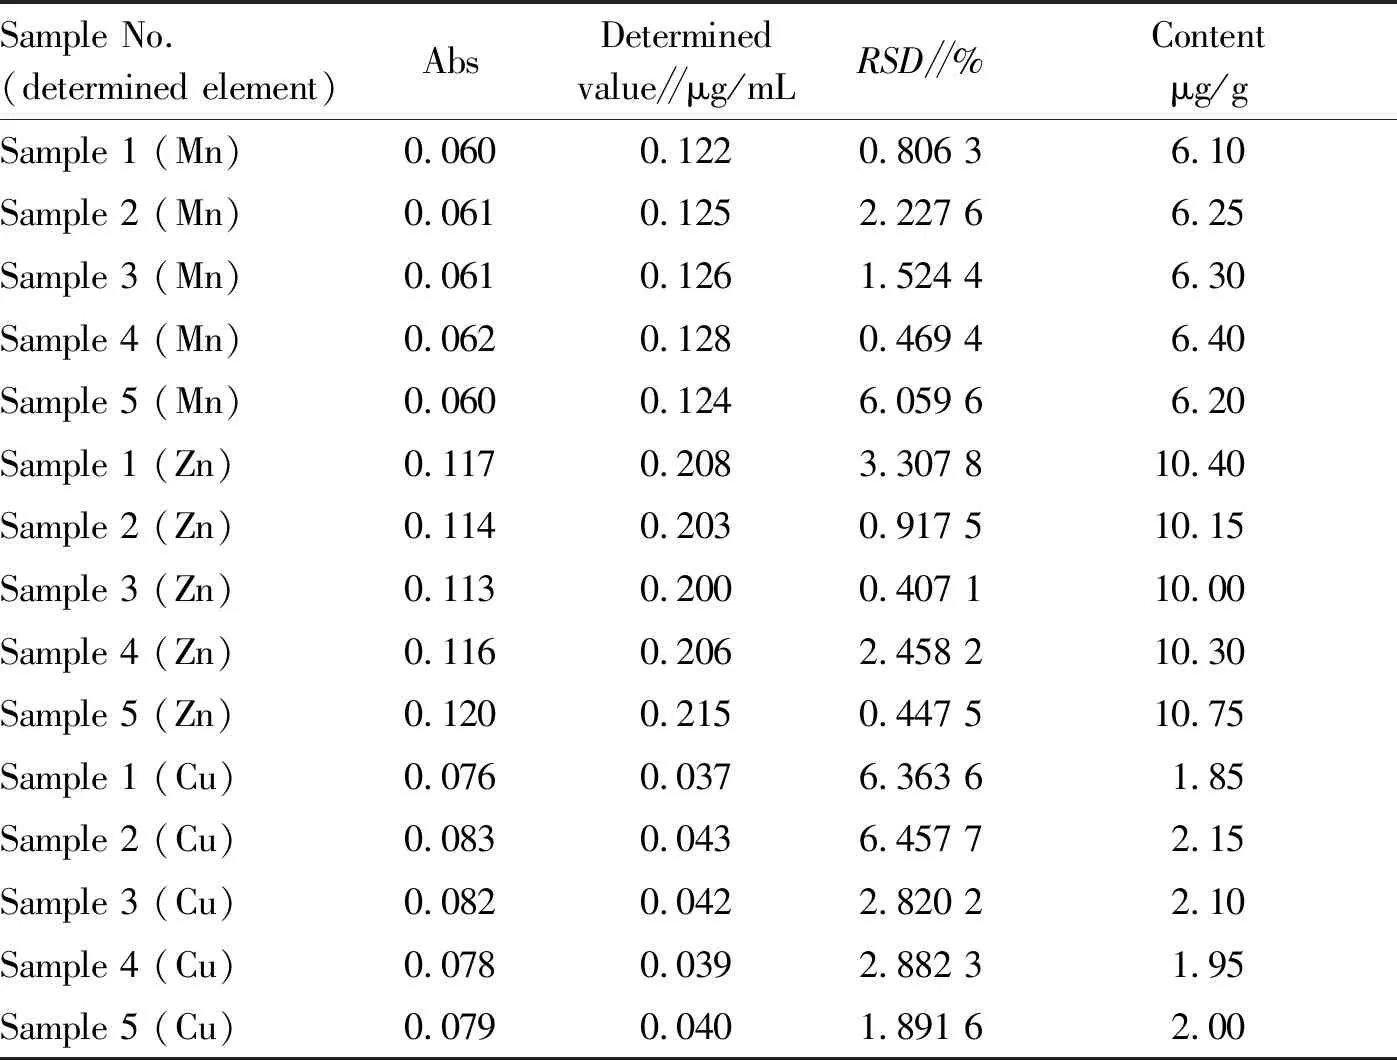
3.2.1Content of different trace elements inL.japonica. As shown in Table 4, the content of Mn, Zn and Cu in the five samples ofL.japonicawere not much different (RSD<10%). The data was more accurate. The content of Cu inL.japonicawas lower, and the content of Zn was higher. The content of Zn was about 5 times that of Cu.
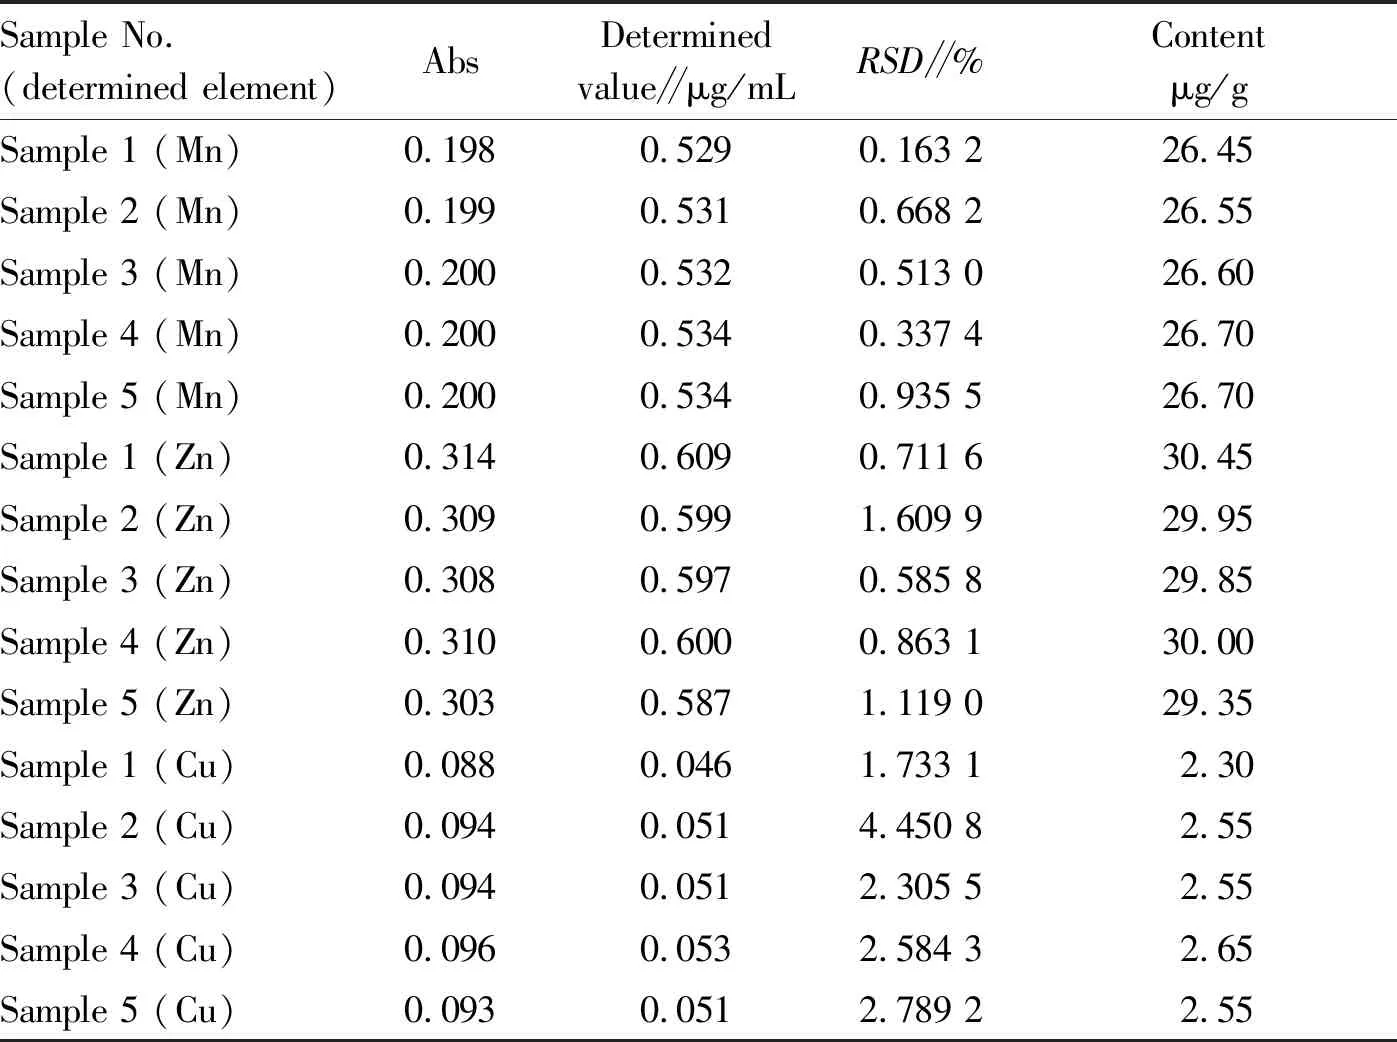
3.2.2Content of different trace elements inA.auricula. As shown in Table 5, the content of Mn, Zn and Cu in the five samples ofA.auriculawas close. InA.auricula, the content of Zn was highest, followed by that of Mn, and the content of Cu was lowest.
3.2.3Content of different trace elements inPorphyra. As shown in Table 6, the absorbance and determined value of the same trace element were not much different from each other inPorphyra. TheRSDvalues of Mn and Zn were less than 1%. The content of the three trace elements was all relatively high inPorphyra. Among them, the content of Zn was highest (38.40 μg/g), and the content of Mn and Cu was lower, but it is also above 10 μg/g.
Table4ContentofdifferenttraceelementsinLaminariajaponica

Sample No.(determined element)AbsDeterminedvalue∥μg/mLRSD∥%Contentμg/gSample 1 (Mn)0.0600.1220.806 36.10Sample 2 (Mn)0.0610.1252.227 66.25Sample 3 (Mn)0.0610.1261.524 46.30Sample 4 (Mn)0.0620.1280.469 46.40Sample 5 (Mn)0.0600.1246.059 66.20Sample 1 (Zn)0.1170.2083.307 810.40Sample 2 (Zn)0.1140.2030.917 510.15Sample 3 (Zn)0.1130.2000.407 110.00Sample 4 (Zn)0.1160.2062.458 210.30Sample 5 (Zn)0.1200.2150.447 510.75Sample 1 (Cu)0.0760.0376.363 61.85Sample 2 (Cu)0.0830.0436.457 72.15Sample 3 (Cu)0.0820.0422.820 22.10Sample 4 (Cu)0.0780.0392.882 31.95Sample 5 (Cu)0.0790.0401.891 62.00
Table5ContentofdifferenttraceelementsinAuriculariaauricula(L.exHook.)Underwood

Sample No.(determined element)AbsDeterminedvalue∥μg/mLRSD∥%Contentμg/gSample 1 (Mn)0.1980.5290.163 226.45Sample 2 (Mn)0.1990.5310.668 226.55Sample 3 (Mn)0.2000.5320.513 026.60Sample 4 (Mn)0.2000.5340.337 426.70Sample 5 (Mn)0.2000.5340.935 526.70Sample 1 (Zn)0.3140.6090.711 630.45Sample 2 (Zn)0.3090.5991.609 929.95Sample 3 (Zn)0.3080.5970.585 829.85Sample 4 (Zn)0.3100.6000.863 130.00Sample 5 (Zn)0.3030.5871.119 029.35Sample 1 (Cu)0.0880.0461.733 12.30Sample 2 (Cu)0.0940.0514.450 82.55Sample 3 (Cu)0.0940.0512.305 52.55Sample 4 (Cu)0.0960.0532.584 32.65Sample 5 (Cu)0.0930.0512.789 22.55
Table6ContentofdifferenttraceelementsinPorphyra

Sample No.(determined element)AbsDeterminedvalue∥μg/mLRSD∥%Contentμg/gSample 1 (Mn)0.1680.4400.323 922.00Sample 2 (Mn)0.1700.4450.000 022.25Sample 3 (Mn)0.1680.4410.359 022.05Sample 4 (Mn)0.1690.4430.237 022.15Sample 5 (Mn)0.1700.4460.731 722.30Sample 1 (Zn)0.3940.7640.273 838.20Sample 2 (Zn)0.3960.7680.105 638.40Sample 3 (Zn)0.3920.7600.322 938.00Sample 4 (Zn)0.3920.7590.678 337.95Sample 5 (Zn)0.3900.7560.165 537.80Sample 1 (Cu)0.3080.2042.644 410.20Sample 2 (Cu)0.3130.2072.523 410.35Sample 3 (Cu)0.3150.2096.087 310.45Sample 4 (Cu)0.3120.2072.799 110.35Sample 5 (Cu)0.3130.2082.528 610.40
3.2.4Content of different trace elements inC.pepo. As shown in Table 7, the absorbance and determined value of the same trace element differed slightly inC.pepo, with smallRSDvalue. The content of Mn and Cu inC.pepowas relatively low, around 1.0 μg/g. The content of Zn inC.pepowas relatively high, about 21.0 μg/g.
Table7ContentofdifferenttraceelementsinCucurbitapepoL.

Sample No.(determined element)AbsDeterminedvalue∥μg/mLRSD∥%Contentμg/gSample 1 (Mn)0.0270.0250.923 11.25Sample 2 (Mn)0.0270.0250.667 31.25Sample 3 (Mn)0.0260.0230.723 21.15Sample 4 (Mn)0.0270.0261.445 01.30Sample 5 (Mn)0.0260.0231.191 41.15Sample 1 (Zn)0.2170.4150.630 720.75Sample 2 (Zn)0.2190.4190.127 020.95Sample 3 (Zn)0.2200.4200.404 921.00Sample 4 (Zn)0.2180.4170.104 820.85Sample 5 (Zn)0.2180.4160.225 420.80Sample 1 (Cu)0.0660.0292.141 61.45Sample 2 (Cu)0.0610.0255.096 81.25Sample 3 (Cu)0.0700.0320.133 31.60Sample 4 (Cu)0.0560.0216.038 91.05Sample 5 (Cu)0.0670.0293.338 91.45
3.2.5Content of different trace elements inS.oleracea. As shown in Table 8, the absorbance and determined values of Mn and Zn inS.oleraceawere similar withRSDvalues less than 2%. The same trace element was not much different. TheRSDvalues of Cu differed greatly, but they were all less than 10%. InS.oleracea, the content of Zn was higher, and there was almost no Cu.
3.2.6Content of different trace elements inC.sativum. As shown in Table 9, the absorbance and determined values of Mn and Zn inC.sativumwere not much different. However, the values of Cu differed greatly. The content of Zn was relatively high. The content of Cu was relatively low, about 2.1 μg/g. TheRSDvalues of Mn and Zn were all less than 2%.
Table8ContentofdifferenttraceelementinSpinaciaoleraceaL.

Sample No.(determined element)AbsDeterminedvalue∥μg/mLRSD∥%Contentμg/gSample 1 (Mn)0.0410.0670.951 63.35Sample 2 (Mn)0.0410.0661.557 13.30Sample 3 (Mn)0.0420.0690.986 93.45Sample 4 (Mn)0.0410.0670.748 03.35Sample 5 (Mn)0.0420.0690.715 83.45Sample 1 (Zn)0.1480.2730.761 713.65Sample 2 (Zn)0.1480.2750.703 413.75Sample 3 (Zn)0.1490.2750.528 613.75Sample 4 (Zn)0.1480.2731.184 713.65Sample 5 (Zn)0.1470.2710.924 813.55Sample 1 (Cu)0.0490.0157.192 70.75Sample 2 (Cu)0.0350.0032.873 80.67Sample 3 (Cu)0.0470.0136.644 60.65Sample 4 (Cu)0.0460.0129.795 40.60Sample 5 (Cu)0.0430.0093.013 60.45
Table9ContentofdifferenttraceelementsinCoriandrumsativum

Sample No.(determined element)AbsDeterminedvalue∥μg/mLRSD∥%Contentμg/gSample 1 (Mn)0.0550.1091.358 95.45Sample 2 (Mn)0.0540.1060.140 35.30Sample 3 (Mn)0.0540.1060.419 95.30Sample 4 (Mn)0.0550.1090.347 05.45Sample 5 (Mn)0.0550.1090.682 05.45Sample 1 (Zn)0.2300.4420.631 622.10Sample 2 (Zn)0.2310.4440.610 622.20Sample 3 (Zn)0.2310.4430.501 322.15Sample 4 (Zn)0.2290.4390.425 221.95Sample 5 (Zn)0.2300.4410.479 722.05Sample 1 (Cu)0.0720.0339.197 81.65Sample 2 (Cu)0.0830.0425.269 32.10Sample 3 (Cu)0.0860.0451.701 92.25Sample 4 (Cu)0.1130.0678.341 63.35Sample 5 (Cu)0.1130.0663.665 13.30
3.2.7Statistics of contents of different trace elements in six vegetables. Based on the above data, the average content of Mn, Zn and Cu in the six vegetables,L.japonica,A.auricula,Porphyra,C.pepo,S.oleraceaandC.sativumwas calculated. As shown in Table 10, among the six vegetables, the content was Mn was highest inA.auricula(26.60 μg/g) and lowest inC.pepo(1.22 μg/g); the content of Zn was highest inPorphyra(38.07 μg/g) and lowest inL.japonica(10.32 μg/g); and the content of Cu was highest inPorphyra(10.35 μg/g) and lowest inS.oleracea(0.62 μg/g). The content of same trace element differed greatly among different vegetables.
Table10Contentofdifferenttraceelementsinsixvegetablesμg/g

Trace elementL. japonicaA. auriculaPorphyraC. pepoS. oleraceaC. sativumMn6.2526.6022.151.223.385.39Zn10.3229.9238.0720.8713.6722.09Cu2.012.5210.351.360.622.53
4 Conclusions and discussions
The content of Mn, Zn and Cu inL.japonica,A.auricula,Porphyra,C.pepo,S.oleraceaandC.sativumpurchased from a vegetable market in Cangzhou City was determined by atomic absorption spectrophotometry. The linear regression equations were established. The correlation coefficient was between 0.998-0.999. The relative standard deviation of most data was less than 3%. The experimental method is simple and rapid, and has good precision and can be used for the determination of elements in general vegetables. Zhang Shaojunetal.[7]determined the content of Cu, Zn and Pb in vegetables purchased from Sanmenxia City by flame atomic absorption spectrophotometry. The method is simple and rapid. TheRSDwas less than 1.4%, and the sampling recovery was between 92.3%-97.2%, indicating that the method is feasible. Pang Xin’an[8]determined the content of eight mineral elements in almond, fig, oleaster and pomegranate using air-acetylene flame atomic absorption spectrophotometry. The linear range of the determination method is wide. The correlation coefficient was between 0.996-0.999. The relative standard deviation was all less than 2%. He Fengqin[9]determined the content of Fe in spinach and cucumber by atomic absorption spectrophotometry. The samples were repeatedly determined, and the standard deviations of the means were ≤ 2.1%, in line with national standards. Dong Bingkunetal.[10]determined the content of Cu in tomato, zucchini and cabbage by flame atomic absorption spectrophotometry. The results were in line with national standards. The Cu content in vegetables was greater than that in fruits.
The six vegetables ofL.japonica,A.auricula,Porphyra,C.pepo,S.oleraceaandC.sativumall contained certain amounts of Mn, Zn and Cu, but there were certain differences. The overall analysis showed that the average content of Zn in the six vegetables was much higher than that of Cu, and the average content of Zn was seven times that of Cu. The content of trace elements in vegetables has a lot to do with fertilizer, soil, environment,etc. The determination results differed among different regions. There were some differences in the determined results among different regions. Zn is an essential trace element in the human body. The recommended daily intake for adults is 10-15 mg per capita. The recommended daily intake of Mn is 2.0-3.0 mg per capita. The recommended daily intake of Cu is 2.0 mg per capita. Based on the daily intake of trace elements, according to experimental conclusions, healthy adults should reduce the intake of vegetables with high content of elements. For those who lack Mn, Zn, and Cu, they can appropriately increase the consumption ofA.auriculaandPorphyra. It is noted that excessive intake will cause poisoning.
杂志排行
Asian Agricultural Research的其它文章
- Establishment and Optimization of Two-dimensional Electrophoresis System for Spleen Proteome of Sillago sihama Forsskål
- Breeding of a New Tussah Variety "Gaoyou 1"
- Study of the Discount on Private Placements and Risk of Stock Market Crash in Listed Companies
- Investigation and Analysis on Diversity of Lucanidae spp. in Fanjing Mountain National Nature Reserve
- Spatio-temporal Variability of Disastrous Convective Weather in China from 1961 to 2016
- Impact of Sino-US Trade Friction on Import and Export Trade Pattern of Soybean in Heilongjiang
