Application of Combined Prediction Model in Predicting Total Water Consumption in Ningxia
2019-04-25,,,,*
, , ,,*
1. School of Civil Engineering and Hydraulic Engineering, Ningxia University, Yinchuan 750021, China; 2. Engineering Research Center of the Ministry of Education for the Modern Utilization of Modern Agricultural Water Resources in Arid Areas, Ningxia University, Yinchuan 750021, China; 3. Innovation Team of Ministry of Education for Modern Utilization of Modern Agricultural Water Resources in Arid Areas, Ningxia University Yinchuan 750021, China
Abstract The gray GM (1,1) prediction model and Logistic equation gray prediction model were established separately, and then the combined prediction model was established. Taking the water consumption in Ningxia Hui Autonomous Region from 2006 to 2012 as modeling data, the total water consumption of the whole region of Ningxia in 2018-2020 was analyzed and predicted. The results show that the accuracy of the three prediction models meets the accuracy requirements, but the gray GM(1,1) and combined prediction models better conform to the actual situation and have better applicability.
Key words GM (1,1) prediction, Logistic equation gray predict, Combined prediction, Water consumption
1 Introduction
The gray prediction method has been widely applied in the prediction of urban water consumption[1-4]. When the actual water use sequence is easy to collect in the near future, using the gray model to predict the water consumption has a clear advantage[5]. In the prediction of the population, resources, environment and ecology systems, the Logistic function is also frequently used[6]. The modeling technique of gray system theory, the parameters of Logistic equation were estimated[7-8], then it was used to predict. The gray prediction model and Logistic gray prediction model were combined together to form the combined prediction model, to predict the urban water consumption. Since the combined prediction model has the advantage of both models, the prediction results will be more reasonable and accurate.
2 Building of combined prediction model
2.1GrayGM(1,1)modelGray system prediction model (GM) was developed by Professor Deng Julong. This model needs less data and the calculation is simple, the specific steps are as follows[1-5]:
Step 1: conduct the one-time accumulation of the original data series, to obtain the incremental series,i.e.
(1)
whereX(1)denotes the sum of the previous numbers of the corresponding ordinals in the original series;
Step 2: build the matrixXandXN.
(2)
(3)
Step 3: solve the model coefficient vector (using the least squares method).
(4)
whereλdenotes the development coefficient, andudenotes the gray action amount.
Step 4: establish the model.
(5)
Step 5: predict the water consumption. The value obtained from the above formula is the simulation value accumulated from the prediction value, then the actual prediction value can be obtained from one time degression.
(6)
2.2Logisticequationgraypredictionmodel(i) Gray molding for the Logistic equation parameters[6-8].
(7)
whereydenotes the growth of water consumption in the year to be measured,Ldenotes the upper limit of growth ofy;bdenotes the free growth rate of the year to be measured;tdenotes the time of growth of the water consumption.
Letx=1/y;B=1/L, then we can express the Logistic equation as:
1/y=(1+ae-tb)/L
(8)
i.e.:x=B(1+ae-tb)
(9)
Then, we calculated the derivative oftin both sides of the Equation (9), and obtained
(10)
Ifλ=b,u=Bb, we can change the Logistic equation in the same form of differential equation as the gray GM (1, 1) prediction model.i.e.:
(11)
(ii) According to the calculation steps of the gray GM (1,1) prediction model, solvedλanduusing the formula (2) and formula (4). The change ofxwith time presents an exponential change, which can be expressed by the reciprocal of the exponentyto be measured;XN=(x2-x1,x3-x2…,xn-xn-1)T. Then, in the Logistic equation,b=λ,L=1/B=λ/μ, ɑ=(L/y0-1)ebt0, we can calculate the Logistic equation of water consumption.
2.3GM(1,1)LogisticgraycombinedpredictionmodelDifferent single-item prediction models provide useful information in all aspects from different perspectives, each has advantages and disadvantages. Combining the two prediction methods can balance the errors of the two prediction models, the prediction will be more comprehensive than the single prediction model and improve the prediction accuracy[9]. The combined prediction model adopts the linear combination prediction method. It calculates the weighting coefficient of the two prediction models by the principle of the square sum of the combined predict errors in a period of past time, combined with the gray GM (1,1) prediction model and the logistic equation gray prediction model, to realize the combination of prediction results. Combined prediction is more systematic, comprehensive, scientific, and can effectively reduce the impact of some environmental factors than a single prediction model[1].
3 Prediction model for water consumption of Ningxia
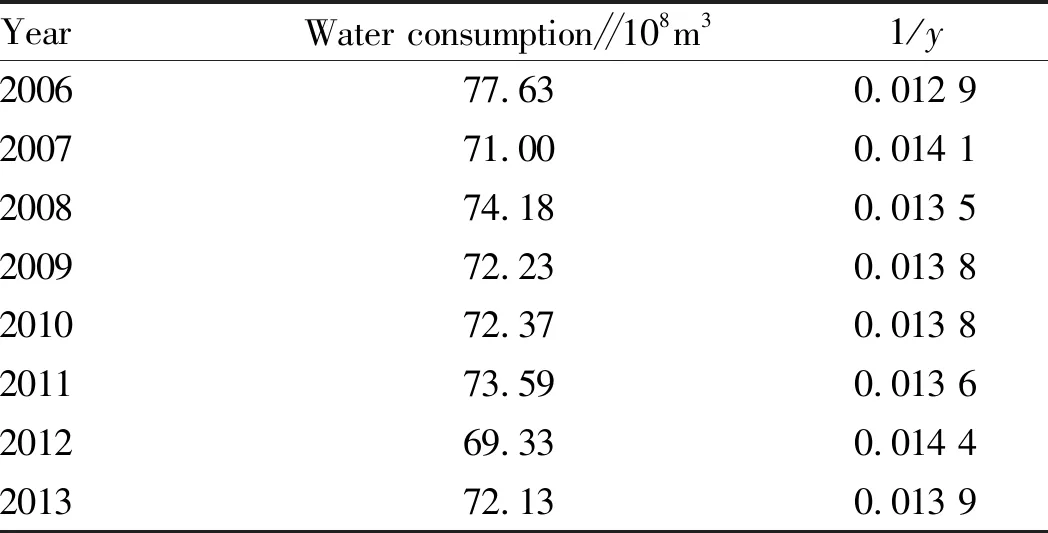
Taking the water consumption data in the whole region of Ningxia in 2006-2013 as the data for building the model, using the gray GM (1,1) prediction model and Logistic equation gray prediction model, we predicted the water consumption in the whole region of Ningxia in 2020-2025. The original data of water consumption are listed in Table 1.
Table1WaterconsumptioninthewholeregionofNingxiain2006-2013

YearWater consumption∥108m31/y200677.630.012 9200771.000.014 1200874.180.013 5200972.230.013 8201072.370.013 8201173.590.013 6201269.330.014 4201372.130.013 9

3.2Logisticequationgraypredictionmodely=71.949 5/(1-0.311 95e-1.450 2t), through calculation, (λ,u)=(1.450 2, 0.020 2),i.e.b=λ=1.450 2,L=71.949 5, ɑ=-0.311 95. The model isy=71.949 5/(1-0.311 95e-1.450 2t).
3.3CombinedpredictionmodelThe simulation results of gray GM (1,1) prediction model and Logistic equation gray prediction model are known, the weighting coefficient of the two prediction models is calculated by the principle of the square sum of the combined predict errors in a period of past time[9]. According to one time degression, we obtained the simulated value of the water consumption of the whole region of Ningxia in 2006-2013 (Table 2).
Table2Comparisonofsimulationresultsofpredictionmodels

YearActual value108m3GM simulationdataLogisticsimulation dataSimulationdataGM relativeerror∥%Logistic relativeerror∥%Relative error ofcombined model∥%200677.6377.6377.6377.63---200771.0072.6473.2172.922.313.112.49200874.1872.4672.2472.35-2.32-2.61-2.39200972.2372.2972.0272.150.08-0.290201072.3772.1171.9772.04-0.36-0.560.40201173.5971.9371.9571.94-2.25-2.22-2.25201269.3371.7671.9571.863.503.773.57201372.1371.5871.9571.77-0.76-0.25-0.64
From the calculations in Table 2, it can be seen that the gray GM (1,1) prediction model simulation results: the absolute error was in the range of 0.06-2.43, and the average value was 1.19; the relative error was in the range of 0.08-3.5, and the average value was 1.65. The model simulation value was close to the actual value, so the accuracy was very high. The Logistics simulation results are listed in Table 3. From the simulation results, it can be seen that the absolute error was in the range of -0.18-2.62, and the average value was 1.31; the relative error was in the range of -0.25-3.77, and the average value was 1.83, showing high simulation accuracy.
From the prediction results: on the whole, the relative error of the three methods was not too large, and all can be used in prediction of water consumption of Ningxia. The prediction results of combined method are close to and slightly better than the gray prediction method and the Logistic gray prediction results. Through analyzing the original water consumption data with large fluctuation in 2007, 2008 and 2012, and the relative error of the Logistic gray method was the largest, indicating that the Logistic model has higher requirements on the smoothness of the data series. The large fluctuations in the smaller part of the data have a greater impact on the prediction accuracy[9]. Under this circumstance, it is more suitable for using the gray prediction method. Although the combined prediction method can improve prediction accuracy to some extent, it is more complicated than the gray method and increases the prediction difficulty.
4 Prediction for water consumption of Ningxia
Through calculation, the gray GM (1,1) prediction model, the Logistic equation gray prediction model and the combined prediction model simulation results are close to the actual values. All these three model meet the accuracy requirements and can be used for the prediction of future water consumption in Ningxia. In this paper, we used the GM (1,1) prediction model and the combined prediction model to predict the water consumption of Ningxia in 2018-2020. The prediction results of the models are listed in Table 3. From 2012, the prediction value of the Logistic equation gray prediction model is close to the critical point. The change is very small and does not meet the actual situation of change of the water consumption.
Table3PredictionresultsofwaterconsumptioninthewholeregionofNingxiain2018-2020

YearGray GM (1,1)predictionLogistic equationgray predictionCombinedprediction201870.72 71.95 71.00201970.55 71.95 70.87202070.37 71.95 70.73
5 Conclusions
Based on the historical data of the water consumption in Ningxia, we separately established the gray GM (1,1) prediction model, Logistic equation gray prediction model, and the combined prediction model, and compared the prediction accuracy of these three models. From the prediction results, the prediction accuracy of the three methods is relatively high, and all of them can be used for water consumption prediction in the region. Among them, the prediction error of the combined method and the gray prediction method is smaller due to the data fluctuation, and the Logistic equation gray prediction has larger error in the years with larger data fluctuation.
Through analysis of the prediction value: the gray GM(1,1) prediction value shows a downward trend, the Logistic equation prediction value decreases from the beginning to the critical point in 2012, and it shows a steady state, which does not meet the development trend of water consumption. The prediction value of combined model remains between them and shows slow decline state. According to the prediction results, the combined prediction value is more suitable for actual situations of the water consumption in the whole region of Ningxia.
Among the three prediction models, the gray method needs the least data, the calculation is most simple, and the relative accuracy is higher. Therefore, it is recommended to use the gray GM (1,1) method to predict the water consumption in Ningxia.
杂志排行
Asian Agricultural Research的其它文章
- Breeding of a New Tussah Variety "Gaoyou 1"
- Identification and Control of HLB Disease in Citrus grandis
- Influence of Different Fertilization Levels on Maize Yield and Fertilizer Effect Based on the "3414" Experimental Design Scheme
- Preliminary Study on Shelf Life of Artificial Feed of Chilo suppressalis
- Content Determination of Trace Elements in Several Vegetables by Atomic Absorption Spectrophotometry
- Industrial Poverty Alleviation Model in Southwestern High-altitude Mountainous Areas of China
——A Case Study of Industrial Poverty Alleviation of Xueshan Township in Luquan County of Yunnan Province through Planting Codonopsis pilosula
