Influence of Different Fertilization Levels on Maize Yield and Fertilizer Effect Based on the "3414" Experimental Design Scheme
2019-04-25,,,*,,,
, , ,*, , ,
1.College of Plant Protection, Yunnan Agricultural University, Kunming 650201, China; 2.Yunnan Yuntianhua Co., Ltd., Kunming 650228, China; 3.Yunnan Chemical Research Institute, Kunming 650228, China
Abstract In order to provide scientific basis for rational fertilization of maize under different soil quality and fertility, the effect of combined application of NPK on yield and fertilizer effect of different maize varieties was studied by using "3414" experimental design scheme in this paper. The results showed that there were significant differences in ear length, ear diameter, barren ear tip length, kernel number per spike, kernel weight and yield among different fertilization treatments. Fertilization can improve the agronomic characters of maize and increase the yield. The yield increase of maize in two experimental plots (MHQ and HZY) was 11.0%-64.3% and 0.2%-61.9%, respectively. There was obvious interaction effect among nitrogen, phosphorus and potassium fertilizers, the yield of maize was the highest at the level of medium nitrogen, medium phosphorus and medium potassium fertilization, and the fertilizer effect was in the order of N>P2O5>K2O. The results of curve fitting showed that the recommended application rates of N, P2O5 and K2O in MHQ plot were 373.7, 74.8 and 79.9 kg/ha, respectively; the recommended application rates of N, P2O5 and K2O in HZY plot were 419.7, 75 and 75 kg/ha, respectively.
Key words Maize, Rational fertilization, Fertilizer effect, Yield
1 Introduction
Maize is one of the three major food crops in the world, mainly used for food and feed processing. At present, more and more attention has been paid to the use of maize industrial processing, and its energy substitution prospects are also very broad in the future. However, there are large blind spots in maize cultivation by the majority of growers. The planting mode and structure are not reasonable enough, and the planting technology does not meet the requirements. The thinking of small farmers leads to growers only cultivating land, not maintaining land, they generally apply more nitrogen fertilizers, less or no phosphorus and potassium fertilizers and medium trace element fertilizers. In terms of organic material input, growers also follow the original model of straw burning and returning it to the field. Therefore, the yield can not be increased, the application of chemical fertilizer and the single variety structure lead to the high incidence of crop diseases and pests, the low yield and quality of maize, and the continuous deterioration of soil structure, which seriously affects the quality of soil and environment[1-2]. It is of great significance to determine the rational application rate and proportion of nitrogen, phosphorus and potassium in maize by testing soil for formulated fertilization.
According to the characteristics of crop fertilizer requirement, soil fertilizer supply performance and fertilizer effect, the "3414" experiment is to put forward the reasonable application rate and proportion of nitrogen, phosphorus and potassium on the premise of measuring soil nutrient status. It is the main field experiment scheme of recommended fertilization for field crops at present. The experimental design scheme is the main field test scheme recommended by testing soil for formulated fertilization, which is widely carried out in the whole country. Fertilization index systems have been established on rice[3], wheat[4], rape[5]and barley[6], respectively. Maize, as the main food crop and new energy alternative crop in China, has received extensive attention[1,7-9], but there are few studies on the recommended fertilization of maize under different varieties, different soil quality and fertility. Therefore, two maize varieties were selected and three different fertilizer ratios of nitrogen, phosphorus and potassium were designed by "3414" scheme to carry out field experiments on different soil quality and establish fertilizer effect model to study the effect of nitrogen, phosphorus and potassium ratio on maize yield, in order to provide a scientific basis for rational fertilization of maize under different soil quality and fertility.
2 Materials and methods
2.1 Materials
2.1.1Maize tested. The varieties are Huidan 4 and Changcheng 799, provided by Lijiang Agricultural Technology Extension Station.
2.1.2Fertilizers tested. Nitrogen fertilizer is urea (N 46%), phosphorus fertilizer is ordinary superphosphorus (P2O514%), potassium fertilizer is potassium sulfate (K2O 50%). All three fertilizers are provided by Yunnan Yuntianhua Co., Ltd.
2.2OverviewoftheexperimentalsiteFrom June to October 2012, the experiments were carried out in Fengle Village, Lashi Town, Yulong County, Lijiang City, Yunnan Province(26°51′12″ N,100°07′01″ E) and Haidong Village, Lashi Township, Yulong County, Lijiang City, Yunnan Province (26°49′08″ N,100°07′36″ E). The names of two test plots were marked with MHQ and HZY, respectively. This area has a monsoon climate of low latitude warm temperate mountain plateau, it has the three-dimensional climate characteristics of "four seasons in the same mountain, different weather conditions in ten miles". The altitude is 2 459 m, the annual sunshine is 2 475.2 h, the annual average temperature is 14.2℃, and the average rainfall is 897.3 mm. MHQ’s soil type is alluvial soil with deep soil layer and sand texture, and there is flat terrain. The previous crop is broad beans. HZY’s soil type is red soil with moderate soil texture, and there is no previous crop. Specific soil physical and chemical properties are shown in Table 1.
Table1Physicalandchemicalpropertiesatthe0-20cmdeepsoil

PlotpHOMg/kgTotal Ng/kgAlkail.Nmg/kgAlkail.Pmg/kgAlkail.Kmg/kgMHQ7.738.42.10118.516.0134.0HZY5.811.61.9376.460.056.0
2.3ExperimentaldesignThe "3414" test scheme was adopted in the experiment, and three experimental factors were set: the application rates of nitrogen fertilizer, phosphorus fertilizer and potassium fertilizer. Each experimental factor had 4 fertilization levels (0, 1, 2, 3), a total of 14 treatments and 3 replicates, with randomized block design. The experimental factors and fertilization levels are shown in Table 2. The plot area was 20 m2(3.9 m×5.1 m). Three ridges of maize were planted in each plot, and the row spacing was 20 cm.
Table2Applicationrateatdifferentfertilizerlevels

LevelsN∥kg/haP2O5∥kg/haK2O∥kg/ha00.00.00.01180.037.537.52360.075.075.03540.0112.5112.5
2.4TestmanagementThe MHQ experimental plot was ploughed by machine on April 3, 2012. The farm manure was applied before ploughing at 7 500 kg/ha. On April 4th, the plot was planned according to the design requirements and covered with plastic film. There are 3 rows per plot, large row spacing is 1.2 m, small row spacing is 0.4 m, and plant spacing is 0.35 m. The planting density is 4 050 plants sown in wide-narrow row alternation with two rows for two plants. Seedling emerged on April 15, final singling occurred on April 25, jointing fertilizer was applied on June 18, panicle fertilizer was applied on July 14 at spinning stage, harvest occurred on September 18, and the whole growth period was 163 d. The fertilizer was applied three times, 28% nitrogen fertilizer and all phosphorus and potassium fertilizer were used as base fertilizer. The rest of nitrogen fertilizer was applied as jointing fertilizer (36%) and panicle fertilizer (36%).
The HZY experimental plot was ploughed and leveled by machine on April 6, 2012. Farm manure was applied before ploughing at 7 500 kg/ha. On April 7th, the plot was planned according to the design requirements and covered with plastic film. There are 3 rows per plot, large row spacing is 1.2 m, small row spacing is 0.4 m, plant spacing is 0.35 m. The planting density is 4 050 plants sown in wide-narrow row alternation with two rows for two plants. Seedling emerged on April 18, final singling occurred on April 27, jointing fertilizer was applied on June 21, panicle fertilizer was applied on July 17 at spinning stage, harvest occurred on September 19, and the whole growth period was 165 d. The fertilizer was applied three times, 28% nitrogen fertilizer and all phosphorus and potassium fertilizer were used as base fertilizer. The rest of nitrogen fertilizer was applied as jointing fertilizer (36%) and panicle fertilizer (36%).
The field management of tillage, soil cultivation, weeding and pest control was consistent in all treatments during the growth period of the two experimental plots, and the pest control and weed control were carried out twice in the growth period of maize.
2.5DataanalysisExcel 2010 was used to process and analyze the data, and SPSS 13.0 was used to test the significance of the difference between the two treatments. Univariate quadratic and ternary quadratic equations were used to fit the yield. The optimum model was selected according to the determination coefficients fitted by different equations, and the application rate of nitrogen, phosphorus and potassium fertilizer for the highest yield of maize was determined by the analysis of marginal effect of the model.
3 Results and analysis
3.1 Influence of different treatments on agronomic characters and yield effects of maize
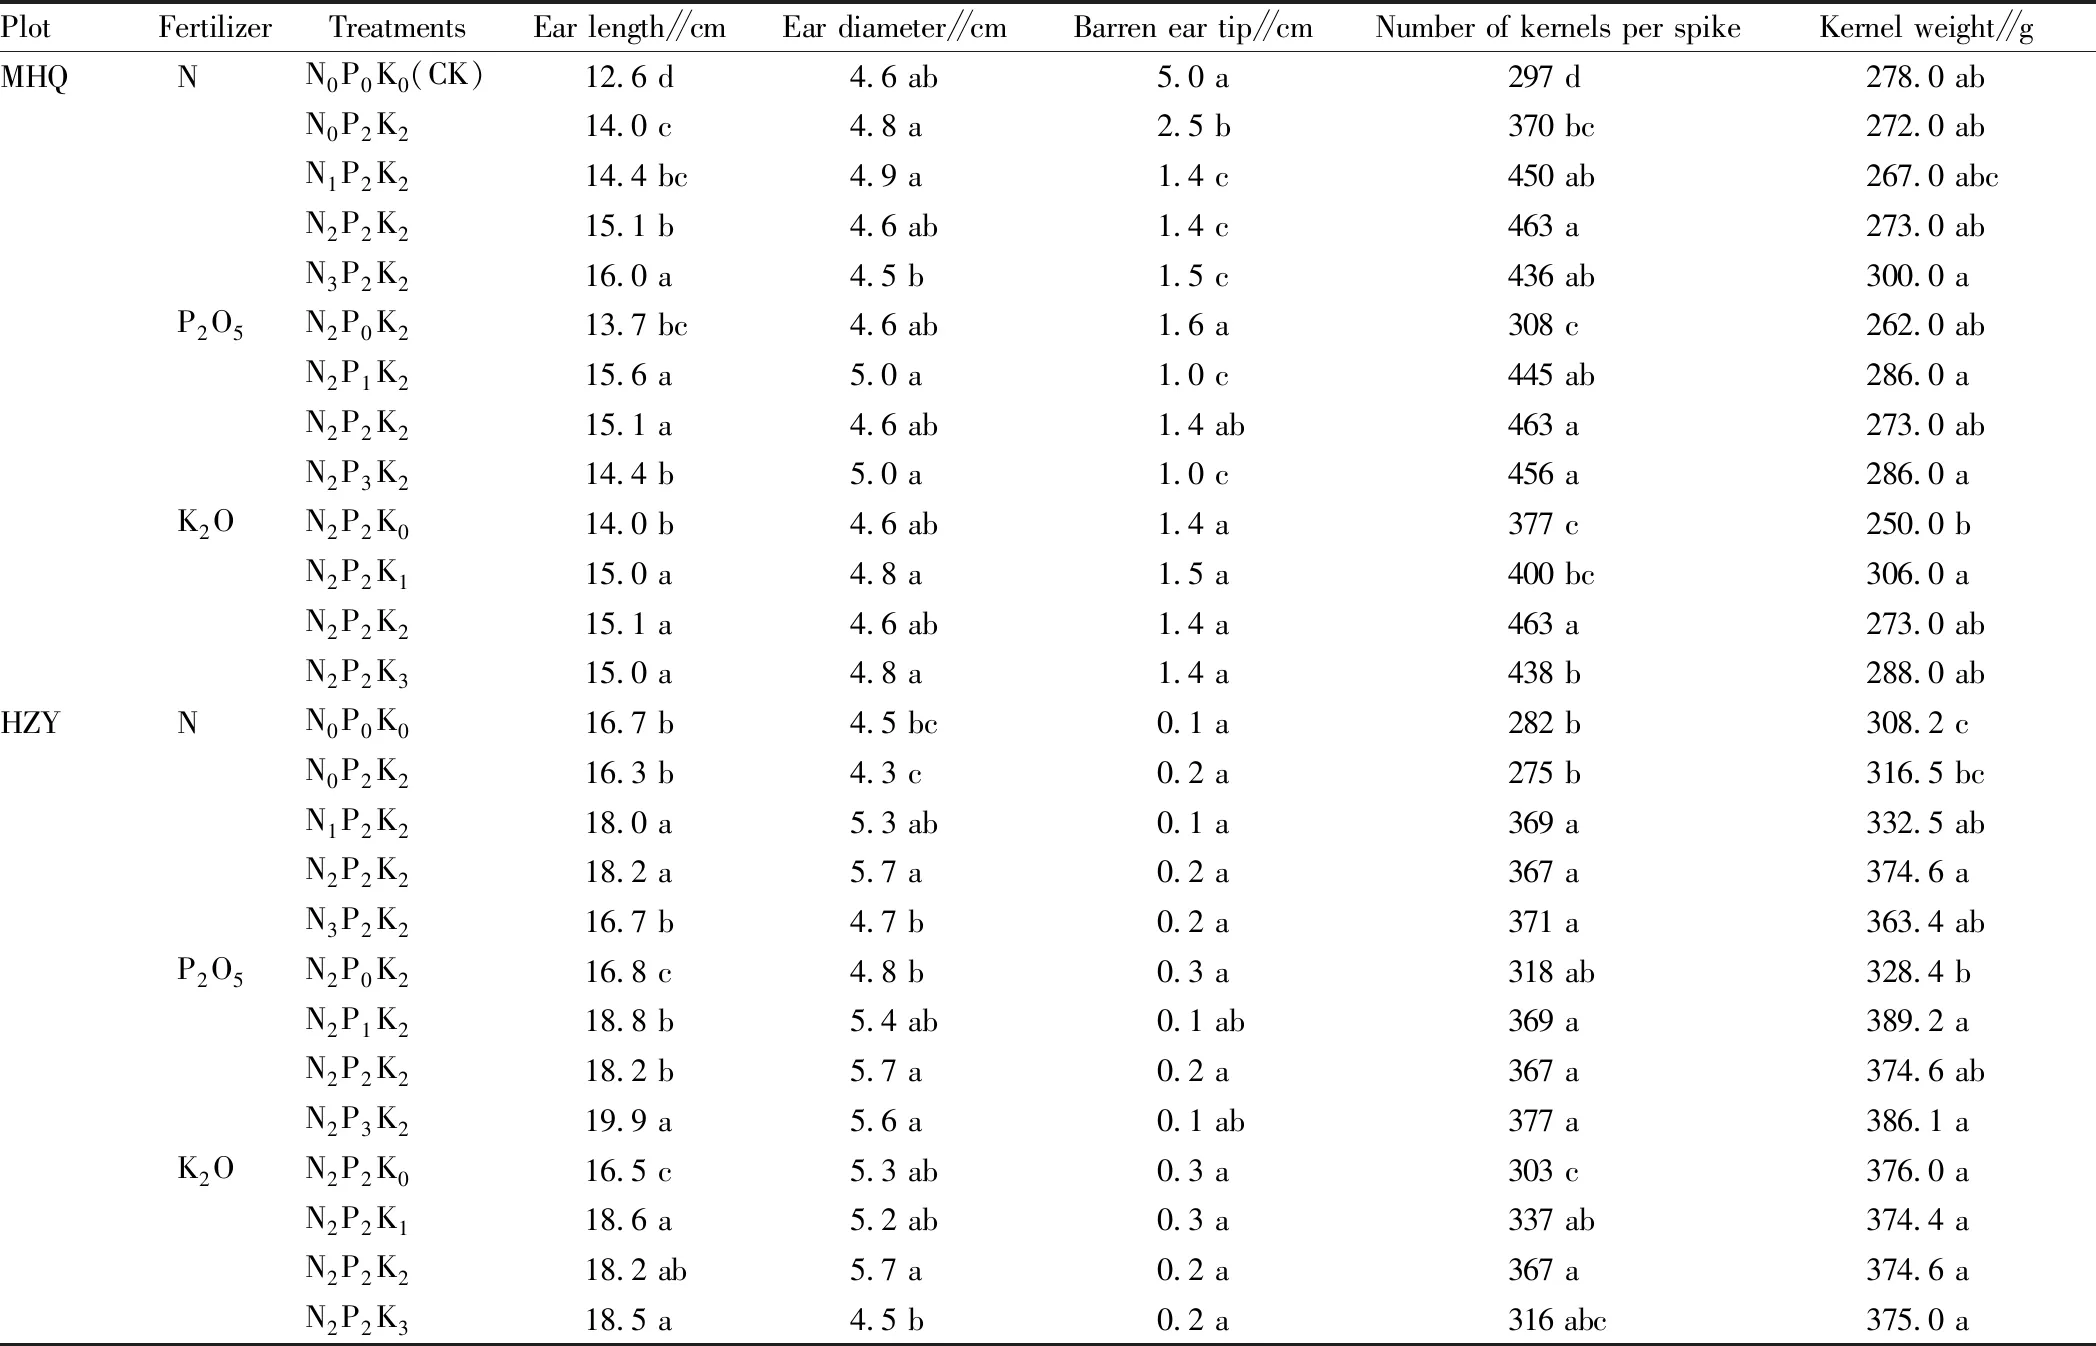
3.1.1Agronomic characters. It can be seen from Table 3 that compared with no fertilizer treatment (N0P0K0), the ear length, ear diameter and kernel number per panicle under fertilization treatment in MHQ plot increased as a whole, but the barren ear tip length of maize decreased significantly, and the kernel weight fluctuated greatly. The ear length, ear diameter, barren ear tip length, kernel number per spike and kernel weight of maize increased significantly under fertilization treatment in HZY plot. Compared with no nitrogen treatment (N0P2K2), the ear length of maize under N1, N2and N3treatments in MHQ plot increased by 2.9%, 7.9% and 14.3%, respectively. The number of kernels per panicle increased by 21.6%, 25.1% and 17.8%, and the length of barren ear tip decreased by 44.0%, 44.0% and 40.0%. In HZY plot under N1, N2and N3treatments, panicle length increased by 10.4%, 11.7% and 2.5%, panicle diameter increased by 23.3%, 32.6% and 9.3%, and kernel number per panicle increased by 34.0%, 33.4% and 34.9%, kernel weight increased by 5.1%, 18.4% and 14.8%, respectively. Compared with no phosphorus treatment (N2P0K2), the ear length of maize under P1, P2and P3treatments in MHQ plot increased by 13.9%, 10.2% and 5.1%, respectively, and the number of kernels per panicle increased by 44.5%, 50.3% and 48.1%, respectively. The kernel weight increased by 9.2%, 4.2% and 9.2%, respectively, but the barren ear tip length decreased by 44.5%, 50.3% and 48.1%, respectively. In HZY plot under P1, P2and P3treatments, the ear length increased by 11.9%, 8.3% and 18.5%, ear diameter increased by 12.5%, 18.8% and 16.7%, the number of kernels per panicle increased by 16.0%, 15.4% and 18.6%, respectively. The kernel weight increased by 18.5%, 14.1% and 17.6%, respectively, but the barren ear tip length decreased by 66.7%, 33.3% and 66.7%, respectively. Compared with no potassium treatment (N2P2K0), the ear length of maize under K1, K2and K3treatments in MHQ plot increased by 7.1%, 7.9% and 7.1%, respectively, and the number of kernels per panicle increased by 6.1%, 22.8% and 16.2%, respectively, and the kernel weight increased by 22.4%, 9.2% and 15.2%, respectively. The ear length of maize under K1, K2and K3treatments in HZY plot increased by 12.7%, 10.3% and 12.1%, respectively, and the number of kernels per panicle increased by 11.3%, 21.2% and 4.3%, respectively, but the barren ear tip length decreased by 0,33.3% and 33.3%, respectively.
Table3Agronomiccharactersofmaizeunderdifferentfertilizationtreatments
PlotFertilizerTreatmentsEar length∥cmEar diameter∥cmBarren ear tip∥cmNumber of kernels per spikeKernel weight∥gMHQN N0P0K0(CK)12.6 d4.6 ab5.0 a297 d278.0 abN0P2K214.0 c4.8 a2.5 b370 bc272.0 abN1P2K214.4 bc4.9 a1.4 c450 ab267.0 abcN2P2K215.1 b4.6 ab1.4 c463 a273.0 abN3P2K216.0 a4.5 b1.5 c436 ab300.0 aP2O5N2P0K213.7 bc4.6 ab1.6 a308 c262.0 abN2P1K215.6 a5.0 a1.0 c445 ab286.0 aN2P2K215.1 a4.6 ab1.4 ab463 a273.0 abN2P3K214.4 b5.0 a1.0 c456 a286.0 aK2ON2P2K014.0 b4.6 ab1.4 a377 c250.0 bN2P2K115.0 a4.8 a1.5 a400 bc306.0 aN2P2K215.1 a4.6 ab1.4 a463 a273.0 abN2P2K315.0 a4.8 a1.4 a438 b288.0 abHZYNN0P0K016.7 b4.5 bc0.1 a282 b308.2 cN0P2K216.3 b4.3 c0.2 a275 b316.5 bcN1P2K218.0 a5.3 ab0.1 a369 a332.5 abN2P2K218.2 a5.7 a0.2 a367 a374.6 aN3P2K216.7 b4.7 b0.2 a371 a363.4 abP2O5N2P0K216.8 c4.8 b0.3 a318 ab328.4 bN2P1K218.8 b5.4 ab0.1 ab369 a389.2 aN2P2K218.2 b5.7 a0.2 a367 a374.6 abN2P3K219.9 a5.6 a0.1 ab377 a386.1 aK2ON2P2K016.5 c5.3 ab0.3 a303 c376.0 aN2P2K118.6 a5.2 ab0.3 a337 ab374.4 aN2P2K218.2 ab5.7 a0.2 a367 a374.6 aN2P2K318.5 a4.5 b0.2 a316 abc375.0 a
Note: Values followed by different lowercase letters are significantly in N, P and K treatments at the 5% level.
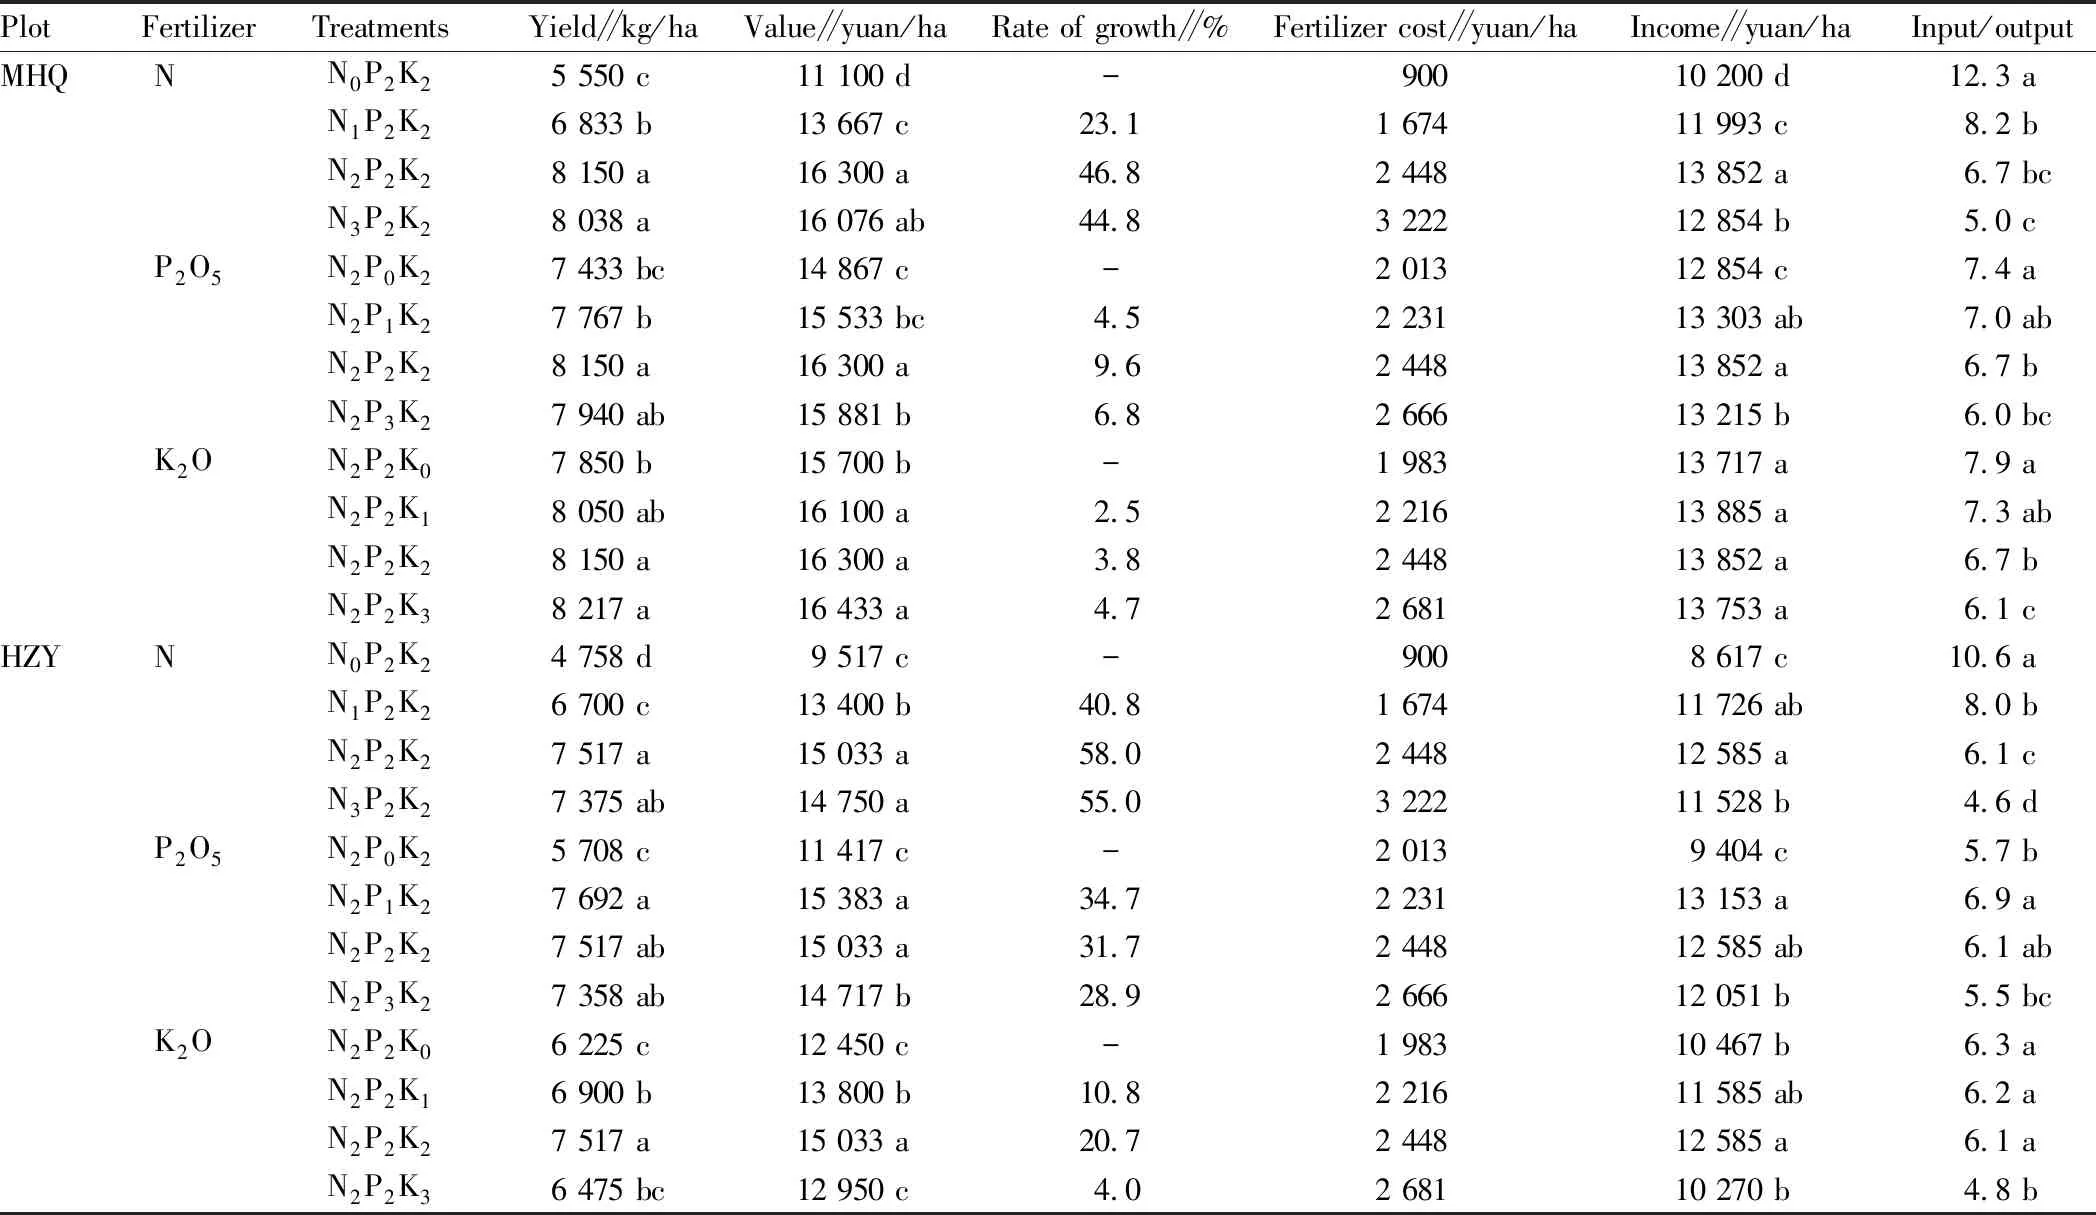
3.1.2Yield and economic benefits. From Table 4, it can be seen that the application of nitrogen, phosphorus and potassium fertilizer can increase the yield of maize in two experimental plots. Except N0P2K2of HZY plot, the yield of other treatments was significantly higher than that of N0P0K0(CK). The yield under N2P2K3and N2P1K2was the highest in MHQ and HZY, respectively, which was 64.3% and 61.9% higher than that of the control, respectively. Comparing the yield increase of maize in MHQ and HZY, the average yield increased by 38.3% and 53.5% for nitrogen fertilizer, 7.0% and 59.0% for phosphorus fertilizer and 3.7% and 62.8% for potassium fertilizer, respectively. Although the maize in MHQ and HZY showed yield increase effect with the increase of nitrogen, phosphorus and potassium application rate, the yield increase rate was quite different, which might be related to the soil fertilizer and maize varieties in the two experimental plots.
The ratio of output to input takes into account the output and cost input (cost only refers to the cost of fertilizer, the rest of the input is consistent, not considered), which is related to the final income. Under the fertilization treatments of K2P2, N2K2and N2P2, except that the ratio of output to input in HZY increased at first and then decreased with the amount of phosphorus applied, the ratio of output to input in the other treatments decreased with the increase of the amount of nitrogen, phosphorus and potassium applied. The highest ratio of output to input of all treatments in the two plots was in N0P2K2, 12.3 and 10.6, respectively. The lowest ratio of output to input was in N3P2K2treatment, which was 5.0 and 4.6, respectively. Because the ratio of output to input is affected by yield and fertilizer price, the change of ratio of output to input is different.
Table4EffectofN/P/Konmaizeyieldandeconomicbenefits
PlotFertilizerTreatmentsYield∥kg/haValue∥yuan/haRate of growth∥% Fertilizer cost∥yuan/haIncome∥yuan/haInput/outputMHQNN0P2K25 550 c11 100d-90010 200d12.3 aN1P2K26 833 b13 667c23.11 67411 993c8.2 bN2P2K28 150 a16 300a46.82 44813 852a6.7 bcN3P2K28 038 a16 076ab44.83 22212 854b5.0 cP2O5N2P0K27 433 bc14 867c-2 01312 854c7.4 aN2P1K27 767 b15 533bc4.52 23113 303ab7.0 abN2P2K28 150 a16 300a9.62 44813 852a6.7 bN2P3K27 940 ab15 881b6.82 66613 215b6.0 bcK2ON2P2K07 850 b15 700b-1 98313 717a7.9 aN2P2K18 050 ab16 100a2.52 21613 885a7.3 abN2P2K28 150 a16 300a3.82 44813 852a6.7 bN2P2K38 217 a16 433a4.72 68113 753a6.1 cHZYNN0P2K24 758 d9 517c-9008 617c10.6 aN1P2K26 700 c13 400b40.81 67411 726ab8.0 bN2P2K27 517 a15 033a58.02 44812 585a6.1 cN3P2K27 375 ab14 750a55.03 22211 528b4.6 dP2O5N2P0K25 708 c11 417c-2 0139 404c5.7 bN2P1K27 692 a15 383a34.72 23113 153a6.9 aN2P2K27 517 ab15 033a31.72 44812 585ab6.1 abN2P3K27 358 ab14 717b28.92 66612 051b5.5 bcK2ON2P2K06 225 c12 450c-1 98310 467b6.3 aN2P2K16 900 b13 800b10.82 21611 585ab6.2 aN2P2K27 517 a15 033a20.72 44812 585a6.1 aN2P2K36 475 bc12 950c4.02 68110 270b4.8 b
Note: The price of fertilizer in the year of planting is equivalent to pure N 4.3 yuan/kg, pure P2O55.8 yuan/kg, pure K2O 6.2 yuan/kg, local maize purchase price is 2 yuan/kg.
3.1.3Correlation analysis. Through the correlation analysis between maize yield and maize agronomic index, it was found that the correlation coefficient between maize yield and ear length in MHQ was 0.685, indicating that there was a very significant positive correlation (P<0.01); the correlation coefficient with barren ear tip length was -0.704, showing a very significant negative correlation (P<0.01); the correlation coefficient with the number of kernels per panicle was 0.534, showing a significant positive correlation (P<0.05). The correlation coefficients between maize yield and ear length, ear diameter, kernel number per spike or kernel weight in HZY plot were 0.665, 0.685, 0.909 and 0.794, respectively, indicating that there was a very significant positive correlation (P<0.01), but maize yield was not significantly correlated with barren ear tip length. The results showed that the yield of maize in the two plots was significantly affected by ear length and kernel number per spike, while the differences in ear diameter, barren ear tip length and kernel weight might be mainly affected by varieties. Therefore, in the process of maize planting, reasonably selecting improved varieties, and adjusting the ratio of nitrogen, phosphorus and potassium fertilizers to improve ear length, ear diameter, barren ear tip length, kernel number per ear and kernel weight is beneficial to increasing maize yield.
3.2 Interaction effect of nitrogen, phosphorus and potassium fertilizer application level
3.2.1Response of phosphorus and potassium fertilizers to nitrogen fertilizer. It can be seen from Fig.1 that at K2level, the yield of maize under low nitrogen and medium nitrogen treatments decreased with the increase of phosphorus fertilizer application rate (except N2level in MHQ). At N1level in MHQ, the yield of maize decreased by 1 116.7 kg/ha, while at N2level, it increased by 383.3 kg/ha. The yield of maize in HZY decreased by 283.3 and 175.0 kg/ha, respectively. At P2level, comparing low potassium and medium potassium treatment, the yield of maize in MHQ under medium nitrogen and low nitrogen treatments increased by 100.0 and 450.0 kg/ha, respectively, and it increased in HZY by 616.7 and 750.0 kg/ha, respectively.
3.2.2Response of nitrogen and potassium fertilizer to phosphorus fertilizer. It can be seen from Fig.2 that when the application rate of potassium fertilizer is at K2level, the yield of maize in MHQ at low phosphorus level decreased by 183.3 kg/ha, while the yield of maize at medium phosphorus level increased by 1 316.7 kg/ha with the increase of nitrogen application rate. At the low and medium phosphorus levels, the yield of maize in HZY increased by 708.3 and 816.7 kg/ha, respectively. When the application rate of nitrogen fertilizer was at N2level, comparing medium and low potassium levels, the yield of maize in MHQ under low phosphorus and medium phosphorus treatments increased by 516.7 and 100.0 kg/ha, HZY, respectively, while the yield of maize in HZY increased by 1 291.7 and 616.7 kg/ha, respectively. It can be seen that nitrogen fertilizer can promote the role of phosphorus fertilizer in increasing yield, and the yield at the medium nitrogen and medium potassium level was higher than in other treatments, which indicated that nitrogen fertilizer was beneficial to the exertion of phosphorus fertilizer effect.
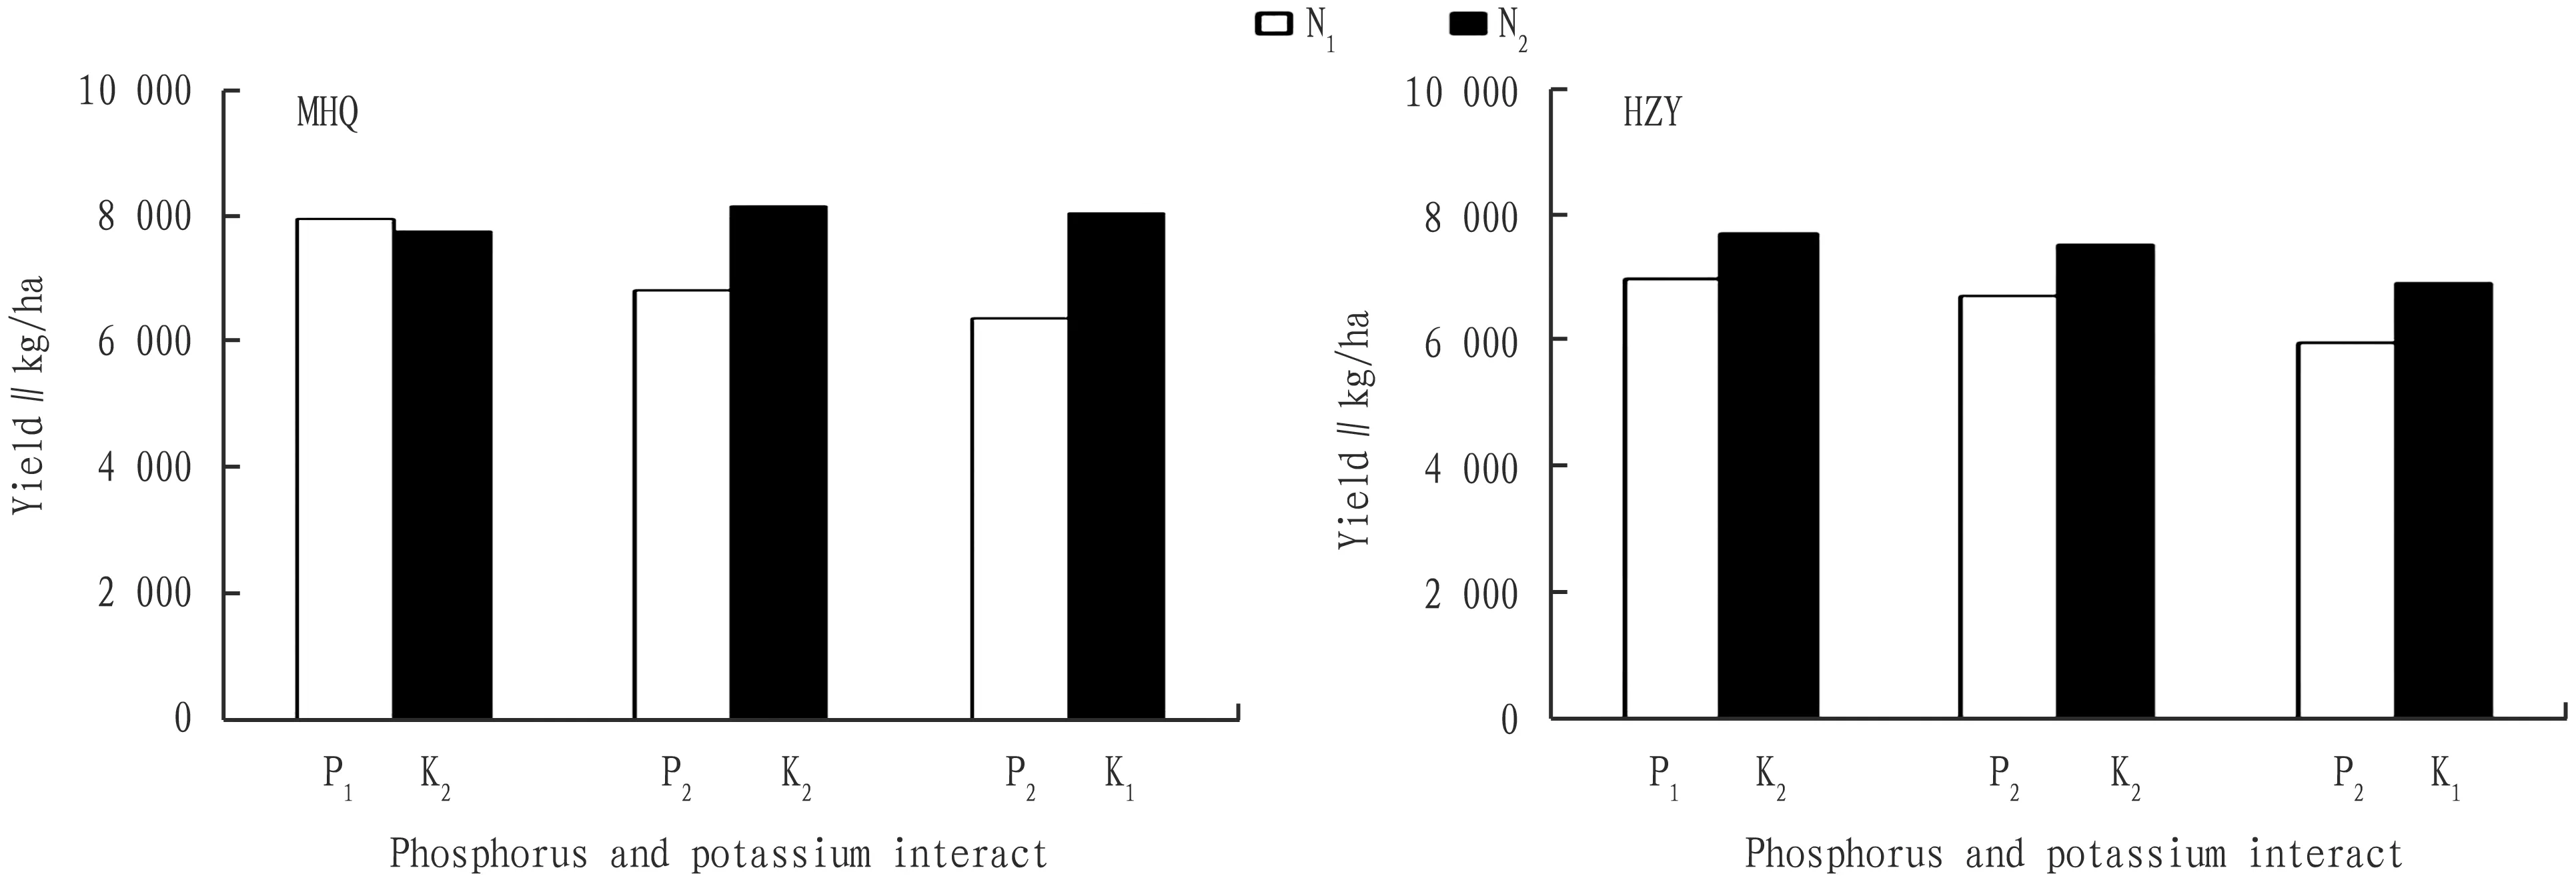
Fig.1EffectofdifferentPandKonN
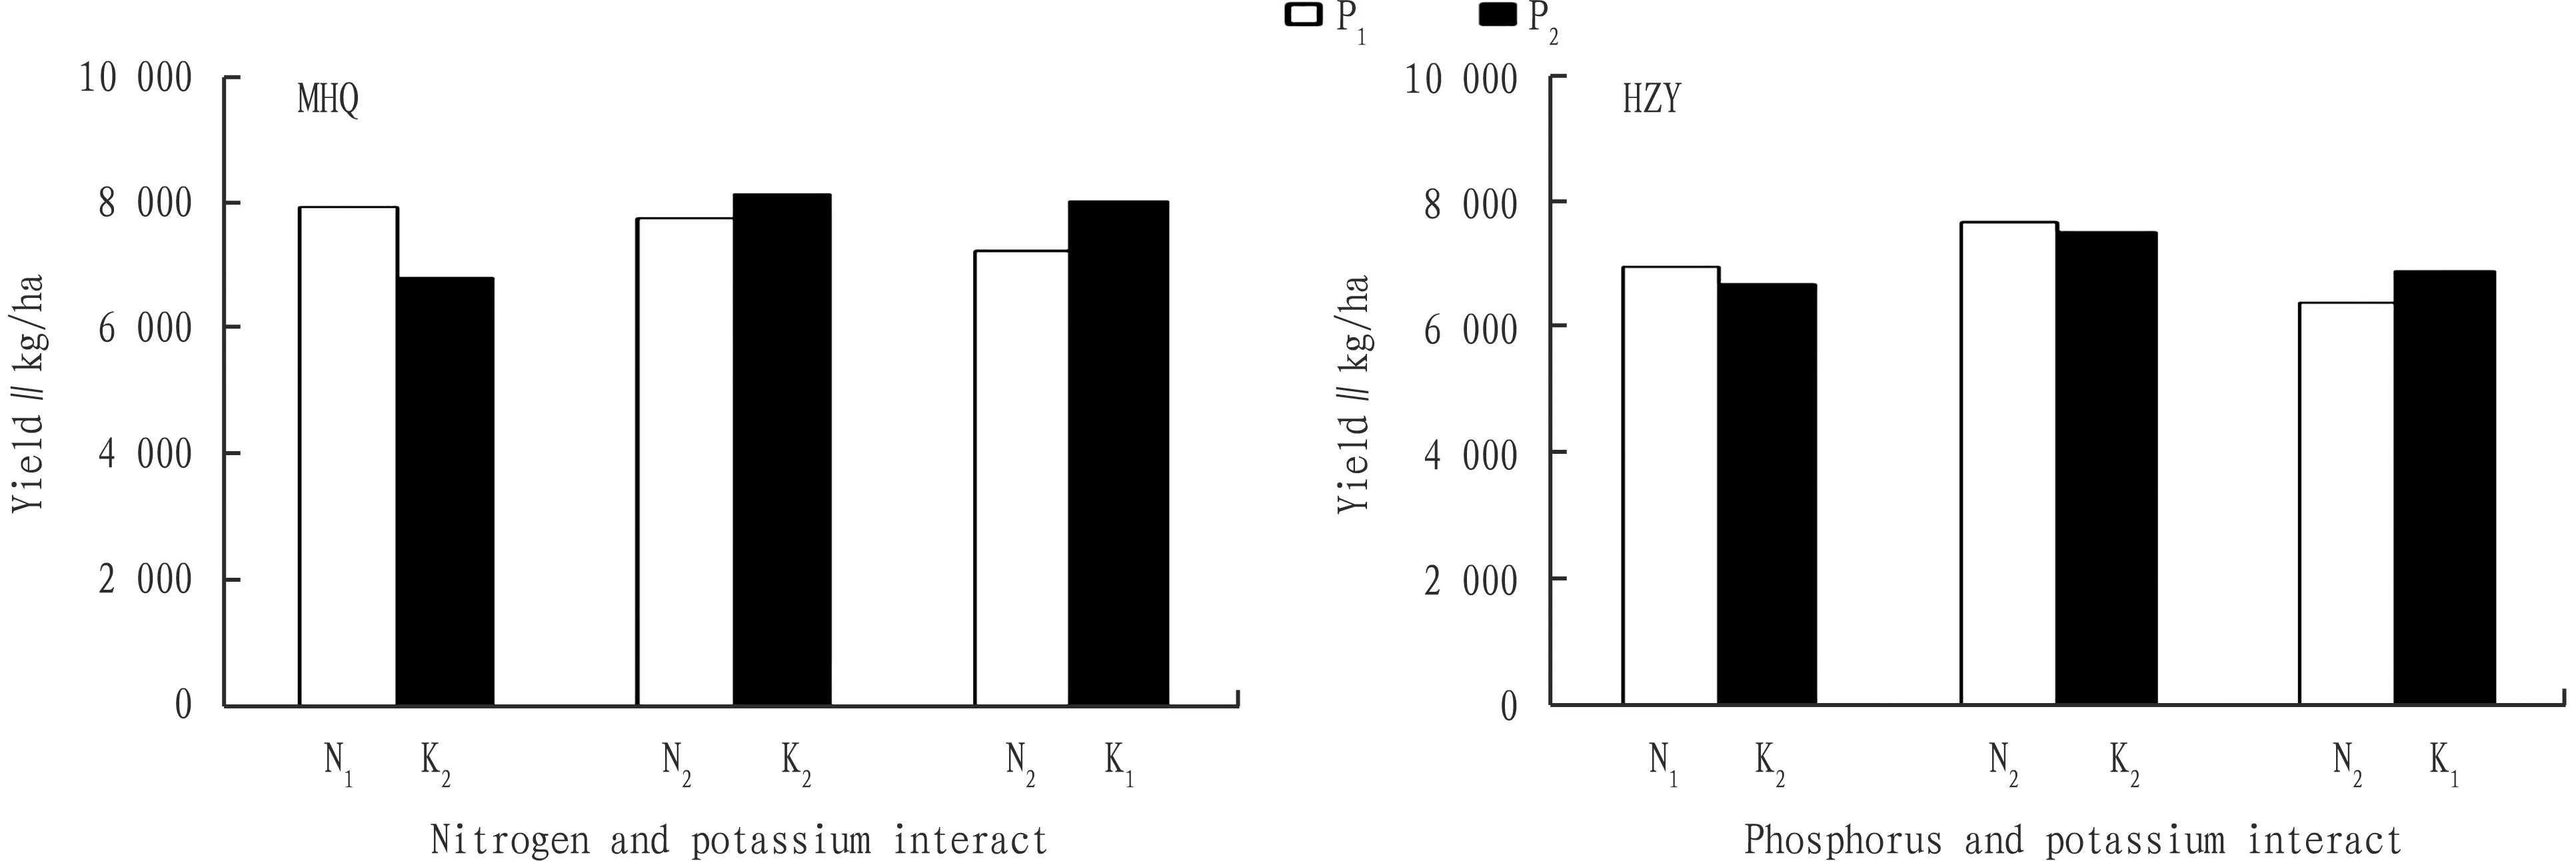
Fig.2EffectofdifferentPandKonN
3.2.3Response of nitrogen and phosphorus fertilizers to potassium fertilizers. From Fig.3, it can be seen that at the medium potassium and low potassium levels, the yield was the highest at medium nitrogen and medium phosphorus levels, which indicated that the efficiency of potassium fertilizer can be brought into full play by rational application of nitrogen and phosphorus fertilizer. When the amount of phosphorus fertilizer was at P2level, the maize yield in MHQ and HZY increased by 1 666.7 and 950.0 kg/ha under the treatment of low potassium and medium nitrogen. The maize yield in MHQ and HZY increased by 1 316.7 and 816.7 kg/ha under the treatment of medium potassium and medium nitrogen. When the application rate of nitrogen fertilizer was at N2, the yield of maize in MHQ and HZY increased by 800.0 and 500.0 kg/ha, respectively, comparing the medium and low phosphorus levels. The yield of maize in MHQ increased by 383.3 kg/ha, while the yield of maize in HZY decreased by 175.0 kg/ha under medium potassium treatment.
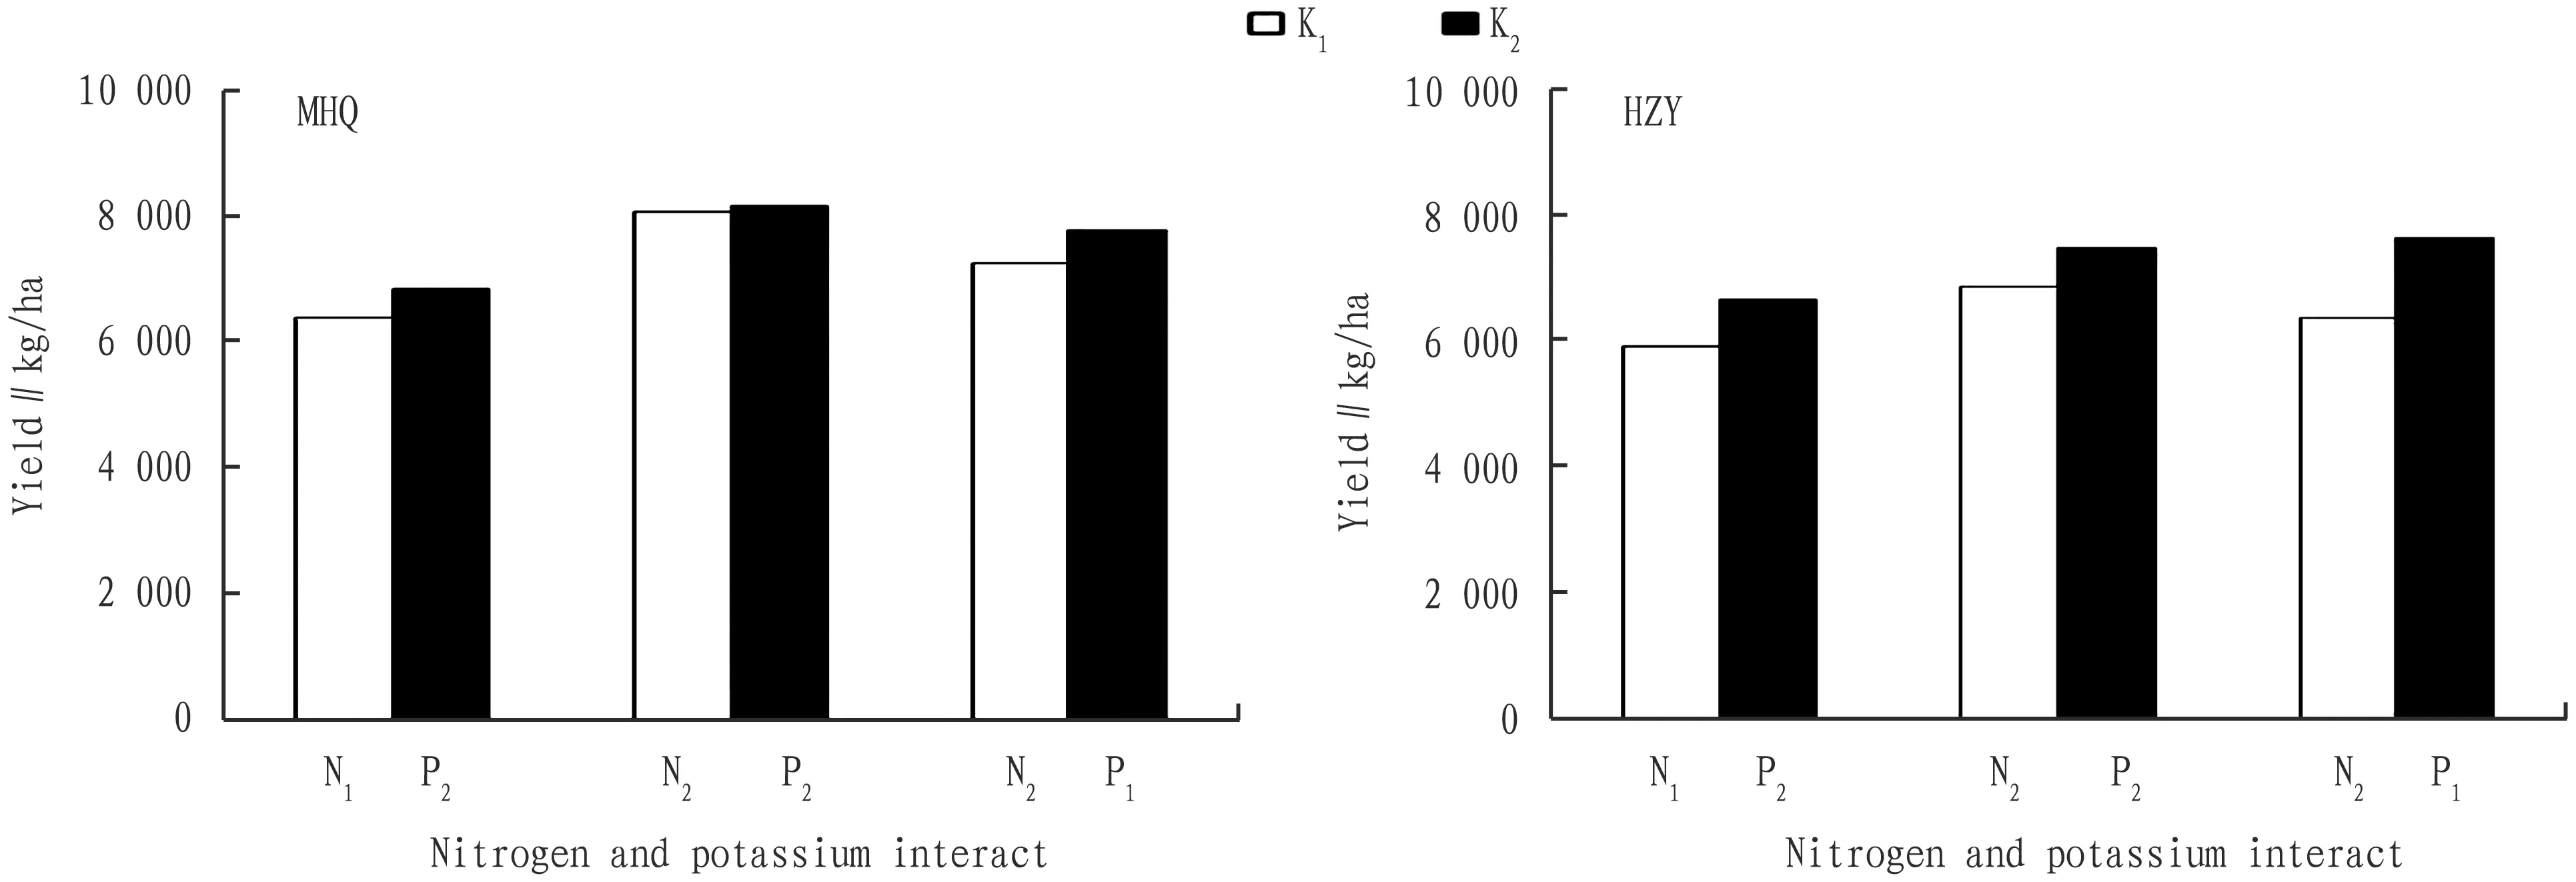
Fig.3EffectofdifferentNandPonK
3.3FertilizereffectmodelandrecommendedfertilizerapplicationrateIt can be seen from Table 5 that the ternary quadratic fertilizer function of N, P and K in MHQ plot has passed the significance test of regression equation, and the quadratic fertilizer effect function of N in HZY plot has passed the significance test of regression equation. Therefore, the ternary quadratic fertilizer function model of N, P and K and quadratic fertilizer effect function model of N were used as recommended fertilization models for maize in the two experimental plots, respectively. The application rate for the highest yield in MHQ plot was: N 410.6 kg/ha, P2O580.7 kg/ha and K2O 105.6 kg/ha. The corresponding yield was 8 114.8 kg/ha. The application rate for the highest yield in HZY plot was: N 419.7 kg/ha, P2O575 kg/ha and K2O 75 kg/ha. The corresponding yield was 7 599.3 kg/ha.
Table5Fittingequationoffertilizereffectfunction

PlotFactorExperiment numberEquationR2Maximum yield∥kg/haMHQN2, 3, 6, 11Y=-0.011X2N+10.7XN+5 476.90.988 131.4P4, 5, 6, 7Y=-0.096 7X2P+16.0XP+7 400.90.937 844.8K6, 8, 9, 10Y=-0.024X2K+5.9XK+7 853.40.918 216.8N-P-K1~14Y=4 995.4+5.8XN-0.011X2N-21.1XP-0.070X2P+52.8XK+0.038X2K+0.158XNXP-0.087XNXK-0.308XPXK0.99∗8 114.8HZYN2, 3, 6, 11 Y=-0.016X2N+13.5XN+4 766.31.00∗7 599.3P4, 5, 6, 7Y=-0.381X2P+55.6XP+5 816.80.917 844.8K6, 8, 9, 10Y=-0.31X2K+38.0XK+6 145.00.877 326.7N-P-K1~14Y=4 704.2+2.4XN-0.014X2N-10.5XP-0.232X2P+63.0XK-0.339X2K+0.161XNXP-0.027XNXK-0.125XPXK0.927 205.5
4 Conclusions and discussions
The quality and yield of maize are affected and restricted by the population structure of crop and many factors in the production process[10-11]. Fertilization has the most direct and rapid influence on it among many influencing factors. The rational combination of nitrogen fertilizer, phosphorus fertilizer and potassium fertilizer is not only helpful to the growth and morphogenesis of maize, but also helpful to establishing a good population structure, and significantly increasing crop yields[12]. The results showed that different maize varieties were planted in two experimental plots with different soil quality and fertility, and the changes of ear length, ear diameter, kernel number per ear, barren ear tip length and kernel weight were promoted by fertilizer application, and then the yield and net income of maize were affected. Correlation analysis also confirmed that maize yield was affected by ear length, ear diameter, kernel number per ear, barren ear tip length and kernel weight. Although the influencing factors are different, this may be related to the difference in variety and soil fertility factors.
Except that the yield, output value and income of maize increased with the increase of potassium application in MHQ plot, the yield, output value and income of the two maize varieties increased at first and then decreased with the increase of fertilizer application rate. The average yield increase rate of nitrogen fertilizer was 38.3% and 53.5%, respectively; the average yield increase rate of phosphorus fertilizer was 7.0% and 59.0%, respectively; the average yield increase rate of potassium fertilizer was 3.7% and 62.8%, respectively. Although the increase of nitrogen, phosphorus and potassium application rate showed the effect of increasing maize yield, the yield increase rate of maize in the two plots was quite different, which might be related to the soil fertility of the plot and maize varieties.
Overall, when fertilization exceeded a certain range, maize yield and economic effects will no longer increase, but have a downward trend. This accords with the law of diminishing return of fertilizer[13], which is consistent with the study of Niu Guiyuetal.[14-15].
The results showed that the fitting functions of the highest yield of the two maize varieties were different in the fitting of fertilizer effect in the two plots. The ternary quadratic fertilizer function model of N, P and K and quadratic fertilizer effect function model of N were used as recommended fertilization models for maize in the two experimental plots (MHQ and HZY), respectively. The application rate for the highest yield in MHQ plot was: N 410.6 kg/ha, P2O580.7 kg/ha and K2O 105.6 kg/ha. The corresponding yield was 8 114.8 kg/ha. The application rate for the highest yield in HZY plot was: N 419.7 kg/ha, P2O575 kg/ha and K2O 75 kg/ha. The corresponding yield was 7 599.3 kg/ha.
杂志排行
Asian Agricultural Research的其它文章
- Establishment and Optimization of Two-dimensional Electrophoresis System for Spleen Proteome of Sillago sihama Forsskål
- Breeding of a New Tussah Variety "Gaoyou 1"
- Study of the Discount on Private Placements and Risk of Stock Market Crash in Listed Companies
- Investigation and Analysis on Diversity of Lucanidae spp. in Fanjing Mountain National Nature Reserve
- Spatio-temporal Variability of Disastrous Convective Weather in China from 1961 to 2016
- Impact of Sino-US Trade Friction on Import and Export Trade Pattern of Soybean in Heilongjiang
