Accuracy of multi-echo Dixon sequence in quantification of hepatic steatosis in Chinese children and adolescents
2019-04-15YuZhenZhaoYunGenGanJianLiZhouJiaQiLiuWeiGuoCaoShuMeiChengDaMingBaiMengZhuWangFangQinGaoShaoMingZhou
Yu-Zhen Zhao, Yun-Gen Gan, Jian-Li Zhou, Jia-Qi Liu, Wei-Guo Cao, Shu-Mei Cheng, Da-Ming Bai,Meng-Zhu Wang, Fang-Qin Gao, Shao-Ming Zhou
Yu-Zhen Zhao, Jian-Li Zhou, Jia-Qi Liu, Da-Ming Bai, Shao-Ming Zhou, Department of Gastroenterology, Shenzhen Children's Hospital, Shenzhen 518038, Guangdong Province,China
Yun-Gen Gan, Wei-Guo Cao, Department of Radiology, Shenzhen Children's Hospital,Shenzhen 518038, Guangdong Province, China
Shu-Mei Cheng, Department of Physical Examination, Futian District Maternity and Child Healthcare Hospital, Shenzhen 518048, Guangdong Province, China
Meng-Zhu Wang, Department of MR Scientific Marketing, Siemens Healthineers, Guangzhou 510620, Guangdong Province, China
Fang-Qin Gao, Department of MR Clinical Marketing, Siemens Healthineers, Guangzhou 510620, Guangdong Province, China
Abstract BACKGROUND Nonalcoholic fatty liver disease (NAFLD) is currently the outstanding cause of chronic liver disease in children and adolescents, especially in overweight and obese groups. Liver biopsy is the reference standard to diagnose NAFLD but invasive, thus it is not the best choice in clinical diagnosis and follow-up.Magnetic resonance (MR) is widely used in clinical trials to noninvasively quantify liver fat content in adults and children in foreign countries. While currently, it is rarely used in Chinese children and adolescents. We postulated that quantifying hepatic steatosis by MR could be extended to children and adolescents in China.AIM To investigate the accuracy of MR imaging (MRI) in quantifying liver fat with MR spectroscopy (MRS) as a reference. A secondary goal was to assess the prevalence of NAFLD in overweight and obese Chinese children and adolescents.METHODS There were 86 children and adolescents enrolled in this study, including 65 overweight and obese children and 21 healthy children. The participants underwent MRI and MRS. MRI and MRS were performed using multi-echo Dixon and HISTO sequences, respectively, to calculate hepatic proton density fat fraction (PDFF). Hepatic steatosis was diagnosed using MRS-PDFF > 5% as the threshold. Spearman's analysis was used to evaluate the correlation between MRI and MRS. The agreement between these two methods was assessed by Bland-Altman analysis.RESULTS The MRI-PDFF in the MRS region of interest and the entire liver was 9.9% ±10.3% with a range of 0.3%-39.9%, and 10.6% ± 9.4% with a range of 1.9%-38.9%,respectively. The MRS-PDFF was 9.1% ± 10.0%, with a range of 0.5%-37.8%. The incidence of hepatic steatosis detected by MRS-PDFF was 46.5% (40/86) of all participants, all of whom belonged to the overweight and obese group.Spearman's analysis indicated an excellent correlation between multi-echo Dixon and MRS (r > 0.9, P<0.01). Bland-Altman analysis also demonstrated a good agreement between these two methods.CONCLUSION Multi-echo Dixon shows an excellent correlation and agreement with MRS in quantifying liver fat content and could be a potential tool to detect hepatic steatosis in Chinese children and adolescents.
Key words: Nonalcoholic fatty liver disease; Magnetic resonance imaging; Magnetic resonance spectroscopy; Children and adolescents; Hepatic steatosis
INTRODUCTION
Nonalcoholic fatty liver disease (NAFLD) is the outstanding cause of chronic liver disease in children, especially in overweight and obese groups. The characteristic manifestation of NAFLD is the deposit of fat within more than 5% of hepatocytes, that is, hepatic steatosis. Steatosis may develop into nonalcoholic steatohepatitis, cirrhosis,or hepatocellular carcinoma. NAFLD is also a risk factor for liver transplantation and chronic kidney disease[1-3]. A study by the World Health Organization indicated that,over the past four decades, the number of obese children and adolescents around the world has increased 10 times, and that this number reached 124 million in 2016[4]. A meta-analysis by Andersonet al[5]demonstrated that the prevalence of NAFLD in general children was 7.6%, while it was 34.2% in obese children. Researchers have found that lifestyle intervention and weight loss can reduce liver fat content[6,7].Therefore, early diagnosis of NAFLD is very important.
Liver biopsy is the reference standard for diagnosing NAFLD, but it is invasive and sample limited, which may lead to misdiagnosis[8,9]. For children, it is difficult to tolerate the operation and the required sedation. Therefore, there is an urgent need for a noninvasive method to diagnose NAFLD in clinical work. Ultrasonography (US) is currently the primary imaging method to detect hepatic steatosis because it is cheap,does not require radiation exposure, and is easily available. However, US cannot quantify liver fat content and has a poor sensitivity and specificity for diagnosing mild steatosis. Based on the ratio of Hounsfield units of liver and kidney parenchyma,computed tomography (CT) can detect steatosis quickly and reproducibly. The major drawbacks of CT are radiation exposure and poor diagnostic accuracy for mild hepatic steatosis.
In recent years, magnetic resonance imaging (MRI) and magnetic resonance spectroscopy (MRS) have become accurate methods to quantify liver triglyceride concentration based on the difference in the resonant frequencies of water and fat[10].MRS is thought to be the noninvasive gold standard in the quantification of hepatic steatosis. As early as 2005, Szczepaniaket al[11]used MRS as a reference to diagnose NAFLD in a large group of people. Then, some studies were performed using MRI to quantify liver fat content with MRS as reference and demonstrated equivalent accuracy to MRS[12-16]. In addition, further research validated the accuracy of MRI and MRS. Studies performed by Kukuket al[17]and Kanget al[18]using multi-echo Dixon(ME Dixon), MRS, and liver biopsy indicated excellent correlations in the quantification of liver fat between these methods. Kanget al[18]also found that the correlation in the right lobe was higher than that in the left lobe. Satkunasinghamet al[19]conducted a retrospective study on liver donor candidates with liver biopsy as a reference; the researchers demonstrated a significant correlation (r= 0.83) between ME Dixon and MRS (HISTO), and they showed that these two methods could obviate the need for liver biopsy when proton density fat fraction (PDFF) was<5%.Furthermore, Bannaset al[20]performed MRI, MRS, liver biopsy, and biochemical triglyceride extraction onex vivohuman livers that were unsuitable for transplantation. These authors found that MRI showed a strong correlation with MRS, liver biopsy, and biochemical triglyceride extraction (r= 0.984, 0.850, and 0.871,respectively). Researchers in China also demonstrated that PDFF assessed by ME Dixon was highly correlated with MRS (HISTO) in adults[21]. Therefore, both MRI and MRS are accurate methods to quantify liver fat content, and liver biopsy may be obviated.
In recent pediatric studies, MRI also showed strong correlations with biopsy and MRS in the quantification of liver fat[22-25]. However, emerging confounder-corrected quantitative ME Dixon and HISTO methods have rarely been used in Chinese children and adolescents. The aim of the present study was to investigate the accuracy and agreement of ME Dixon in quantifying liver fat with MRS as a reference in Chinese children. A secondary goal was to assess the prevalence of NAFLD in overweight and obese children and adolescents.
MATERIALS AND METHODS
Subjects
The present study was approved by the Human Ethics Committee of Shenzhen Children's Hospital. All parents were told about the aims and methods of the study and signed an informed consent form. Eighty-six participants were enrolled in the study from August 2017 to July 2018. All participants attended local middle school of Shenzhen, China. Among them, 65 participants were overweight and obese children[body mass index (BMI) above age- and gender-specific 85th/95th percentile], and 21 were age- and sex-matched healthy children. Their ages ranged from 9 to 17 years,with an average age of 13.6 years. The inclusion criteria of the overweight and obese children were no drinking history or alcohol consumption of less than 210 g per week for males, and less than 140 g per week for females, and BMI exceeding the classification criteria established by the Working Group on Obesity in China[26]. The inclusion criteria for the control group were that the BMI index and serum aminotransferase were normal. The exclusion criteria included type 1 diabetes, druginduced hepatitis, hepatitis virus infection, hepatolenticular degeneration, chronic liver disease, or other chronic diseases that did harm to hepatic or renal function,alcohol consumption greater than the amounts mentioned above, contraindications of MRI including metallic implants, claustrophobia and so on. Age, sex, height, weight,BMI, and a brief survey of personal lifestyle habits and family medical history were recorded.
MRI
All patients underwent MRI scanning performed by an experienced technologist using a 3 Tesla MR unit (MAGNETOM Skyra, Siemens Healthcare, Erlangen,
Germany). Before scanning, a simple breath-hold training was performed by the participants. Coronal and transversal T2-weighted images were acquired to initially assess whether there were any imaging changes in the upper abdominal organs,especially the liver. MRI and MRS were conducted using ME Dixon and HISTO sequences, respectively, to calculate hepatic PDFF.
MRI examination
Multi-echo gradient echo sequences (ME Dixon; Siemens Healthcare, Erlangen,Germany) and online reconstruction (VIBE-Dixon; Siemens Healthcare, Erlangen,Germany) were performed with T2* correction[14,27]. A low flip angle (4°) was used to minimize the effects of T1 weighting[28,29]. In a 13 s breath-hold, six fractional echo magnitude images were acquired at 1.05, 2.46, 3.69, 4.92, 6.15, and 7.38 ms of echo times (TE). The repetition time (TR), section thickness, field of view, and voxel size were 9.00 ms, 3.5 mm, 450 mm, and 1.4 mm × 1.4 mm × 3.5 mm, respectively. The center of the liver, coil, and magnetic field were aligned before scanning. Screening Dixon (dual-echo VIBE-Dixon; Siemens Healthcare, Erlangen, Germany) and ME Dixon sequences were performed sequentially. The screening Dixon sequence was used to roughly and rapidly measure the liver fat fraction in patients. The TE, TR,field of view, flip angle, and section thickness of screening Dixon were 1.29 ms, 3.97 ms, 380 mm, 9° and 3 mm, respectively.
MRS examination
As a reference, we performed single-voxel MRS called HISTO with stimulated echo acquisition mode (STEAM). In addition, high-speed T2 correction was used to prevent over-evaluating PDFF, as the T2-decay of water and fat are different[28]. During a single 15 s breath hold, five STEAM spectra were generated at 12, 24, 36, 48, and 72 ms of TE. To minimize the effects of T1 weighting, a TR of 3000 ms was used. The flip angle was 90°, and a 15 mm × 15 mm × 15 mm region of interest (ROI) was placed on the largest surface of the right hepatic lobe (Couinaud segments V-VIII), avoiding major vessels and bile ducts.
Image processing
MRI: The images were analyzed by an experienced MR physicist and reanalyzed by a deputy chief physician (all of them were unaware of the clinical/MRS data). Water images, fat images, goodness of fit images, MRI-PDFF maps and reports of screening and ME Dixon were acquired automatically. The results of the screening scan were defined as normal, and fat infiltration was defined according to a cut-off value of 5%.We evaluated the quality of the image on the goodness of fit images (goodness of fit =mean value/10,<5% indicating that the images were acceptable). A 15-mm diameter circular ROI was colocalized with the MRS voxel on the corresponding PDFF map.The results of the screening Dixon, and PDFF values of the ROI and the entire liver were recorded.
MRS: After scanning, the system automatically went into postprocessing using the prototype software package (Siemens Healthcare, Erlangen, Germany). Peak amplitudes of water and fat at each TE were calculated with an exponential leastsquares fitting algorithm. MRS-PDFF was estimated automatically based on the ratio of areas under fat peaks to the sum of areas under water and fat peaks. The spectral maps, water and fat peak curves, and PDFF values were recorded.
Statistical analysis
Statistical analyses were performed using SPSS 22.0 software. Subjects' PDFF values are summarized as the mean ± standard deviation. Differences in MRI-PDFF and MRS-PDFF were evaluated using the Wilcoxon matched-pairs signed-rank test.Spearman's analysis was used to evaluate the correlation between MRI and MRS. The agreement between these two methods was assessed by Bland-Altman analysis.According to the liver classification results of MRS-PDFF, the sensitivity, specificity,positive predictive value (PPV), and negative predictive value (NPV) were calculated to assess the diagnostic accuracy of MRI-PDFF. To assess the accuracy and find the optimal threshold, a receiver operating characteristics (ROC) curve was generated. AP-value<0.05 indicated statistical significance.
RESULTS
Characteristics of su bjects
Participants were children and adolescents (mean age 13.6 ± 1.9 years, range 9-17 years) with a mean BMI of 26.3 ± 5.3 kg/m2(range 16.6-38.0 kg/m2). The characte-ristics of the participants are shown in Table 1. The MRI-PDFF in the MRS ROI and the entire liver was 9.9% ± 10.3% with a range of 0.3%-39.9%, and 10.6% ± 9.4% with a range of 1.9%-38.9%, respectively. The MRS-PDFF was 9.1% ± 10.0%, with a range of 0.5%-37.8%. The MRS-PDFF and MRI-PDFF measured with ROI corresponding to the MRS voxel were not significantly different (P= 0.384). However, the MRS-PDFF was significantly lower than the MRI-PDFF measured with the entire liver (P= 0.038).Four groups of typical MRI-PDFF maps and matching MRS with varying percentages of PDFF values are presented in Figure 1.
Correlation and agreement of liver fat content measurements by MRI and MRS
MRI-PDFF and MRS-PDFF values of all subjects were assessed by Spearman's analysis. The results indicated an excellent correlation between MRI and MRS (r=0.973,P<0.01 when MRI-PDFF was measured with ROI corresponding to the MRS voxel;r= 0.929,P<0.01 when MRI-PDFF was measured with the entire liver) (Figure 2). Bland-Altman analysis demonstrated a good agreement between these two methods with few outliers [bias 0.126%, 95% confidence interval (CI) (-2.513, 2.765),when MRI-PDFF was measured with ROI corresponding to the MRS voxel; bias -0.395%, 95%CI (-4.543, 3.753), when MRI-PDFF was measured with the entire liver](Figure 3).
Diagnostic performances of MRI with MRS as the reference standard
Hepatic steatosis was detected based on MRS-PDFF > 5% in 46.5% (40/86) of all participants and in 61.5% (40/65) of the overweight and obese group. With MRSPDFF as a reference, the sensitivity, specificity, PPV, and NPV of MRI-PDFF were 95%, 100%, 100%, and 94.9%, respectively, based on the ROI at the same location as MRS, and they were 97.5%, 88.6%, 90.7%, and 96.9%, respectively, when covering the entire liver. For screening Dixon, 10 participants were diagnosed with steatosis, while the MRI-PDFF and MRS-PDFF values were lower than 5%.
Analysis of optimal MRI-PDFF threshold
An ROC analysis was conducted to evaluate the diagnostic efficiency of MRI-PDFF for hepatic steatosis, with MRS-PDFF as a reference (Figure 4). MRI-PDFF was demonstrated to be a good predictor of steatosis with an area under the curve (AUC)of 0.991 (95%CI 0.977-1.00) based on an ROI corresponding to the MRS voxel, and an AUC of 0.981 (95%CI 0.958-1.00) based on the entire liver. According to the Youden index, the optimal MRI-PDFF threshold to detect hepatic steatosis was 5.1%, with a sensitivity and specificity of 95% and 100%, respectively, when MRI-PDFF values were measured with an ROI corresponding to the MRS voxel. Analogously, the optimal threshold for detecting hepatic steatosis was 5.4%, with a sensitivity and specificity of 95% and 91.4%, respectively, when MRI-PDFF values were measured with the entire liver.
DISCUSSION
In this observational study of Chinese children and adolescents, 3T MRI with an ME Dixon sequence accurately quantified liver fat content, with MRS (HISTO sequences)as a reference. This study indicates that quantifying hepatic steatosis by MRI in adults could be extended to children and adolescents[16,30]. These data demonstrate the feasibility and potential clinical utility of MRI in quantifying steatosis in children. In the present study, the prevalence of NAFLD was 46.5% among all subjects and 61.5%in overweight and obese children. The prevalence in our study is higher than 34.2%, a value reported in a meta-analysis by Andersonet al[5]. This may be due to differences in age, sex, race, region, and BMI. Additionally, studies with different diagnostic methods were enrolled in the meta-analysis. As steatosis, especially NAFLD, is closely related to atherosclerosis, chronic kidney disease, and changes in myocardial function[2,31,32], the present results are meaningful for the early diagnosis and prevention of NAFLD.
PDFF measured by ME Dixon and MRS had been validated as an accurate assessment of liver fat content that demonstrates an excellent correlation with liver biopsy[18]. In our study, we observed a strong correlation between MRI-PDFF and MRS-PDFF. Bland-Altman analysis also indicated a good agreement between these two methods. These findings are consistent with those of previous studies[16,30],indicating that the Dixon-based technique could be a potentially useful tool to quantify liver fat content for whole liver coverage.
With MRS-PDFF > 5% differentiating hepatic steatosis from normal fat fractions in our study, MRI achieved a good sensitivity and specificity in quantifying liver fat content. Moreover, MRI showed good potential as a tool for the early detection ofhepatic steatosis. With MRS-PDFF > 5% as the cut-off value, the optimal thresholds for MRI-PDFF were 5.1% and 5.4%, when MRI-PDFF was measured with ROI and the entire liver, respectively. Research by Rehmet al[12]suggested that MRI-PDFF thresholds should be 3.0% and 3.5% for detecting steatosis with two metabolic syndrome criteria, which is in agreement with studies by Di Martinoet al[25]and Nasret al[33]. A lack of laboratory markers and liver biopsies are the main reason for the difference between previous studies and ours. Hence, further studies are needed to validate the optimal threshold of MRI-PDFF.

Table 1 Characteristics of the 86 participants
Compared with MRS, there were several advantages to using multi-echo MRI techniques in the quantification of hepatic steatosis in our study. First, MRI can quantify liver fat content of the entire liver in addition to ROI, thereby avoiding sampling errors when liver fat is inhomogeneously distributed. Second, there is no spatial error, as in-phase and opposed-phase images are acquired at the same time.Third, MRI is widely used, while the availability of MRS is limited. Although a previous study demonstrated that the best method to measure MRI-PDFF was calculating the average value of ROI in nine Couinaud segments[34], the MRI-PDFF of this study was measured with ROI only at the MRS location and the entire liver. A segmented measurement could be considered in future studies.
An advantage of the present study is the enrollment of relatively healthy children and adolescents for MRI and MRS. A limitation is that we did not perform liver biopsy. In previous MRI studies, known or suspected liver disease patients were enrolled. Therefore, liver biopsy was conducted for further diagnosis[17,18]. The aim of our study was to evaluate the accuracy of MRI in the quantification of hepatic steatosis in Chinese children and adolescents. Another goal was to assess the prevalence of NAFLD in the pediatric population. It is unethical to subject relatively healthy participants to liver biopsy evaluation. Furthermore, MRS could not acquire images during the breath-hold time, and a physicist was needed to conduct complex post-processing with specific analysis software[16,35]. However, the HISTO sequence we performed in the present study allowed rapid and simple processing for image acquisition in a single 15 s breath hold[27,36]. In addition, both MRI and MRS assess liver triglyceride content by the relative volume of fat protons. Therefore, MRI-PDFF and MRS-PDFF can be directly compared with each other, while liver biopsy evaluates the number of cells with intracellular fat but not volume. Therefore, we chose MRS rather than histologic examination as a reference.
The second limitation is that MRI segmentation in screening Dixon is sometimes not accurate. Muscles, major vessels, gallbladder, stomach, or kidneys may be included. Moreover, we cannot correct this manually, which may affect the accuracy of fat content measurements of the entire liver. This is one of the reasons why MRIPDFF of ROI and the entire liver are different in our study. Another reason is sampling errors of ROI when hepatic fat infiltration is heterogeneous. This phenomenon may also occur in single-voxel MRS measurements.
The third limitation is the lack of serum metabolic markers. Studies have found that NAFLD is associated with serum lipid, liver enzyme, glucose, and insulin levels[12,37].However, we did not collect blood samples from the participants to assess these risk factors. Further studies are needed to evaluate the correlation of these risk factors and liver fat content.
In conclusion, the present study demonstrates the accuracy of ME Dixon in the quantification of hepatic steatosis in Chinese children and adolescents, which showed an excellent correlation and agreement with MRS. The high prevalence of NAFLD in overweight and obese children is worthy of our attention.
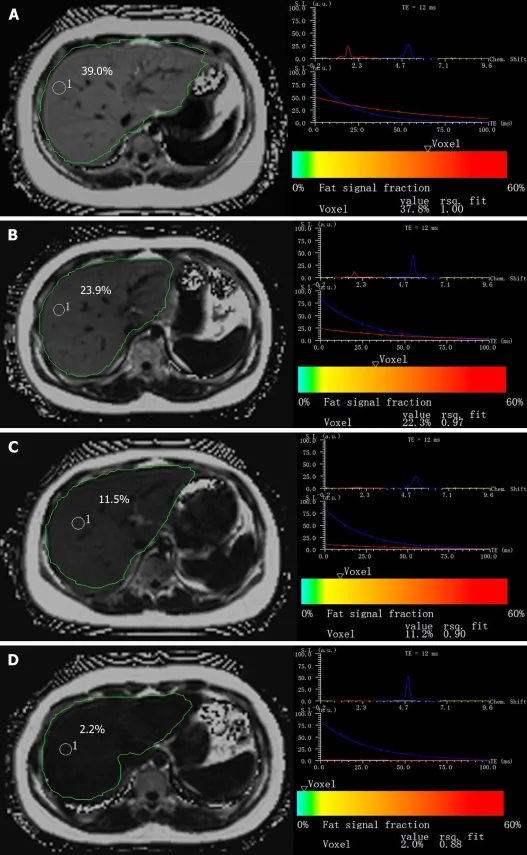
Figure 1 Examples of the multi-echo Dixon (left) and magnetic resonance spectroscopy (right) in four different participants with different percentages of proton density fat fraction values. A: Participant 1 has a high value of proton density fat fraction (PDFF) of 39.0% measured by multi-echo Dixon (ME Dixon) (left)and 37.8% by magnetic resonance spectroscopy (MRS) (right); B: Measurements in participant 2 show a fat fraction of about 23.9% in ME Dixon (left) and 22.3% by MRS (right); C: In participant 3, ME Dixon (left) demonstrates a liver fat content of about 11.5% and MRS (right) shows a measurement of 11.2%; D: ME Dixon (left)and MRS (right), respectively, assess a fat fraction of about 2.2% and 2.0% in participant 4; The manual measurements of the region of interest are shown in the MRIPDFF maps (left). The spectrum of MRS for the first acquired echo times and T2 exponential decay and the estimated fat fractions (below the colored bar) are shown(right). ME Dixon: Multi-echo Dixon; MRS: Magnetic resonance spectroscopy; PDFF: Proton density fat fraction.
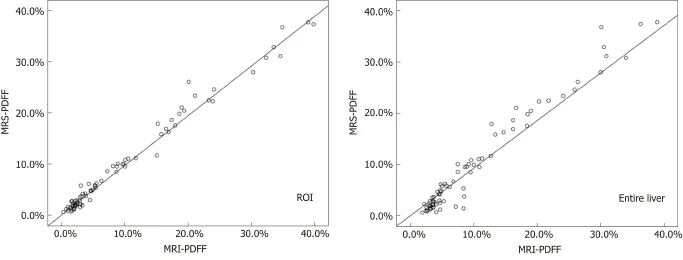
Figure 2 Scatter plots displaying the results of magnetic resonance spectroscopy proton density fat fraction and magnetic resonance imaging protondensity fat fraction based on the region of interest (left) and the entire liver (right). MRS: Magnetic resonance spectroscopy; PDFF: Proton density fat fraction;ROI: Region of interest; MRI: Magnetic resonance imaging.
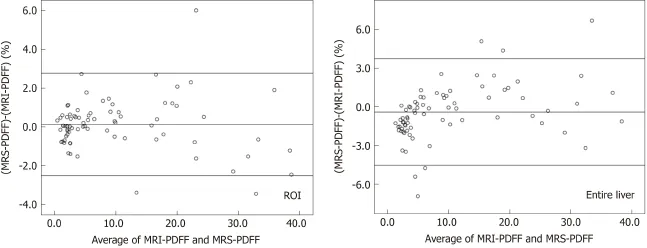
Figure 3 Bland-Altman analysis between magnetic resonance spectroscopy proton density fat fraction and magnetic resonance imaging proton density fat fraction based on the region of interest (left) and the entire liver (right). MRS: Magnetic resonance spectroscopy; PDFF: Proton density fat fraction; ROI: Region of interest; MRI: Magnetic resonance imaging.
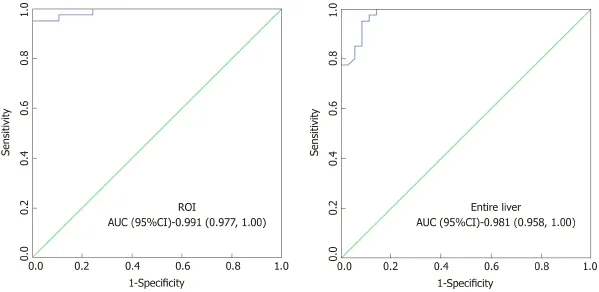
Figure 4 Receiver operating characteristics analysis of magnetic resonance imaging proton density fat fraction, with magnetic resonance spectroscopy proton density fat fraction as a reference. ROI: region of interest; AUC: Area under the curve; CI: Confidence interval.
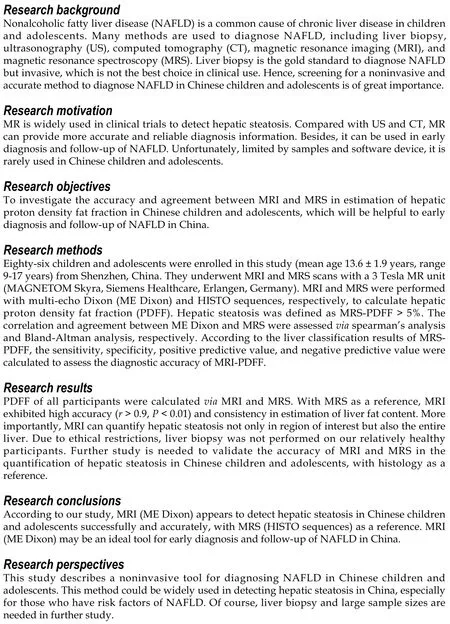
ARTICLE HIGHLIGHTS
ACKNOWLEDGEMENTS
The authors thank all staff for excellent work and the clinical screening facility at Radiology Department, Shenzhen Children's Hospital, Shenzhen, China. All MR scans were performed using a 3 Tesla MR unit.
杂志排行
World Journal of Gastroenterology的其它文章
- International consensus statement on robotic hepatectomy surgery in 2018
- Growing burden of alcoholic liver disease in China: A review
- ?Esophageal diverticulum: New perspectives in the era of minimally invasive endoscopic treatment
- Gut microbiota profile in healthy Indonesians
- Ursodeoxycholic acid ameliorates hepatic lipid metabolism in LO2 cells by regulating the AKT/mTOR/SREBP-1 signaling pathway
- Risk factors for local recurrence and appropriate surveillance interval after endoscopic resection
