Study of heat transfer by using DEM-CFD method in a randomly packed pebble-bed reactor
2019-02-27QiangNiuNaXiuWang
Qiang Niu·Na-Xiu Wang
Abstract The pebble-bed reactor is one of the most promising designs for the nuclear energy industry.In this paper,a discrete element method-computational fluid dynamics(DEM-CFD)approach that includes thermal conduction,radiation,and natural convection mechanisms was proposed to simulate the thermal- fluid phenomena after the failure of forced circulation cooling system in a pebble-bed core.The whole large-scale packed bed was created using the DEM technique,and the calculated radial porosity of the bed was validated with empirical correlations reported by researchers.To reduce computational costs,a segment of the bed was extracted,which served as a good representative of the large-scale packed bed for CFD calculation.The temperature distributions simulated with two different fluids in this DEM-CFD approach were in good agreement with SANA experimental data.The in fluence of the natural convection mechanism on heat transfer must be taken into account for coolants with strong convective capacity.The proposed DEM-CFD methodology offers a computationally ef ficient and widely applied method for understanding the heat transfer process in a pebble-bed core.The method can also be easily extended to assess the passive safety features of newly designed fluoride-salt-cooled pebble-bed reactors.
Keywords Discrete element method·Computational fluid dynamics·Pebble bed ·Heat transfer·Natural convection
1 Introduction
The pebble-bed-type high-temperature gas-cooled reactor(HTGR)was one of the six innovative nuclear reactor concepts presented at the Generation IV International Forum,which aims to provide more sustainable,safer,and economical reactor technology for the future.As a promising option,HTGR exhibits inherent safety features owing to its low power density,negative reactivity,and large amount of spherical pebbles packed in the core that gives the reactor a relatively large thermal inertia capacity[1].In general,if the reactor is designed properly,the safety features ensure that the reactor can be shut down by negative temperature feedback without any active cooling systems as well as maintain the local temperature below 1600°C,the maximum allowable value above which the fuel failure fraction exceeds 10-5[2].However,it must still be proven that the residual heat can be removed after a depressurized loss-of-forced-circulation accident(DLOFC),which is considered the most severe accident scenario.In this kind of situation,the primary circuit pressure of the reactor decreases to atmospheric pressure and forced coolant is stopped.Then,the decay heat is partially removed by the mechanisms of conduction,radiation,and natural convection while the rest are stored in the pebbles.This accident could threaten the integrity of the pebbles and result in the release of fission products to the environment.Therefore,the ability to reliably simulate the thermal-hydraulic characteristics in a DLOFC accident is of great importance for the design and operation of HTGR.Moreover,the recent development of fluoride-salt-cooled high-temperature reactor(FHR),which has a similar design as the pebble-bed core,has given rise to the need to develop an approach to investigate the pebble-bed phenomena for widespread applications.
A literature survey showed two main approaches for the simulation of packed pebbles:the porous media approach and realistic approach.In the porous media approach,the pebbles and pores are treated implicitly as a homogenized region.Rooyen et al.[3]demonstrated that the porous media approach could accurately predict flow,pressure,and temperature distributions.Du Toit[4]adopted the approach to investigate natural convective heat transfer by simplifying thepacked bed into atwo-dimensional axisymmetric coordinate system.Baggemann[5]used the porous media model to validate a self-developed HTGR code.
With the dramatic progress in computational capacity,many researchers have adopted a pore-scaled realistic approach that allows the simulation of a packed bed by taking into account the position of each sphere and its in fluence on flow.Calis et al.[6]investigated the flow and heat transfer in structured packed beds of spheres with the help of computational fluid dynamics(CFD)and demonstrated that packing forms have remarkable effects on macroscopic flow and heat transfer characteristics.Dixon et al.[7]systematically investigated different contact point modi fication techniques and recommended the use of the bridges method for numerical simulation of heat transfer.Ferng and Lin[8]studied the effects of body-centered cubic and face-centered cubic arrangements on the thermal-hydraulic characteristics in HTGR.Song et al.[9]adopted a similar structured geometry to analyze the local flow and pebble surface temperature distributions in several default conditions in an FHR.Merrikh and Lage[10]studied natural convection in a differentially heated square enclosure filled with discrete conducting square solid blocks.
For the randomly packed pebble-bed core,Zhao et al.[11]conducted a numerical study of stationary and moving pebbles by means of discrete element method(DEM).The results demonstrate that DEM modeling is a feasible approach for pebble-bed design and safety assessment.Mohanty et al.[12]studied flow with different diameter ratios by DEM-CFD coupling.The results indicated that DEM-CFD simulation can predict flow behavior in a packed bed quite satisfactorily without the need to carry out experiments.Singhal et al.[13]investigated the heat transfer characteristics in a densely packed particle bed and con firmed that no transient velocity fluctuations occurred within the narrow channels created by realistic packing,thereby allowing the use of less computationally costly steady-state simulations.
As stated above,the porous media approach has been used to design packed beds because of its computational ef ficiency.However,this approach does not consider the solid phase as made up of discrete particles,but only as an effective phase with a de fined void fraction value.In order to meet our current objective of accurately characterizing the decay heat removal process,this approach may not be suitable.On the other hand,the realistic approach is promising and feasible approach to simulate coupled natural convective heat flow and thermal radiation in randomly packed beds,but this kind of work is rare.
Thus,a systematic and widely applied realistic approach that includes CFD and DEM is proposed in this paper.The remainder of the paper is organized as follows.Section 2 introduces the SANA test facility and describes the experimental database which will be used to validate the developed simulation method.This is followed by detailed descriptions of the methodology including numerical randomly packed-bed generation by DEM,and mesh and CFD setup in Sect.3.Validation results and distribution characteristics in the pebble-bed are presented in Sect.4.Finally,some concluding remarks are provided in Sect.5.
2 Description of the benchmark:SANA experimental database
In developing the simulation method,a benchmark that can be used to validate the numerical results plays an important role.Fortunately,a series of experiments were conducted at the SANA(abbreviation of the German words for Secure Decay Heat Removal)test facility in the nineties to research heat transfer in randomly packed pebble-bed,and the experimental data were made available to the public.The schematic plan and temperature measurement points of SANA are shown in Fig.1.
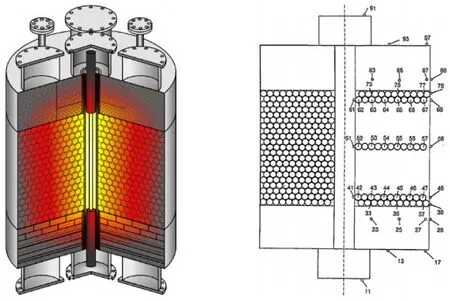
Fig.1(Color online)Schematic of SANA(left)and arrangement of the thermocouples(right)taken from Ref.[14]
The apparatus has a central heating element with a diameter of 0.13 m,which is symmetrically distributed in the pebble bed,and an outer cylindrical diameter of 1.5 m.Inside the steel vessel,approximately 9500 graphite pebbles with a diameter of 0.06 m are packed in a random arrangement with a bed height of 1 m.The porosity of the pebble-bed structure is approximately 0.41.The outside of the vessel is open to the atmosphere.An inert gas(either helium or nitrogen)is used to simulate the thermal conditions of the pebble-bed core and prevent the corrosion of graphite caused by high temperatures.The heating elements induce a heat flux that is transported by the mechanisms of conduction,convection,and radiation through the pebble bed and outer wall.For temperature measurements,thermocouples are located at the vessel wall,top and bottom insulation layers,protection layers of the heating element,and at different positions between the solid in the horizontal and vertical directions.To make sure that most of the heat is transported in the radial direction,thermal insulation materials are included at the top and bottom of the pebble bed to model an adiabatic boundary.In the experiments,the pebble bed was initially heated for hours with increasing power,and then subsequently heated at constant power to obtain the final stable temperature distributions.Detailed measurements in different radial locations close to the top(height 0.91 m)of the pebble bed as well as at the center(height 0.5 m)and bottom(height 0.09 m)are listed in[14],which will be used to validate the numerical simulation method proposed in this paper.
3 Simulation methodology
3.1 Random packing generation
The first step of this methodology is the generation of a pebble bed that can be used for the simulation.It is impossible to obtain the detailed positions of every pebble in the SANA facility.However,the random packing process during the experiment can be simulated with the aid of DEM to obtain a good numerical representative of the realistic particle arrangement in the experiment.DEM,originally introduced by Cundall and Strack[15],treats granular materials as an assembly of distinct particles,each governed by thefundamentallawsofphysicsand mechanics that take into account material and interaction properties.In this study,the Particle Flow Code in 3 Dimensions(PFC3D)[16]was used to create the numerical pebble-bed core and mimic the actual generation of the SANA packed bed.This code,based on DEM,is particularly suited for simulating sphere-to-sphere and sphere-towall interactions in the reactor core because its basic modeling element is a sphere and the numerical results can easily be extracted by user-written functions.
In the DEM simulation,the spherical particles are initialized randomly within the annular domain and fall to the bottom of the container because of gravity.The contact model used for the simulation is the Hertz-Mindlin model,which is based on the Hertzian contact theory and tangential force model of Mindlin.For each of these particles,a force balance is formulated and solved,which takes into account the gravity force and interaction between particles and between particles and wall.The properties used for bed generation taken from[17]are listed in Table 1.
The DEM calculation stops when kinetic energy is approximately 10-10kgm2/s2and a steady state is reached.After the simulation,the central coordinate of each sphere can be given by PFC3D;with the help of a Python script,a journal file was generated and then imported into Gambit 2.4.6 to recreate the detailed 3D geometry of the pebble bed.Figure 2 shows the simulator of SANA pebble bed.
The heat flux generated by the central heating element in radial directions was kept the same as in SANA.Taking advantage of the periodicity in geometry,the calculation model is not necessary to simulate the experiment in 360°;thus,only the zone from 0°to 60°was extracted and then imported into the CFD program for meshing and calculating.In a strict sense,the use of periodic boundary conditions introduces some discrepancies,but it greatly helps reduce the required computing resources and time.Furthermore,the randomness of packing depends on the geometry generated rather than on the boundary conditions used[18].The final geometry extracted from the DEM-based simulation is shown in Fig.3.
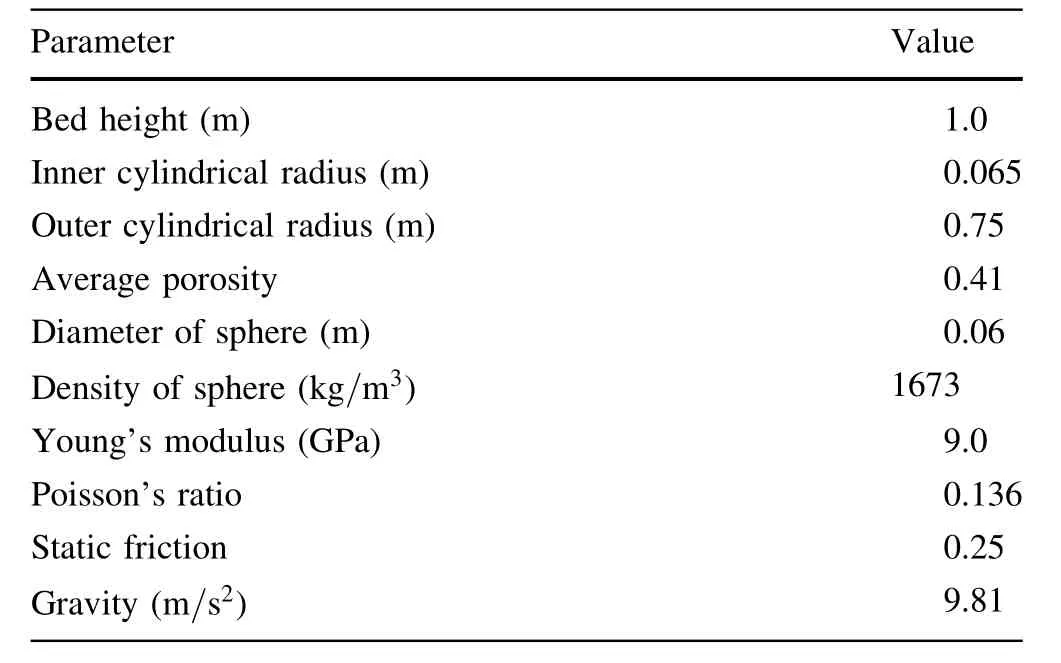
Table 1 Parameters for DEM simulation
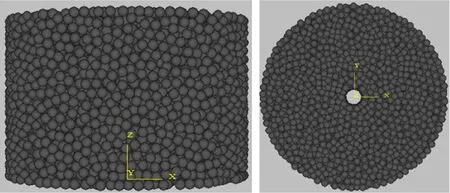
Fig.2 Numerical geometry of SANA,side view(left)and bird's-eye view(right)

Fig.3(Color online)Extracted geometry for simulation,side view(left)and bird's-eye view(right)
3.2 Contact treatment and mesh generation
Generating a numerical packed bed using DEM frequently results in particles that are in very close proximity to each other,which is not a favorable condition for mesh generation.The grid cells near the contact points will be highly skewed,which could lead to simulation convergence problems and affect computational accuracy.In order to avoid this problem while minimizing the changes in bed porosity,a local modi fication method-the bridge method-was adopted[19].In this method,changes are con fined to the contact point and its immediate neighborhood,and a small cylinder is inserted between any spheres that are in contact with or within a speci fied tolerance in the randomly packed bed,with its axis oriented along the center-to-center line between the spheres.According to the work of Dixon[7],the bridge method turned out to be the most suitable technique for contact treatment,and the recommended cylindrical radius size is rc≤0.1dp.Therefore,a Python code was written in the present study to identify the particle pairs that are located suf ficiently close to each other and small cylinders with a radius of 0.1dpwere inserted in the correct locations.Figure 4 shows the typical results of this operation.
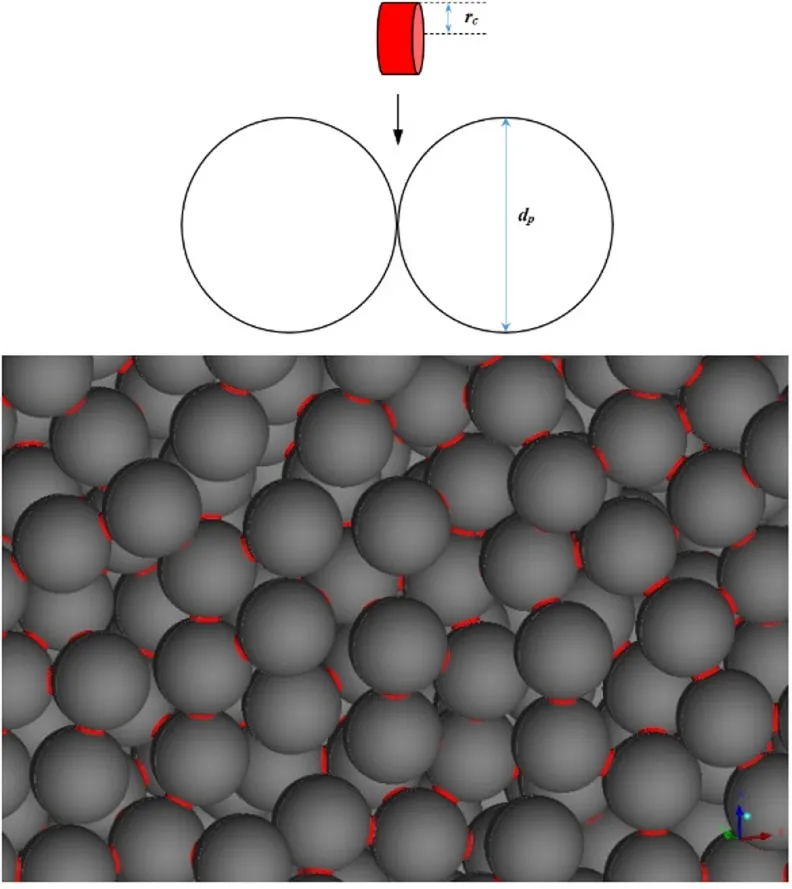
Fig.4(Color online)Bridges method for contact point modi fication
Owing to the complex geometry of the randomly packed bed,an unstructured tetrahedral grid was selected for appropriate discretization of the computational domain.Five layers of prismatic mesh elements were also applied at the interfaces between the fluid and solid in order to capture the temperature gradient within the pebbles more accurately since the maximum temperature in pebbles is one of the key safety parameters for a pebble-bed core.
3.3 CFD setup
For CFD calculation of the packed pebble-bed,temperature progression in the DLOFC scenario was determined by three mechanisms:conduction,radiation,and natural convection,owing to the fact that helium or nitrogen gas can be treated as transparent in the radiative heat transfer process at temperatures and pressures of interest.Meanwhile,the gas in the voids was driven by buoyancy in natural convection owing to the density variation,which is a function of local temperature.Based on the diameter of the particles and the allowable maximum temperature difference between the hot and cold wall,the maximum Rayleigh number in the packed bed is approximately 104.This is still low for the current packed bed reactor;hence,the laminar flow regime was assumed in the simulation[20].
Therefore,the steady viscous laminar model has been adopted and a density correlation dependent on local temperatures was used for the buoyancy effect.Radiative heat transfer between the walls and particle surfaces was taken into account by the surface-to-surface radiation model.No other empirical correlations are needed for this direct approach.A set of three-dimensional continuity,momentum,and energy equations together with the radiative transfer equation and numericalschemes are summarized in the documentation[21].All the equations were solved numerically using the commercial CFD code ANSYS FLUENT 16.0.Table 2 presents the main solution parameters.
In order to ensure comparability with SANA experiments,the bottom and top boundaries were assumed as adiabatic and no allowance was made for conductive heat transfer within the material situated at the inner and outer boundaries of the pebble bed.A Neumann boundary condition was imposed for the vertical inner wall;the heat input to the heating element was considered uniformly distributed,while a Cauchy boundary condition was assumed for the outer wall using the SANA experimental data.The heat transfer coef ficient between the outer walls and the environment was fixed at 18.4W/m2K,and the environment temperature is equal to 22°C.These average values were obtained from the recommended values of the SANA report.
4 Results and discussions
4.1 Validation of numerical packed bed
The numerical packed bed was generated as described in Sect.3.1.To validate the DEM simulation,three quantities,i.e.,the radial porosity,average coordination number,and average contact angle,which are considered as the characteristics of the packed bed structure,were extracted and used to compare with the empirical equations found in the literature.
To find the radial porosity distribution,the pebble bed was radially divided into a number of coaxial cylinders with a distance less than the diameter of the sphere so that the sphere can be intersected by at least one of the cylinders.The intersected volume of each sphere was calculated and the void volume was calculated by subtracting the intersected volume from the total volume between two adjacent cylinders[22].Finally,the radial porosity of each section was calculated and then compared with the experimentally determined correlation given by de Klerk[23].

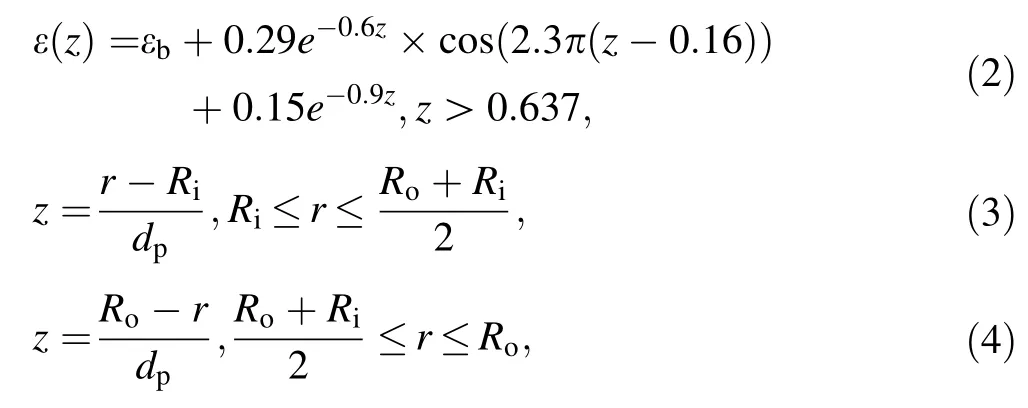
where ε(z)is the variation of porosity in the radial direction as a function of sphere diameter from the inner or outer wall with the normalized wall distance z;εbis the bulk porosity of the packed bed undisturbed by wall effects;Riand Roare the radius of the inner and outer wall,respectively;and r is the radial distance from the center of the bed.This correlation identi fies two regimes,one close to the wall and one far from it.As mentioned by de Klerk,the correlation can accurately describe the porosity variations near and far from the con fining wall.Comparison results are presented in Fig.5a.These show that at the inner and outer wall,the porosity is a maximum of 1 because the particles make contact with the con fining wall only at one point.With increasing z,the porosity decreases and the first minimum value can be found at approximately half the sphere diameter.The further run of the curve shows declining oscillation around the average bed porosity.In addition,the figure indicates that beyond approximately 4 sphere diameters from the wall,the porosity variation is less than 5%,and remains almost constant.Figure 5b shows that the damped oscillatory behavior of porosity in the axial direction is weaker than that in the radial direction because the height is larger than the radius.
Besides the porosity variations,Du Toit et al.[24]pointed out that the porous structure can be characterized more explicitly and accurately with the aid of another two geometrical quantities:the average coordination number(¯Nc)and average contact angle(¯φc)between adjacent spheres.The coordination number is de fined as the number of spheres in contact with the sphere under consideration,while the contact angle is the angle between the line perpendicular to the direction of the heat flux.They investigated the variations of the two quantities in a randomly packed bed and developed empirical correlations that account for the bulk region.
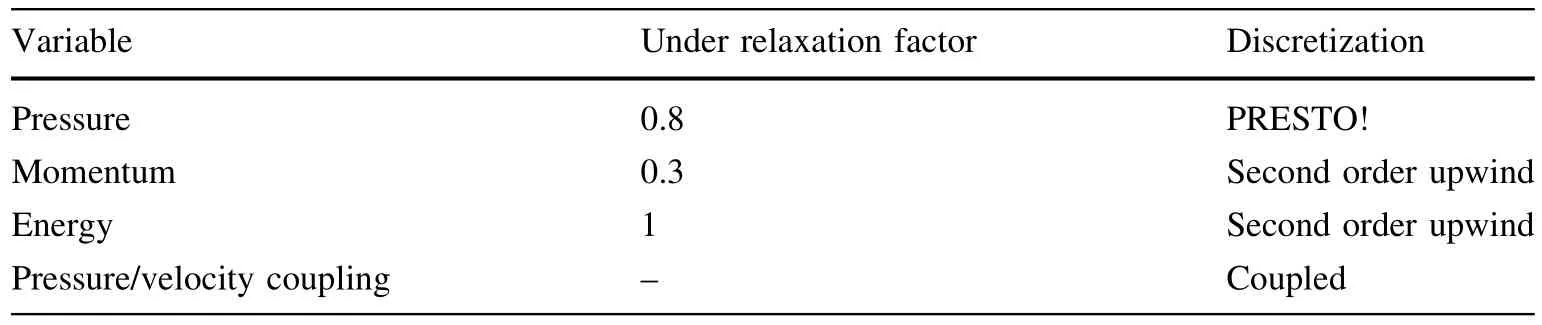
Table 2 Main solving parameters

Fig.5 Porosity variation of randomly packed annular beds

The average values extracted from the DEM simulation and calculated from the above empirical equations are listed in Table 3.
From the above comparisons,it is clear that the numerical results extracted from the DEM simulation match the empirical values well.Thus,the numerical packed bed can be considered a good representativegeometrical description of the large-scale experimental packed bed for CFD calculation.

Table 3 Comparison of¯Ncand¯φc(correlations with simulated)
4.2 Grid independence study
To have con fidence in CFD simulation,it is essential to carry out veri fication studies to demonstrate the grid independence of the calculated results.The numerical solutions deemed grid-independent will remain the same as the mesh density increases.In this study,simulations were conducted at the maximum input power considered(i.e.,35 kW)with helium as the working fluid,since this case is expected to require the finest mesh.
The tetrahedral grids were constructed and five prism layers were added onto the pebble surfaces.Five sets of grids with maximal computational element sizes of 1/10dp,1/15dp,1/20dp,1/25dp,and 1/30dpon the pebble surfaces were used for the test.Furthermore,the total thickness of the prismatic element layer was kept at 0.6 mm and each was expanded by a factor of 1.2.
Figure 6 shows the variation of the average temperature and incident radiation on a fixed sphere with maximal computational element size resolutions for heat transfer in the randomly packed bed.These suggest that when the maximal size is smaller than 1/20dp,the grid in fluence will be insigni ficant and grid independence can be achieved.Therefore,grid element size of 1/20dpwas adopted for the simulations and the corresponding number of elements was approximately 37 million.
4.3 Comparison between CFD and SANA results
This section will present comparisons between SANA experimental data and simulation results calculated by CFD for four cases.These are limited to steady-state conditions and include two fluids with different natural convection properties,i.e.,helium and nitrogen,as well as two different heating con figurations along the height of the pebble bed.The predicted flow and heat transfer inside the pebble bed and comparison results are shown below.
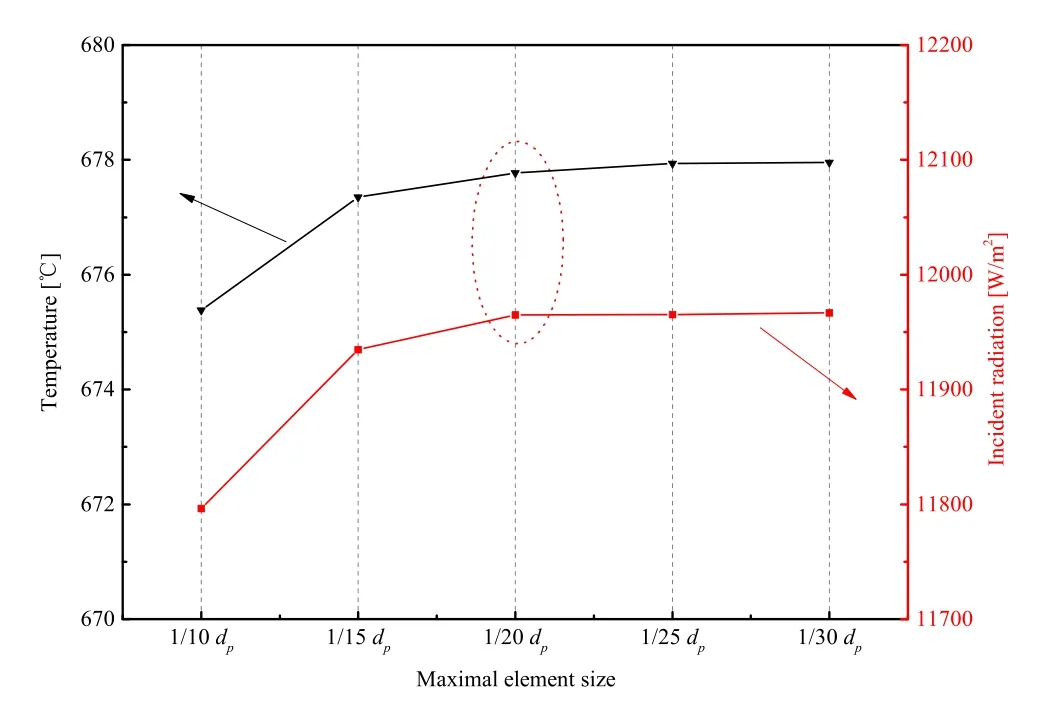
Fig.6 Grid independence test

Fig.7(Color online)Velocity and temperature distribution for nitrogen with 10 kW heating power

Fig.8 Simulated and measured temperature comparison for nitrogen with 10 kW heating power

Fig.9(Color online)Velocity and temperature distribution for nitrogen with 35 kW heating power

Fig.10 Simulated and measured temperature comparison for nitrogen with 35 kW heating power

Fig.11(Color online)Velocity and temperature distribution for helium with 10 kW heating power
Case 1 The first case involves nitrogen with 10 kW nominal heating power along the full height of the pebble bed.Figure 7 shows the calculated velocity and temperature distributions over y=0 plane,while Fig.8 shows the comparison between the simulated and measured temperatures at the top,center,and bottom positions along the radial direction of the pebble bed.
Case 2 The second case involves nitrogen but with 35 kW nominal heating power added at the pebble bed.Figure 9 shows the velocity and temperature distribution of the flow field,and Fig.10 shows the comparison between the simulated and measured temperatures.
The flow field shown in Figs.7 and 9 is typical phenomena of buoyancy-driven flow in an annular packed bed with a heated inner wall.Inside the vessel,buoyancydriven natural convection causes the nitrogen gas to flow upwards along the heater,and downwards along the inside of the vessel.The maximum velocity is approximately 1.080 m/s for the case with low heating power and 0.828 m/s for the higher heating power.It is noteworthy that the maximum gas velocity decreases with the increase in heating power,which is attributed to the fact that for higher temperature conditions,heat transfer by radiation becomes dominant in the gas-cooled pebble-bed core,thus resulting in the decline of the proportion contributed by natural convection in the total heat transfer process.Figures 8 and 10 show relatively good agreement between the numerical results and experimental data,except for some deviations that could be attributed to the contact treatment between pebbles and the calculation of cumulative error during CFD simulations.
Case 3 Figure 11 shows the velocity and temperature distribution over y=0 plane for the flow field,while
Fig.12 shows the simulated and measured temperatures for helium with 10 kW nominal heating power along the full height of the pebble bed.
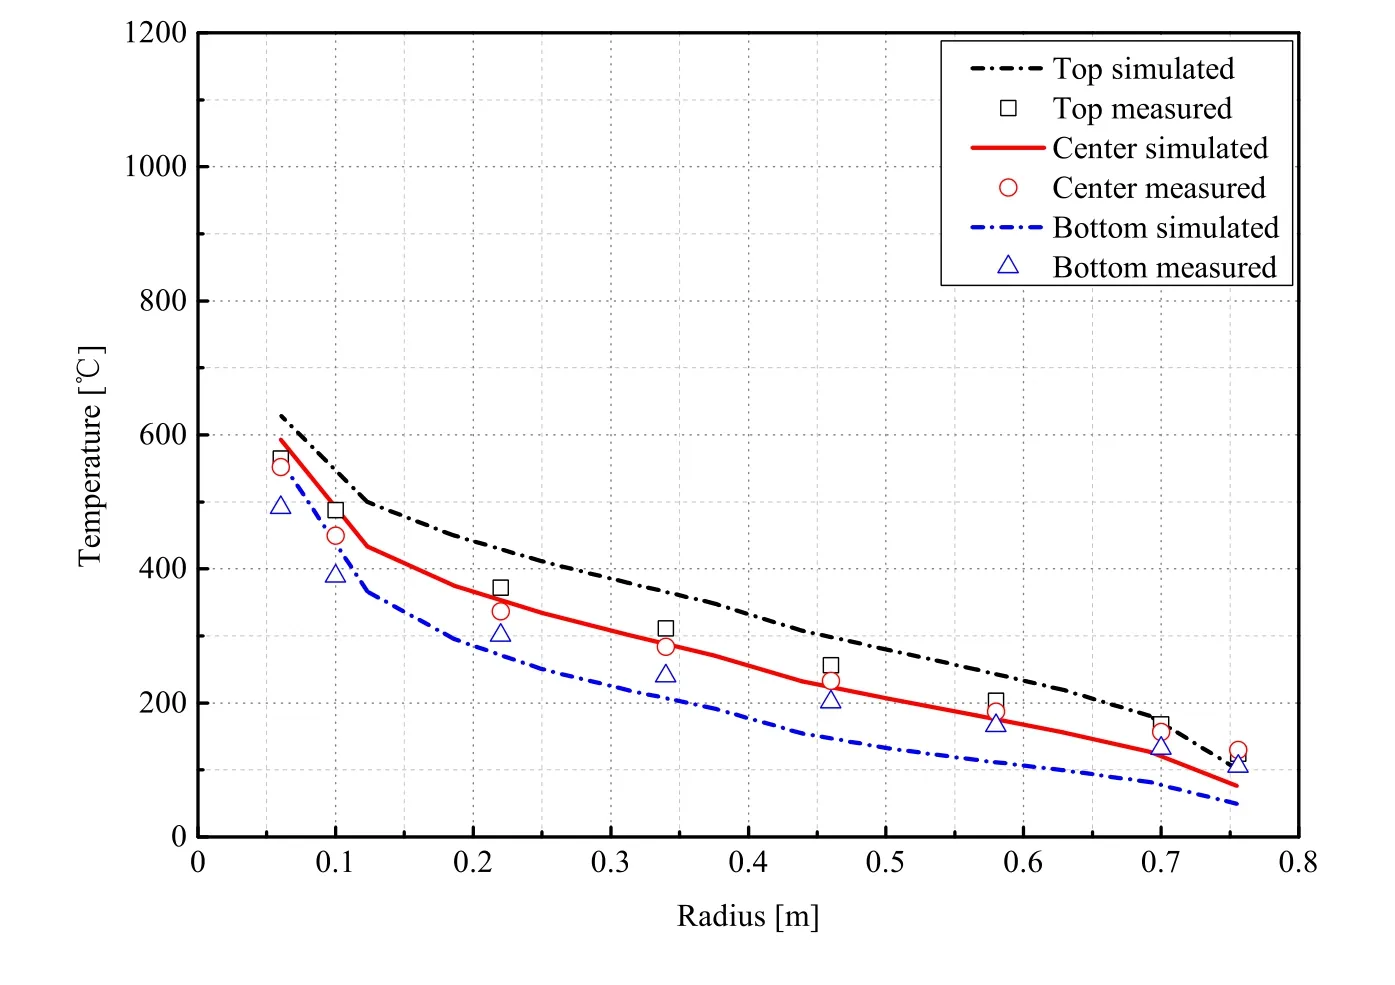
Fig.12(Color online)Simulated and measured temperatures comparison for helium with 10 kW heating power

Fig.13(Color online)Velocity and temperature distribution for helium with 35 kW heating power

Fig.14 Simulated and measured temperature comparison for helium with 35 kW heating power
Case 4 Case 4 involves helium with 35 kW nominal heating power along the height of the pebble bed.Figure 13 shows the velocity and temperature distribution,and Fig.14 shows the comparison between the simulated and measured temperatures.
In the above two cases,the flow fields shown in Fig.11 and 13 are typical phenomena of buoyancy-driven flow.The maximum velocity is approximately 0.639 m/s for the lower heating power and 0.404 m/s for the higher heating power.The small temperature gradient in the axial direction compared with that in Figs.7 and 9 indicates the larger thermal conductivity of helium.From Figs.12 and 14,the difference between the simulated and experimental temperature distributions at top and bottom of the pebble bed is slightly obvious.This may be due in part to the fact that the axial porosity variation at top and bottom of the bed is larger than that at the middle region,as shown in Fig.5b,which causes the temperature distribution to be more sensitive and results in a relatively large calculation error in these areas.Another possible reason is that there is heat leakage in the axial direction in the experiment;but in the case of the simulation model,no conduction heat transfer was allowed from the top and bottom of the bed.The small difference in boundary conditions also caused errors between the measured and numerical simulation results.However,a similar trend was obtained between the simulated and measured temperatures along different locations.
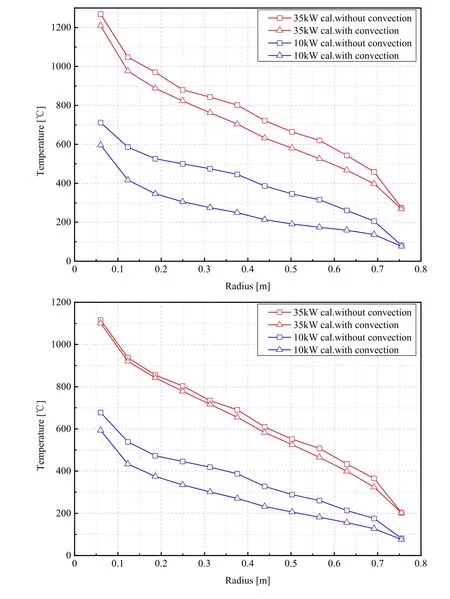
Fig.15 Comparison of simulated results with and without natural convection for nitrogen(top)and helium(bottom)
4.4 In fluence of natural convection
Section 4.3 shows the temperature distributions in the pebble-bed core with consideration of the natural convection effect.In order to investigate how natural convection promotes the decay heat removal process,an additional four cases were simulated under the same conditions except the convection term was activated.The qualitative comparison results are presented below.
Figure 15 shows the simulated temperature distributions with and without natural convection along the radial directions in the central height of the pebble bed.It can be seen that the temperatures with natural convection(△)are lower than that without convection(□)at the same radius locations.In terms of temperature difference,natural convection has a greater effect on heat transfer for the nitrogen condition than for the helium condition,causing temperature reductions up to approximately 202°C and 117°C,respectively.Natural convection also accounts for a greater proportion of heat transport in the low rather than the high heating power condition.
From the figures,it can be concluded that in a DLOFC accident,the heat transfer capacity of helium by natural convection is very limited and can be ignored,especially at high-temperature conditions.This shows that most simply theoretical thermal conductivity models can make reasonable predictions without considering the convection term in the HTGR[25-28].However,for nitrogen and other coolants with strong convective capacity,the natural convection in fluence must be taken into account more accurately when the theoretical models are no longer valid;the numerical methodology proposed in this paper becomes necessary in such pebble-bed simulations.
5 Conclusion
In this paper,a complete DEM-CFD methodology that includes particle interactions,heat conduction,natural convection,and radiation was proposed to investigate the heat transfer inside a randomly packed pebble-bed core,which avoids the disadvantages of a simpli fied semi-empirical porous media modeling approach.The radial porosity of the three-dimensional simulated packed bed was calculated and the results show an oscillating pattern with maximum porosity at the wall of the bed that decreases gradually toward the center,which is in good agreement with experimental results.Comparison between the simulated and experimentally measured temperature distributions along the radial direction at different heights of the bed showed good agreement,which demonstrates that the adopted numerical models are suitable for the prediction and analysis of the temperature progression inside a randomly packed pebble-bed core.The in fluence of natural convection,which is usually ignored in theoretical models,could have large impact on temperature distributions and must be taken into account more accurately,especially for coolants with strong convective capacity.This study can be used to predict thermal- fluid phenomena in randomly packed pebble beds and is easily extended to account for the decay heat removal process in newly designed FHRs.Related work will be presented in subsequent papers.
杂志排行

Nuclear Science and Techniques的其它文章
- Simulation study of the dose and energy responses of FNTD personal neutron dosimetry
- Using monochromatic light to measure attenuation length of liquid scintillator solvent LAB
- Solution of the finite slab criticality problem using an alternative phase function with the second kind of Chebyshev polynomials
- Determination of water equivalent ratio for some dosimetric materials in proton therapy using MNCPX simulation tool
- Application of Monte Carlo method to calculate the effective delayed neutron fraction in molten salt reactor
- Analysis of beryllium poisoning effect on liquid metal reactor with U-Be alloy fuel