Using monochromatic light to measure attenuation length of liquid scintillator solvent LAB
2019-02-27RuiZhangDeWenCaoChangWeiLohYouHangLiuFangLiangWuJiaLiangZhangMingQi
Rui Zhang·De-Wen Cao·Chang-Wei Loh·You-Hang Liu·Fang-Liang Wu·Jia-Liang Zhang·Ming Qi
Abstract Linear alkylbenzene(LAB)will be used as solvent for the liquid scintillator in the central detector of Jiangmen Underground Neutrino Observatory.The sheer size of the detector imposes signi ficant challenges and the necessity to further improve the optical transparency of high-quality LAB.In order to study high optical transparencies,we continuously improve our measurement setup and use monochromatic light to measure the attenuation lengths of LAB samples.Moreover,the effects of organic impurities on LAB samples are studied to understand their interaction mechanisms and further improve the optical transparency of LAB.
Keywords Neutrino detector·Linear alkylbenzene ·Light absorption
1 Introduction
The neutrino observatory Jiangmen Underground Neutrino Observatory(JUNO)is designed to precisely measure the energy spectrum of reactor antineutrinos to determine the neutrino mass hierarchy and measure the oscillation
This work was supported by the National 973 Project Foundation of the Ministry of Science and Technology of China(No.2013CB834300)and Strategic Pilot Science and Technology Project of the CAS(No.XDA10010000),and the National Natural Science Foundation of China(No.116201 004).parameters[1-4].Neutrino oscillation is an indicator for their nonzero mass and the only experimental discovery beyond the Standard Model.By investigating the mass hierarchy,we can gain a better understanding of the origin of neutrino mass.
The JUNO is located in Guangdong,China,approximately 53 km away from the Yangjiang and Taishan nuclear power plants.It consists of a spherical antineutrino detector(diameter of 35.4 m)as central detector,which will be filled with 20 kilotons of liquid scintillator(LS)surrounded by 18,500 new 20-inch broad photomultiplier tubes(PMTs).To reach its scienti fic goals,the energy resolution has to be above 3%at 1 MeV,corresponding to 1200 photon electrons per MeV.Apart from the required high-ef ficiency PMTs,a highly transparent LS is also crucial.
To achieve excellent optical properties-i.e.,high transparency and light yield,long-term chemical stability,and low toxicity-linear alkylbenzene(LAB)is chosen as organic solvent for the LS.It is doped with 2,5-diphenyloxazole(PPO)as fluor and p-bis-(o-methylstyryl)-benzene(bis-MSB)as wavelength shifter.Besides JUNO,Daya Bay[5-8],SNO+[9],RENO[10],and Double Chooz[11]have also used LAB as LS solvent.The optical transparency of LAB is quanti fied by its attenuation length.In the JUNO experiment,the attenuation length of the LAB samples should be comparable to the size of the central detector.
In collaboration with the Jinling Petrochemical Corporation(hereafter called ‘‘Jinling''),we have successfully improved the LAB attenuation lengths from 10 m for the Daya Bay experiment to 25.8 m for the JUNO experiment.Some LAB samples are potentially scalable for a mass production of 20 kilotons[12].To obtain LAB samples with longer light attenuation lengths,the impurities in the LAB must be identi fied and then reduced as much as possible,in particular,impurities with strong absorption within the 350-450 nm scintillation spectrum.Preliminary studies on organic impurities[13,14]have been performed to discover which impurities can reduce the attenuation length of LAB.In our latest analysis,three suspicious impurities with characteristic absorptions in the range of 350-450 nm were found via high-precision gas chromatography-mass spectrometry(GC-MS)(Thermo Scienti fic,Q Exactive GC-MS,Trace 1310).Their reduction or elimination might enable an increase in the LAB attenuation length to a larger value than the current maximum of 25.8 m.Therefore,it is promising to experimentally measure how long the attenuation length can become when impurities are eliminated.
To meet the stringent requirements for a LAB light attenuation length of 30 m,a further improvement of the measurement device and an optimization of the stability and reliability of the measurement method are essential.In this paper,we introduce recent progress on measurement methods and speci fically describe the use of monochromatic light to accurately measure the attenuation lengths of LAB samples.Simultaneously,related topics such as the estimation of the effect of suspicious impurities on the attenuation length are discussed.
2 Experimental preparation
2.1 Attenuation length and Beer-Lambert law
The attenuation length Lλis the distance at which the intensity of the incident light with wavelength λ has dropped by a factor of 1/e.It can be expressed as follows[15]:

where I is the intensity of the light after it has travelled the distance x in the sample and I0the initial intensity.
According to the Beer-Lambert law,the absorbance of the sample is proportional to the concentration c of the attenuation species and length l of the light path[16]:

where A is the absorbance with A=logand∈the molar extinction coef ficient.
The main components of LAB exhibit no absorption peaks in the 350-450 nm range.However,there are hundreds of impurities in LAB samples,some of which can exhibit absorption in this light range.For N attenuation species in the sample:

Together with Eq.(1),we obtain:

The Beer-Lambertlaw isonly valid forideal monochromatic waves.If the spectrum of the incident light is not monochromatic,the light intensity should be the weighted average of the LED spectrum f(λ):

The LED used in our experiments has a wide spectrum.Thus,the measurement results should be an averaged effect of multi-wavelength light.We used an optical filter to obtain more monochromatic light and thereby as accurate measurements of the attenuation length as possible.
2.2 Sample preparation
A series of LAB samples were prepared and tagged as NJ42#,NJ46-R#,NJ48#,NJ49#,and NJ50#.All samples except NJ42#are commercial products.However,they were produced in different batches,and the qualities are therefore slightly different.As commercial LAB productions could not meet the requirements in our previous work,we produced high-quality LAB samples[12]with an improved production process by adjusting a set of technological parameters.The NJ42#sample is one of the highquality LAB samples.The NJ46-R#sample was prepared from LAB sample NJ46#,which was mildly contaminated.Hence,its light attenuation length is much lower than those of other samples.Further,an LS sample based on LAB with 0.07 g/L PPO and 13 mg/L bis-MSB doping was prepared.
3 Experiments
3.1 Experimental setup
The optical measurement apparatus is shown in Fig.1.Three LEDs with 400 nm,430 nm,and 470 nm wavelengths are mounted as light sources to the top of the setup.The attenuation length can be measured at different LED wavelengths by moving the translation station.Usually,a wavelength of 430 nm is selected to match the response of the PMT in the JUNO experiment.The signal generator(AFG3102)drives the LED to emit pulsed light,which is then parallelly collimated by the lens.Monochromatic light is obtained with a bandpass filter.The beam passes through a diaphragm with an adjustable aperture and a 1-m stainless steel tube with Te flon-covered inner wall.The LAB sample is filled into the 1-m tube,and the height of the liquid level is controlled via an electromagnetic valve located at the bottom of the tube.

Fig.1 Schematic of experimental setup
A PMT(Hamamatsu R7724;51 mm diameter)is installed at the bottom of the equipment to receive the attenuated light.The signal coming from the PMT is then transmitted to the data acquisition(DAQ)system[17]and converted to an ADC channel value proportional to the signal intensity with a charge-to-amplitude converter(QADC)(CAEN V965).With the ADC channel value,Eq.(1)can be expressed as:

where ADCxis the ADC value at height x of the liquid level and ADC0the ADC value when the 1-m tube is empty.After measuring the ADC channels of different liquid levels,we obtain the light attenuation length by fitting the data with Eq.(6).
The lens and aperture of the diaphragm are adjusted to achieve a parallelly collimated light beam propagating toward the central spot of the PMT.In this study,some measurement parameters were optimized to obtain accurate and stable results.To reduce the fluctuations in the output of the electronic equipment,the ambient temperature was stabilized to approximately 0.2°C.Before the actual measurement of the LAB samples,we used high-purity water to test our device and ensure optimal conditions.
3.2 Light spectra of LEDs
The light spectra of the three LEDs were detected with an FX2000-RD fiber optic spectrometer.The results are shown in Fig.2 and Table 1.The attenuation length of the LAB changes with the wavelength[18].It is often measured at 430 nm for reference because the spectrum of the scintillator light peaks at 430 nm,which is also the region in which the PMTs reach maximal quantum ef ficiency.
3.3 Selection of filters
In this work,we used bandpass filters to obtain more monochromatic light at 430 nm for more accurate measurement results.The speci fications of the filters are given in Table 2.Figure 3 presents the spectrum of the LED light for different filters.The light transmittance of the Thorlabs filter is only 45%,resulting in a very weak light intensity,which requires the adjustment of other measurement parameters.Hence,the filter cannot meet our experiment requirements.Although the FWHM of the Thorlabs filter is smaller,our experiments were mainly carried out with a Semrock filter.
4 Results and discussion
4.1 Attenuation length measurement of LAB
We measured a series of different LAB samples with and without filter,respectively.The results are shown in Figs.4,5,and Table 3.We discovered that the attenuation lengths are improved to various degrees under monochromatic light.Besides,the filter effects on different LAB samples are not equal,which suggests that the LAB samples have complicated mixtures of impurities with diverse sensitivities to distinct wavelengths.
4.2 Attenuation length measurement of LS
Figure 6 shows the results for the LS sample measured with and without filter.The data of the setup without filter are not well fitted with the Beer-Lambert law owing to the various impurities in PPO and bis-MSB,whereas more accurate attenuation lengths for LS with filter were obtained,as shown in Fig.6b.

Fig.2 Spectra of three LEDs used in our experiment.The wavelengths of the LEDs are a 400 nm,b 430 nm,and c 470 nm,respectively

Table 1 Speci fications of three LEDs used in our experiment
4.3 Estimation of effect of organic impurities
We focused on analyzing the organic impurities in LAB samples to identify the ones in fluencing the optical transparency of LAB samples.With a LAB light attenuation length of more than 20 m,the impurity concentration is already very low and close to the resolution limit of GCMS.We are facing the conundrum of whether to further accurately measure the impurity concentrations without knowing their degree of in fluence on the transparencies of LAB samples.However,according to Eq.(3),it might be possible to use the Beer-Lambert law to estimate the effect of a certain impurity on the optical transparencies of LAB samples.The absorption peak of the impurity is at a single wavelength.Hence,analyzing the in fluence of a certain impurity on the LAB is only possible using a filter to obtain monochromatic incident light.
In Ref.[12],we calculated suspicious impurity compounds that exhibit absorptions in the 350-500 nm range.The impurity C34H36N2O4was found in all three samples.Hence,it was chosen as an example.Our goal is to estimatethe effect of the impurity concentration on the LAB attenuation length.To this end,we applied Eqs.(1)to(4):

Table 2 Speci fications of bandpass filters used in experiment

Fig.3 Spectrum of light source after use of a Thorlabs and b Semrock filters

Fig.4(Color online)ADC/ADC0of NJ42#,NJ46-R#,NJ48#,NJ49#,and NJ50#for various LAB liquid heights x,where ADC/ADC0refers to the ADC value at height x normalized to the ADC value at height x0,which is the maximal value obtained from the data

Fig.5(Color online)Comparison of attenuation lengths of NJ46-R#,NJ48#,NJ49#,NJ50#,and NJ42#measured with and without filter

Table 3 Comparison of attenuation lengths of different LAB samples measured with and without filter

The molar extinction coef ficient∈can be estimated via[14]:
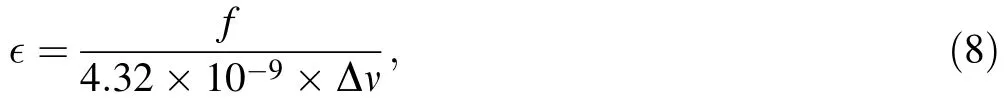
where f is the oscillator strength and Δν the width of the peak absorption band in cm-1.
We divided the impurities into two parts:the impurity to be determined and the part,which contains all other yet unknown impurities.
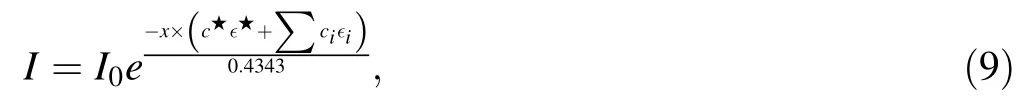
where c⋆and ∈⋆are the concentration and molar extinction coef ficient of the single impurity of interest,respectively.
Figure 7 shows the attenuation length measurements of LAB NJ50#.By using Eq.(9)to fit the data and upper limits of the fitting parameter of c⋆,we obtained different hypothetical concentrations for this impurity.

Fig.6 Measurement results for LS samples a without filter and b with filter.The attenuation lengths obtained from an exponential fit are 6.5 m and 12.69 m,respectively

Fig.7 Measurement results of LAB NJ50#with filter for various LAB liquid heights x

Fig.8 Effects of different hypothetical concentrations of impurity C34H36N2O4on attenuation length of LAB NJ50#.If we can remove the impurity,the attenuation length will improve.The improvement is signi ficant for high impurity concentrations
Figure 8 shows the effect of the impurity with different hypothetical concentrations.If the concentration of the impurity C34H36N2O4in LAB NJ50#sample is below several ppm,it has no high impact on the attenuation length of the sample.The proposed method could provide us a fast and simple way to identify suspicious impurities with absorption peaks near 430 nm and the upper limit of impurity concentrations that are still tolerable while achieving a speci fic attenuation length.In the case presented in Fig.8,the value was set to 30 m.
4.4 Considerations
In order to accurately measure the light attenuation length of the LAB sample,we will continue to improve our experimental measurement devices and methods including upgrades of our current DAQ system and better filters.As shown in Fig.9,we plan to apply preparative high-performance liquid chromatography to separate impurities from LAB samples and determine high impurity concentrations,which will be analyzed via GC-MS.This would help us to make a more detailed study on the chemical structure of impurities and the light absorption properties of LAB samples.
5 Conclusion
The attenuation lengths of LAB samples with and without filter were measured,respectively.After filtering,a more accurate attenuation length at 430 nm was measured.The attenuation lengths of different LAB samples exhibited various degrees of improvements,which gives us a hint on how to increase the optical transparency of LAB.Moreover,the effects of impurity concentrations were analyzed,and a method to estimate the possible effect of different certain hypothetical impurity concentrations was proposed.This method can promote an ef ficient determination and elimination of suspicious impurities,thereby eventually improving the attenuation length to values higher than those of present LAB samples.
AcknowledgementsWearegratefulforthewarm helpand enlightening insights from Yi-Fang Wang,Jun Cao,Sen Qian,Li Zhou,Tao Hu,Ya-Yun Ding,Zhe Ning,Na Zhu,Guang-You Yu,Hai-Bo Yang,and Ai-Zhong Huang.
杂志排行

Nuclear Science and Techniques的其它文章
- Simulation study of the dose and energy responses of FNTD personal neutron dosimetry
- Study of heat transfer by using DEM-CFD method in a randomly packed pebble-bed reactor
- Solution of the finite slab criticality problem using an alternative phase function with the second kind of Chebyshev polynomials
- Determination of water equivalent ratio for some dosimetric materials in proton therapy using MNCPX simulation tool
- Application of Monte Carlo method to calculate the effective delayed neutron fraction in molten salt reactor
- Analysis of beryllium poisoning effect on liquid metal reactor with U-Be alloy fuel