Improved plasma position detection method in EAST Tokamak using fast CCD camera
2019-02-27ShuangBaoShuChuanMuYuChaoLiuMeiWenChenYuZhongZhangXinLi
Shuang-Bao Shu·Chuan-Mu Yu·Chao Liu·Mei-Wen Chen·Yu-Zhong Zhang·Xin Li
Abstract To control the steady-state operation of Tokamak plasma,it is crucial to accurately obtain its shape and position.This paper presents a method for use in rapidly detecting plasma con figuration during discharge of the Experimental Advanced Superconducting Tokamak device.First,a visible/infrared integrated endoscopy diagnostic system with a large field of view is introduced,and the PCO.edge5.5 camera in this system is used to acquire a plasma discharge image.Based on the analysis of various traditional edge detection algorithms,an improved wavelet edge detection algorithm is then introduced to identify the edge of the plasma.In this method,the local maximum of the modulus of wavelet transform is searched along four gradient directions,and the adaptive threshold is adopted.Finally,the detected boundary is fitted using the least square iterative method to accurately obtain the position of the plasma.Experimental results obtained using the EAST device show that the method presented in this paper can realize expected goals and produce ideal effects;this method thus has signi ficant potential for application in further feedback control of plasma.
Keywords Experimental Advanced Superconducting Tokamak(EAST)·Plasma·CCD camera·Edge detection
1 Introduction
To study magnetic con finement-controlled nuclear fusion in Tokamak devices,it is essential to determine whether the plasma can operate in a steady state over a long time period.The Experimental Advanced Superconducting Tokamak(EAST)was developed by the Institute of Plasma Physics of the Chinese Academy of Sciences,and successful experimental results have been provided since it was completed in 2006[1,2].However,to maintain the long-term steady-state operation of the plasma,its position during discharge must be accurately located,and it is thus crucial to detect the edges of the plasma in the discharge image.The Equilibrium Fitting(EFIT)Algorithm has been used for decades to obtain the plasma position with all major Tokamaks[3],and it is mainly used in magnetic and kinetic analyses of plasma in Tokamak devices.Based on magnetic field calculation results,the con figuration of the plasma can be reconstructed using this method.In addition,the position of the plasma can be observed and various parameters can be adjusted in real time to maintain the long-term steady-state operation of the plasma.However,the plasma induces eddy currents during the start-up phase,which considerably disturb the electromagnetic measurements.This makes use of the EFIT equilibrium equation invalid and the associated method unsuitable for detecting plasma boundaries throughout the entire process.However,a visible camera is free from electromagnetic interference;therefore,this study employs a visible camera to firstly acquire a plasma discharge image and then reconstruct the plasma boundary.
In this study,a set consisting of a visible/infrared imaging system is designed to visualize the plasma discharge in the EAST device.Based on the pin-hole imaging principle and light-splitting technology,the optical system achieves high visible resolution and infrared imaging of the plasma discharge with the same aperture and in a large field of view.After obtaining the plasma discharge image,the plasma edge is then detected using image processing algorithms.Many operators are currently used in image edge detection,for example,the Roberts,Sobel,Prewitt,Laplacian,LOG,and Canny operators[4-6].However,although these are pro ficient in detecting the boundaries of an image,each algorithm has certain limitations.For example,although the Roberts operator has a high positioning accuracy,it does not include a smoothing operation and is also sensitive to noise.The Sobel and Prewitt operators are also not ideal for images that have mixed and complex noise,whereas the Laplacian operator is more sensitive to the noise of an image.The LOG operator provides a better noise resistance performance,but it also causes the loss of detailed image edge information.There is thus a contradiction between the abilities of these operators to accurately locate the plasma edges and their lack of ability to eliminate noise,and it is necessary to select an appropriate noise level and edge location accuracy for use with speci fic problems.In Ref.[7],the edge of the plasma during the discharge process was identi fied using a Canny operator based on the improved Otsu threshold method;however,although the detection effect was very good,the recognition accuracy could be further improved.
Due to its excellent time-frequency characteristics,wavelet transform can be used to effectively analyze the singularity of signals,and it and has thus been widely used in the field of image edge detection[8,9].However,traditional wavelet edge detection algorithms have certain defects when selecting the gradient direction and threshold[10,11],which creates false edges and noise when detecting edges.Therefore,in response to the limitations of the traditional wavelet edge detection algorithm,this paper introduces a method to improve the traditional algorithm by searching the local maximum of the moduli along four gradient directions and adopting the adaptive threshold.The improved method was used on images acquired by a camera during plasma discharge,and experimental results show that its edge detection accuracy is superior to the traditional method.Therefore,use of this method for acquiring images and detecting edges can be well applied to plasma edge detection in EAST.
The remainder of this paper is organized as follows.Section 2 presents the hardware and software design of the visible/infrared integrated endoscope system.Section 3 introduces the traditional wavelet edge detection algorithm in detail and lists limitations inherent in traditional algorithms;and to improve these,the search for the local maximum of the moduli along four gradient directions and the adaptive threshold are introduced,and the detected image edge is then fitted using the least square iterative method.After image edges have been obtained,coordinate transform is employed to acquire plasma boundaries.Section 4 provides experimental results and an associated discussion,and the conclusion is presented in Sect.5.
2 Experimental setup
2.1 Introducing the EAST device
EAST is a fully superconducting experimental Tokamak device with a non-circular cross section.It consists of an ultra-high vacuum chamber,poloidal field coils,toroidal field coils,internal and external cold screens,external vacuum cryostat,and support systems.It is referred to as‘‘fully superconducting''because all magnetic field coils are used to constrain the plasma(including the toroidal field coils,poloidal field coils,and central solenoid,which are all superconducting magnets);and it has a ‘‘non-circular cross section''because the cross section of the toroidal field coils and the plasma is in the shape of the letter D.The main technical features of EAST are as follows.It has a mainframe with a height of 11 m and diameter of 8 m,weights approximately 400 tons and has 16 large‘‘D''-shaped superconducting longitudinal magnetic magnets.It can generate a longitudinal field strength up to 3.5 T,and the 12 polar field superconducting magnets can provide a change in flux of ΔΦ ≥ 10 V s.The main basic parameters are as follows:large radius,R0,of approximately 1.88 m;small radius,a,of approximately 0.45 m;longitudinal field,Bt,of approximately 1.5-3.0 T;and plasma current,Ip,of approximately 1 MA.
2.2 Visible/infrared integrated endoscope system

Fig.1 Location of visible/infrared imaging system
To observe the position and shape of the plasma during discharge,a tangential fast visible imaging system was designed and installed on the EAST device.However,as many diagnostic systems are now installed on the windows of the EAST device,there is limited remaining window space;and to maximize the use of this limited remaining window space,a shared optical path was designed for the visible/infrared imaging system.The visible/infrared imaging system is installed in the G port,as shown in Fig.1.The design of this optical system is based on the pin-hole imaging principle and light-splitting technology,and the optical system can achieve high-resolution visible and infrared imaging of plasma discharge with the same aperture and field of view of 46°× 59°[12].The system mainly comprises the fore-end of an endoscope,collimator lens group,beam splitting system,and visible/infrared receiving terminal.Considering the complex electromagnetic environment inside the device,and the possibility of bombardment from high-energy particles,a perforated plane mirror and a parabolic mirror are adopted in the front-end of the diagnostics system,as shown in Fig.2.Here,the large field of view is achieved by pin-hole imaging,and the Cassegrain system is replaced by the beam splitting system to increase the amount of light within the system.
2.3 Hardware and software design of imaging system

Fig.2(Color online)Optical path for visible/infrared camera
The plasma rotates extremely quickly during the discharge process,and a low-speed camera is unable to adequately capture an image of its position.Therefore,a highspeed PCO.edge5.5 CCD camera(PCO;Germany)is employed to provide hardware support for high-speed acquisition.Compared with the Phantom V710 camera used previously[13],the PCO.edge5.5 camera is smaller,has a higher resolution,and is easier to use.The transfer rate of this image system via the Camera Link interface is up to 5.4 Gb/s.In addition,the highest sampling rate of this CCD camera reaches 100 fps ata resolution of 2560×2160 pixels,and the maximum sampling rate can reach 1651 fps under resolution reduction conditions,which is adequate for use in this experiment.
The image acquisition system primarily includes the PCO.edge5.5 camera,an industrial control computer used for image acquisition,a central timing control system,a real-time image processing server,and a display server,as shown in Fig.3.In the plasma discharge experiment,the central control machine is responsible for sending the shot number and the acquisition time to the image acquisition computer,and also for sending the trigger signal to the camera to control the camera to begin image acquisition using the hardware-triggering mode.The corresponding software for the high-speed CCD imaging system,which was developed in a VS2010 environment,has a simple interface with a user-friendly display.The interface is used to activate and deactivate the camera and to adjust relevant parameters.Figure 4 shows an original image of plasma discharge acquired by the PCO.edge5.5 camera in the G window during the rising phase of the discharge;this is the actual image prior to processing by the edge detection system.As seen in Fig.4,the boundaries of the plasma in the original image are not very clear because it contains a lot of high-frequency noise,and the traditional edge detection algorithm is therefore unable to solve this problem.
3 Plasma edge detection based on wavelet transform
3.1 Traditional wavelet transform edge detection algorithm
Most of the edges in the image are non-differentiable and discontinuous;therefore,the traditional edge detection algorithm based on wavelet transform proceeds as follows.First,a smoothing function is used to smooth the image.The first-or second-order derivative of the smoothed result is then obtained;this result is taken as the wavelet-basis packet function,and maximum points or zero points are then identi fied as image edges.The traditional edge detection algorithm based on wavelet transform usually only calculates the absolute value of the modulus of wavelet transform for each row and each column in horizontal and vertical directions.For each point,the point istaken as the edge point if the maximum of the modulus is obtained at least once in the row and column;otherwise,it is regarded as a non-edge point and the gray value of this point is set to zero.All edge points constitute the edge of the image.However,edges obtained in this way will inevitably contain a large number of false edges with respect to noise.Therefore,after the initial edge is obtained,some of the pseudo-edge points are removed by setting a threshold:Edge points below the threshold are removed,and points above the threshold are reserved.

Fig.3 Hardware structure of image acquisition system used in EAST

Fig.4(Color online)Original image of plasma discharge
The detailed calculation process of the algorithm is as follows.
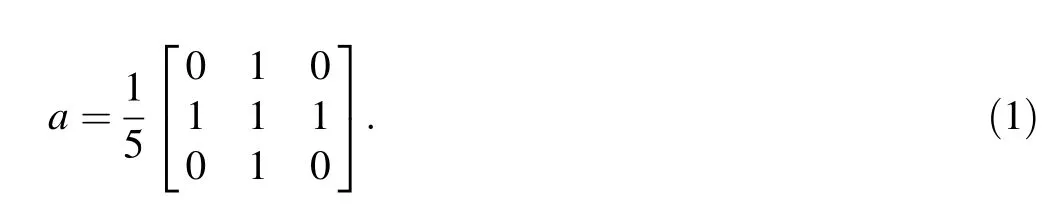
If we suppose that f(x,y)is the image,the result of f(x,y)after smoothing would be θ(x,y)=a(x,y)*f(x,y),where a(x,y)is the 3×3 smoothing filter,as shown in Eq.(1),
φx(x,y),φy(x,y)are the directional derivatives of θ(x,y)in the x and y directions,respectively,and are represented as

If φx(x,y)and φy(x,y)are chosen as the wavelet-basis packet function,the wavelet transform can be expressed as follows,

The corresponding modulus and phase angle of the wavelet transforms are

where|ωx(x,y)|and|ωy(x,y)|are the moduli at point(x,y)along horizontal and vertical directions,respectively.
When Eq.(7)or Eq.(8)is true,the image f(x,y)is set to 1,and otherwise it is set to 0.Finally,the points(x,y)∈{(x,y)|f(x,y)=1}are identi fied as the edge of the image as

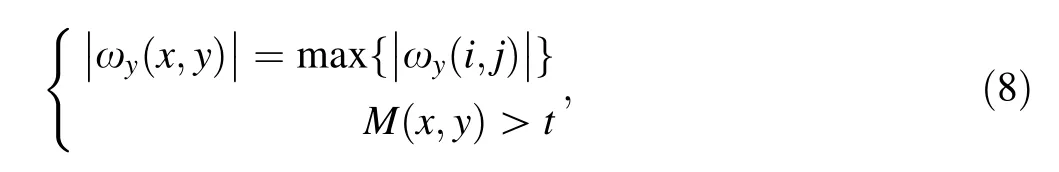
where|ωx(i,j)|and|ωy(i,j)|are the moduli at point(i,j)along horizontal and vertical directions,respectively;t is the global threshold,and the ranges of i and j are i∈(x-1,x+1),j∈(y-1,y+1),respectively.
3.2 Improved wavelet transform edge detection algorithm
The traditional wavelet transform edge detection algorithm has two main limitations.First,the moduli along horizontal or vertical directions are used to obtain the local maxima,which means that it is not possible to obtain the local maxima for the resultant moduli in both directions;therefore,the local maxima obtained by the traditional method are inaccurate.In addition,when the local maximum of the modulus of wavelet transform is solved using the traditional method,false edge information is often included in the obtained edge,and the effective edge is often missing.Second,the pre-set threshold in the traditional method is a fixed value.If the threshold is too small,there will be too much noise detected in the image,and if the threshold setting is too large,detailed information about the image edge will be lost.Therefore,this paper presents an improved method that ameliorates these two issues.
3.2.1 Determination of local maxima moduli in multiple directions
In this paper,the local maxima of the moduli of wavelet transform are directly searched in the modulus image,M,along the direction,A,of each phase angle[14].According to the characteristics of eight adjacent points around each pixel in the image,the neighborhood of the pixel can be divided into eight sectors based on the phase angle,as shown in Fig.5.

Fig.5 Schematic diagram of gradient direction intervals
The eight sectors comprise regions sandwiched by-22.5°,22.5°,67.5°,112.5°,157.5°,-157.5°,-112.5°,-67.5°,-22.5°,and 22.5°,and these are labeled 0,1,2,3,4,5,6,and 7.Each sector represents the gradient direction of the area,and due to the symmetry of the gradient direction,only four directions of 0,1,2,3(or 4,5,6,7)need to be considered in calculations.If the modulus M(x,y)of the image at a certain point(x,y)is greater than that of the two adjacent points along the A(x,y)direction,then the point will be considered as the local maximum modulus of the image.Since the local maximum of the modulus is selected in the same way along the four gradient directions,we only use the selection of the local maximum of the modulus at point(x,y)along the gradient direction 1 to illustrate the problem,as shown in Eq.(9),

If Eq.(9)works,then M(x,y)is taken as the local maximum at point(x,y).In the same way,all local maxima along the four gradient directions are preserved,and these form the initial edge points of the image.
3.2.2 Adaptive threshold setting
The traditional wavelet transform edge detection algorithm uses a fixed threshold to test the entire image,which thus removes high-frequency noise.Certain weak edge information about the image is also removed;however,some pseudo-edge information is retained [15-18].Therefore,this paper uses an adaptive threshold to make improvements,and the associated equation is as shown in Eq.(10)[14],

where T is the adaptive threshold,T0is the initial threshold,a0is a scaling factor,and λi,jis the corresponding wavelet coef ficient for the current window.The size of the window of is 3×3,and T0and a0can be chosen according to the actual situation.When converting a grayscale image into a binary image during preprocessing,the parameters(T0,a0)are changed depending on whether or not the image edge is completely preserved.
The detailed algorithm flow is as follows.First,wavelet transform is conducted on the original image f(x,y),and the corresponding modulus value M(x,y)and phase angle A(x,y)are computed.The modulus image M(x,y)is then searched for to obtain the local maxima of wavelet coeffi cients along the direction A(x,y).The maximum value points are subsequently retained to obtain the possible edge image γ(x,y).Second,the possible edge image γ(x,y)is scanned using a 3×3 window,and based on the adaptive threshold calculation equation,the threshold T is obtained from wavelet transform coef ficients.Finally,the points at which the local maxima of the moduli are greater than T in the image f(x,y)are taken as the edge outputs.
Figure 6 shows a summary of the algorithm flowchart.The detailed algorithm process includes the following steps:(1)Enter the original image;(2)obtain a grayscale image of the original image,perform noise reduction and other preprocessing,and then perform wavelet transform on the image to obtain the modulus M(x,y)and the phase angle A(x,y);(3) find the local maximum points along the four gradient directions and retain the maximum modulus points to obtain the initial edge;and(4)use the obtained adaptive threshold,T,to make further accurate positioning of the initial edge of the image and to output the final edge.
3.3 Edge fitting
The edges of the images obtained by the above method are usually discontinuous and unsmooth;as this result is

and the distance between all points(xi,yi)on the circle and the center(a,b)of the circle can be expressed as

The least square method principle necessitates that the diin Eq.(12)meets the requirements of Eq.(13),

and if the partial derivatives of D are computed for each variable a,b,and r,and their values are set to 0,the other variables a,b,and r can be obtained as shown in Eq.(14),

After determining the three equations obtained in Eq.(14),and using the Gauss-Seidel(Gauss-Seidel)iteration premise[19,20],we can obtain the following iteration equations that depend on the variables a,b,and r as

not conducive to data analysis,it is necessary to fit the actual detected curve to obtain one that is more accurate.In this respect,the image of plasma discharge can be captured by the high-speed camera used in the current experiment,and edge detection and curve fitting for images of plasma discharge throughout the whole process can thus be achieved.According to the principle of plasma discharge and a large amount of experimental data,the edge of the plasma during the start-up phase of discharge is approximately circular,and the edge of the plasma during the latter stage of discharge is an elliptical curve.Therefore,this paper uses the least square iterative method to fit the circular and elliptical curve edges.
3.3.1 Circle fitting
The point(xi,yi)on the edge of the plasma satis fies the equation of a circle with a center of(a,b)and a radius of r,where the initial values(a0,b0,r0)in the iteration are settermination criterion for this method is

where K1represents a,b,and r.The iteration is stopped until all three values are satis fied in Eq.(16).
3.3.2 Elliptical curve fitting
The general expression for a quadratic equation is ax2-+by2+cxy+dx+ey+1=0,wheretheconstant term is normalized to one.Combined with the detected coordinates of the edge,the coef ficients of the curve equation can be obtained according to Eqs.(17)and(18)based on the least square method,
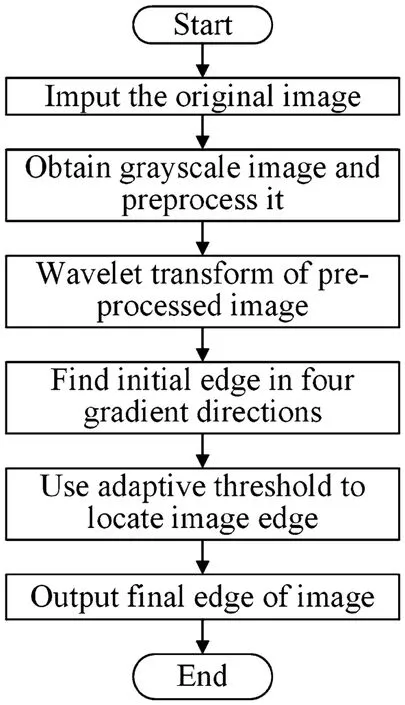
Fig.6 Algorithm flowchart of edge detection

By combining the above equations,we can obtain a system of linear equations,as shown in Eqs.(19)and(20),and by solving these we can obtain the unknown parameters a,b,c,d,and e in the curve equation according to Eq.(21),

3.4 Method for reconstructing plasma boundary
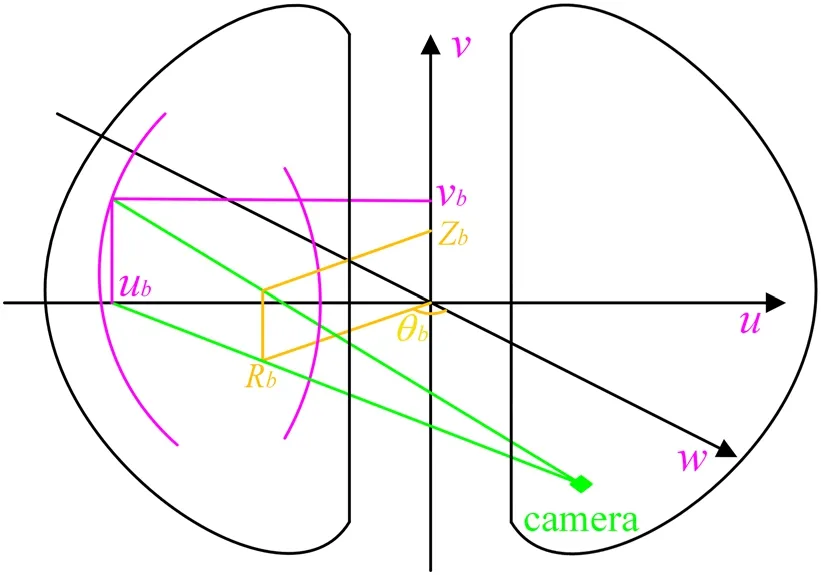
Fig.7(Color online)Relationship between Cartesian coordinate system and Tokamak coordinate system
Assuming that plasma is toroidally symmetric during the plasma discharge progress,we used the OFIT method mentioned in Refs.[21,22]to reconstruct the plasma boundary from the images acquired by the high-speed camera.The main problem in the reconstruction is the transformation between the Cartesian coordinate system(u,v,w)and the Tokamak coordinate systems(R,Z,θ);more information about this is shown in Fig.7.The coordinate axes,v and Z that have identical origins in both coordinate systems,are overlapped.The projection plane of the camera is chosen as the vertical(u,v,0)plane;and after the camera location is obtained(uc,vc,wc)and the projection properties of the optics from the camera are calibrated,the trajectories of all lines of sight are determined and each can be projected onto the projection plane[21,22].Using the method shown in Refs.[21,22],the optical plasma boundary can be reconstructed from camera images.
4 Experimental results and analysis
To illustrate the improvement in edge detection using the improved method,edge detection methods are compared between the Canny operator[7],traditional wavelet transform edge detection algorithm,and the improved algorithm.
Figure 8a shows the original plasma discharge image,Fig.8b shows the result when using the improved Canny algorithm based on the Otsu threshold,Fig.8c shows the detection result obtained using the traditional wavelet transform edge detection algorithm,and Fig.8d shows the result using the improved algorithm.It is evident from these results that the improved algorithm effectively detects more of the undetected edge than the other two methods and ensures thatthe segmented edge is continuous.
Figure 9a shows the original plasma discharge image for Shot#72477 obtained during the start-up phase at 0.06 s;Fig.9b is the result using the improved algorithm;the purple curve in Fig.9c is the circle fitting results using the detected edge algorithm;Fig.10a is the original image of plasma discharge for Shot#72477 at a stable stage of 1.70 s;Fig.10b is the result using the improved algorithm;the purple curve in Fig.10c is the elliptical curve fittingresults using the detected edge algorithm;and a comparison between the reconstruction results using the detected edge algorithm and the EFIT inversion method is shown in Fig.10d.

Fig.8(Color online)Comparison of edge detection results obtained using different algorithms

Fig.9(Color online)Edge detection results for Shot#72477 plasma at 0.06 s

Fig.10(Color online)Edge detection results for Shot#72477 plasma at 1.70 s
Reconstruction of the plasma boundary for Shot#72469 plasma at a stable stage of 4.49 s and for Shot#72774 plasma at a stable stage of 7.00 s was also conducted using the new method,and a corresponding comparison between reconstruction results using the new method and the EFIT inversion method is shown in Figs.11 and 12,respectively.
Based on the above results,it can be seen that the improved algorithm has a good performance in edge detection of plasma during different discharge stages,which fully con firms the reliability of the algorithm.The average processing times for the above four images were 5.696 ms,5.370 ms,4.963 ms,and 5.128 ms using the Windows 7 system,and the processing computer was powered by an Intel(R)Core(TM)i5-4460 CPU@3.20 GHz with 8.00 G of memory.However,the processing speed of the algorithm can be further improved if a more powerful computer is used.

Fig.11(Color online)Edge detection results for Shot#72469 plasma at 4.49 s

Fig.12(Color online)Edge detection results for Shot#72774 plasma at 7.00 s
5 Conclusion
In this paper,images of plasma in the EAST device are acquired using an image acquisition system that mainly consists of an endoscopy system and a high-speed CCD camera.Based on the hardware flat of visible/infrared image acquisition system,an improved wavelet transform edge detection algorithm is introduced to realize accurate identi fication of the edge of the discharge image.In addition,curve fitting based on the least square iterative method is used to conduct edge fitting to accurately obtain the actual position of the plasma.Plasma edge detection under different discharge stages is performed using this improved method,and the experimental results from the EAST device show that this method meets the expected goals and produces perfect effect,which is of considerable signi ficance for enabling further feedback control of plasma.
AcknowledgementsThe authors are grateful to all members of the EAST team for their contribution to experiments.
杂志排行

Nuclear Science and Techniques的其它文章
- Simulation study of the dose and energy responses of FNTD personal neutron dosimetry
- Using monochromatic light to measure attenuation length of liquid scintillator solvent LAB
- Solution of the finite slab criticality problem using an alternative phase function with the second kind of Chebyshev polynomials
- Determination of water equivalent ratio for some dosimetric materials in proton therapy using MNCPX simulation tool
- Application of Monte Carlo method to calculate the effective delayed neutron fraction in molten salt reactor
- Analysis of beryllium poisoning effect on liquid metal reactor with U-Be alloy fuel