InSocialNet: Interactive visual analytics for role–event videos
2019-02-27YaohuaPanZhibinNiuJingWuandJiawanZhang
Yaohua Pan, Zhibin Niu(), Jing Wu, and Jiawan Zhang
Abstract Role—event videos are rich in information but challenging to be understood at the story level. The social roles and behavior patterns of characters largely depend on the interactions among characters and the background events. Understanding them requires analysis of the video contents for a long duration, which is beyond the ability of current algorithms designed for analyzing short-time dynamics. In this paper, we propose InSocialNet,an interactive video analytics tool for analyzing the contents of role—event videos. It automatically and dynamically constructs social networks from role—event videos making use of face and expression recognition,and provides a visual interface for interactive analysis of video contents. Together with social network analysis at the back end, InSocialNet supports users to investigate characters, their relationships, social roles,factions,and events in the input video. We conduct case studies to demonstrate the effectiveness of InSocialNet in assisting the harvest of rich information from role—event videos. We believe the current prototype implementation can be extended to applications beyond movie analysis,e.g., social psychology experiments to help understand crowd social behaviors.
Keywords visual analytics; behavioral psychology;role—event videos; social network; video analysis
1 Introduction
Videos provide temporal information in addition to the visual appearance presented in images. The temporal information enables analysis of dynamic changes and has boosted a wide range of computer vision research, e.g., facial expression recognition,action recognition, and tracking [1—3]. Most analysis tasks in computer vision focused on analyzing the dynamics in short time duration. In social science and behavior psychology domains, it is interesting and important to analyze social interactions among people, which also benefit from the temporal information in videos [4]. Mining and extracting social relationships require analysis of videos over a long time duration, which is a burden for users accessing the information. As a result, automatic visual data mining from long-duration multimedia data has been an important tool for social and behavioral studies [5—8]. Among multimedia data,role—event videos are of special attention.
Role—event videos, as the name suggests, have two main elements: roles and events. Different from biography or documentary videos which may emphasize one of these elements, in role—event videos,characters and events are interdependent and jointly promote the development of the storyline. This interdependence enables the analysis of characters’social roles and their relationships to assist the understanding or even prediction of events. Since many characters are involved in these videos, taking different social roles in the events, the intricate relationships constitute complex social networks,making it challenging for computers to understand the contents of the video at different levels and from different aspects. Therefore, we believe involving users during the analysis would better cater to the requirements of different tasks. In this paper, in addition to the construction of social networks from videos, we propose an interactive video analytics tool namedInSocialNet, to assist analysis of the constructed social networks.
InSocialNet is developed for long duration role—event videos such as movies, and with an emphasis on analyzing the relationships among characters and more importantly the evolution of these relationships.
The main difference between our work and the existing ones [5] is that we construct a social network that is updated dynamically with the progress of the video. When new characters or relationships appear in the video, nodes and edges are dynamically added into the social network. This enables us to observe the formation process of the social network and the evolution of relationships between characters. We use node2vec[9]to represent each node in the constructed social network as a high dimensional vector which encodes both the attributes and the social structure of the character at the node. Then t-SNE is used to reduce the high dimensional representation into two dimensions to visualize the clusters formed by nodes and enable interactive analysis of factions.
Case studies on two classic role—event videos have shown that the analysis results from using the developed tool are generally consistent with the storylines in the videos, demonstrating the effectiveness of InSocialNet. In summary, the main contributions of our work are:
·We propose a framework integrating visual analytics, social network analysis, and video processing for the purpose of understanding the contents of role—event videos. We believe it can provide a pathway to deep understanding of behavior and activity patterns in role—event videos, and has potentials to support social psychology experiments.
·We develop a prototype implementation of the framework, named InSocialNet that supports users to investigate the characters, emotions,relationships, factions, and events, and demonstrates the effectiveness of the prototype tool using case studies.
·We propose a visualized faction detection method by combining graph embedding and t-SNE, and demonstrate that interactive visual analysis provides complementary information to automatic social network analysis.
The remainder of the paper is organized as follows:Section 2 reviews the related work. Section 3 presents the requirement analysis and Section 4 gives an overview of the system. Sections 5 and 6 specify the details of the system,including both the back end and the front end. Section 7 presents experiments and case studies to evaluate the system. Finally,Section 8 concludes the paper and provides possible avenues for future work.
2 Related work
Short-term activity analysis.Role—event videos usually span a long time duration which is necessary for analysis of social interactions. However, the majority of works on video analysis are on activities of short periods, such as the acquisition of human motion trajectory [10] and population density estimation [11]. Although these short period video analysis techniques have advanced progress, they cannot effectively mine useful information hidden in long duration videos. However, they provide support for our research on analysis of long time duration videos.
Social network based video analysis.The social network is a powerful tool to analyze highly coupled relationships in videos. Networks represented by interconnected nodes and links between them are good representations of complex typologies including social relations, genetic interactions, transportation,financial systems,ecology,and Internet. The dynamic construction of social networks from video provides a clear and intuitive way to observe the relationships between the characters,and understand the evolution of the storyline.
Recently, some works began to make use of social networks for analysis of relationships among characters in long duration videos. StoryRoleNet was proposed to construct an accurate and integral network representing the relationships among characters, which are represented by both the appearance and the names extracted from the subtitle texts in video [5]. The work reported in Ref. [12]utilized the technique of face recognition and built social networks of many public characters appeared in news in the last decade to assist understanding the Japanese media.
Other related works include: Ref. [4], which used social networks to evaluate female roles in movies over the past century, and Ref. [13] which established social networks of vehicle trajectories in urban environments to prevent the occurrence of terrorist activities. Although the above works used social networks for analysis of the evolution of character relationships or networks in videos, the study has not risen to the social level.
Social role discovery.Characters in videos usually belong to certain communities. Recent works on community detection were able to divide key characters in video into factions based on social networks, with the aim to help social role discovery [14]. These community detection methods are based on topological analysis [15, 16] and flow analysis [17, 18]. RoleNet [19] constructed roles’social networks and determined the leading roles and their corresponding communities automatically.The work in Ref. [20] proposed a framework that can automatically understand the role assignment without training role labels and identify social roles by interactions between people.
The work in Ref. [21] recognized the social relationships covering all aspects of social life from the perspective of social psychology. These works on social roles and social relations can help us better understand the content and events in videos. In this study, we combine node2vec and t-SNE [22]instead of community detection algorithms. Thus the result shows the relative position of each node in two-dimensional space. It no longer gives the absolute partition, but indirectly shows the possible clusters of nodes by coordinates. We will show comparisons of the partition results from our method and other popular community detection algorithms by analyzing movie videos.
Human behavior analysis.Analyzing videos to detect and determine temporal and spatial events has always been an important research topic. Most of the research is about feature extraction and structure identification to support high-level applications such as video retrieval, summarization, and navigation.The work in Ref. [23] analyzed parent—infant interaction behaviors to extract relevant social signals,while in Ref. [24], the authors proposed a predictive field model framework to predict the roles’ gaze behaviors in a social scene. In Ref. [25], a supervised framework to recognize human and social behaviors was presented. In our work, video events manifest as the emergence of key characters and the changes of people emotions.
Role sentiment analysis.It is challenging to recognize the emotions of characters in videos.However analyzing the emotional changes of characters helps understand the development of events.The work in Ref. [26] analyzed and summarized the emotional differences between eastern and western individuals. Based on quantified satisfaction scores from customers,the work in Ref.[27]made an overall assessment of emotions in video by combining both the audio and visual components. However,few works have linked the emotional changes of characters to the events in the video. Our work combines the emotional dynamics with the first appearance time of characters,which will support the prediction of major events in video by observing the fluctuations of emotion.
3 Task analysis
We conducted interviews with potential users of InSocialNet and summarized their requirements,which supported our design rationales of the system.In detail, we conduct interview with two potential users of the system.Uais a social behavioral psychologist in the university andUbis a professor of mechanical engineering who is currently doing research on worker’s collaboration analysis under Industry 4.0 in the industrial management sector.Uahas a strong demand for a more powerful tool for content analysis in role—event videos to assist research in the psychological domain. Role—event videos play an important role in conducting psychological experiments. Many role—event videos have been and will still be recorded for this purpose.Uamentioned an example, the famous Stanford Prison Experiment①https://en.wikipedia.org/wiki/Stanford prison experiment, where twenty-four male students were selected to take on randomly assigned roles of prisoners and guards in a mock prison to investigate the psychological effects of perceived power. He is interested in their different personalities, the influence from key roles, and the flow of interactions between the characters. He advocates a tool that can automatically extract complicated interactions,
and facilitate all the above analysis tasks.Ubis working on intelligent manufacturing and would like a tool that can help gain in-depth understanding of human factors that affect the efficiency of factory production. Currently, they need to manually record the emotions of workers,the interactions among them,and collect information by questionnaires. A tool that can automate the process and assist understanding of the video contents has been considered very useful by them. Based on the interviews above, we summarize the analytic tasks as follows.
·Task 1.Inspect key roles,their personalities,and their social network. Role—event videos usually have long duration activities involving a number of characters. Recognizing key characters helps narrow down the analysis space. Identifying the social roles and the factions of the key character,understanding their personalities and behavior patterns, and quantifying their social influence help gain insights of the video in absence of prior knowledge.
·Task 2.Inspect how the characters are grouped into factions. A faction refers to a group of people,especially within a political organization, who expresses a shared belief or opinion different from people who are not part of the group. Sometimes,the faction is implicit, and requires inference from their social behaviors. Faction inspection requires to mine all possible clues to discover the group information of characters by how they are acting for the common interests of this faction.Sometimes, it is particularly challenging because characters may hide their real intentions for a secret action such as activities of spy or agent.
·Task 3.Inspect how the roles prompt the event and fight for their common interests. Some of the key characters from different factions prompt the event. Comprehensive consideration of the dynamic changes of characters and events gives insights to understand what has happened and to learn a better strategy from the event.
The design of the system is based on the above analysis. We derive the following design rationales.·Rationale 1.Social network based visual representation and interaction-based behavior analysis of the characters. The social network among people is always dynamically accumulated.All activities among people are mined based on the social network. Following Ben Shneiderman’s mantra, the social network with information encoded should be visualized to give an overview first with more fine details enabled by filters(Task 1).
·Rationale 2.Visualize the metaphors intuitively.Different from the majority of previous works in the computer vision communities, our work aims to describe the characters’ personalities,factions, social activities, which are all high-level abstraction of the video contents (Task 1, Task 2,Task 3).
·Rationale 3.Support coordinated visual analysis.The system should support coordinated visual analysis for inspection of characters, their social roles and factions, and how their interactions prompt events (Task 1, Task 2, Task 3).
4 System overview
Based on the task analysis, we design and implement the visual analytics prototype system, InSocialNet(Fig. 1). Specifically, it consists of two parts.
Back end social network construction.It supports a sequence of operations including face detection and recognition,attribute extraction,social network construction, network analysis, machine learning based closeness analysis, etc. The system takes videos as input. For each frame, if faces are detected, they are recognized as either existing or new characters compared with the stored ones. The stored characters and the extracted attributes are then updated based on the detection or recognition results, and the social network will be dynamically updated by the co-occurrence of characters.
Front end visual interaction.The results of detected characters, constructed social network, and other information are stored as log data and output into the visualization module. The visualization is supported by several mining techniques including node2vec, t-SNE, etc. It provides information at three levels from the individual character to local and global social networks, which is presented in three linked views. The visualization enables users to effectively discover the main clues from complex relationships, and analyze behavior patterns in both event and temporal dimensions. Rich interactions are provided to support analysis along with the timeline at different levels.

Fig. 1 Our InSocialNet system architecture. The back end detects individual characters, builds and updates a social network along with the progress of the video. The front end visual interactive interface enables users to explore the hidden information of the characters,among them and during events.
5 Back end: Construction of social networks
In our work, social networks are constructed as undirected weighted graphs with each node representing an individual character, and edges representing relationships between characters. Nodes and edges are added dynamically with the progress of the video.
Identifying characters.Identifying characters from video frames is the first step to constructing social networks. Characters are identified by their faces. The identification step consists of face detection, face recognition, and attribute extraction.Face detection is achieved using a deep learning based method which can handle occlusions well[28]. Detection is performed at an interval of one second to detect faces in video frames and return coordinates of detected areas and landmarks of detected faces. Images of detected faces are then compared with characters already detected and stored(we use MongoDB in our prototype platform),making use of the method [29] where different face features are extracted to calculate the similarity. For each detected face, the results of face recognition are confidence scores for the detected face to belong to every stored character. If the highest score is lower than a threshold (which is not static, this is,the threshold returned by each comparison is not necessarily the same, but the error recognition rate of each threshold is one in ten thousand), the face is recognized as the first appearance of a new character and is assigned a new token. Attributes including stable ones (gender, age, and race) and dynamic ones(expression and eye status)are extracted using a CNN(Convolutional Neural Network). These attributes together with the detected face image and time of appearance are stored. If the highest score is above the threshold, the face is recognized as the stored character with the highest score and is assigned the same token. The dynamic attributes are then extracted from the detected face and used to update those that are stored. With the progress of the videos,more and more characters will be added to the social network.
Establishing relationships between individuals.Edges in the social network represent the relationships between individuals. In this prototype implementation, the relationship is established as the co-occurrence of characters in video frames. The weight of an edge is proportional to the frequency that the two connected characters appear in the same frames. The current approach uses a simple assumption which works reasonably well in most cases,and better strategies will be investigated in future work. In the implementation,when multiple faces are detected in a frame,in addition to updating attributes or recording new individuals, edges between pairs of these individuals are added or updated with increased weights, together with the time of cooccurrence. Characters, relationships between them,and the constructed co-occurrence social network are updated dynamically with the progress of video and are fed into the visualization module to allow interactive analysis and exploration of the evolution of relationships and events.
In addition, users can manually select the time of interest and inspect dynamic changes of individuals and relationships during the selected time span.
6 Front end: Visual interactive analysis
The design of the visualization is driven by the requirements summarized in Section 3. In role—event videos, the character of interest is often the starting point of attention and this inspires the design of the visualization from individual characters to local and global views, providing links among the several views developed. To support investigating the evolution of events further encourages the development of interactive analysis along the temporal dimension.An overview of the visual interface is shown in Fig. 2.
6.1 Visualization of social networks
At the core of the interface is the visualization of the co-occurrence social network (Fig. 2(A.2)).
We choose to use the algorithm [30] with a force directed graph to draw the co-occurrence social network. The drawing algorithm assigns attractive/repulsive forces among edges to attract or separate nodes in order to achieve a layout with roughly equal length edges and as few as possible crossings.

Fig. 2 InSocialNet system. The design follows Shneiderman’s mantra. View A gives an overview of the video and the co-occurrence network constructed. The tool enables users to backtrack how the network is constructed by controlling the synced time slider. View B enables users to rank the characters by various measures. View C is the main inspection explorer. It employs three coordinated views to support the inspection and analysis of key roles and relationships, events and factions, and changes of emotions.
While the video is playing, the drawing algorithm is executed continuously at an interval of one second,which dynamically updates the nodes and edge to enable observing the development of the cooccurrence social network. A progress bar is also provided for users to select a time point in the video based on which the force directed graph is redrawn,such that users can inspect the network more closely at that time point.
In addition, the system replaces all nodes of the force directed graph with the corresponding face images and adds drag and zoom functions to nodes.These assist more clear and intuitive observation of characters’ attributes and understanding of their social roles from the relationships between them.
6.2 Interface design
Three views(Fig.2)with different scopes of attention constitute the main part of the visualization.
View Ashows the video and visualizes the cooccurrence social network according to the time in the video. Users are able to track the evolution of the network by controlling the time slider. The co-occurrence social network is displayed as a force directed graph as mentioned above. If a characterof-interest is selected, the display focuses on the co-occurrence network that the selected character resides in, showing all the characters and weighted connections that are associated with the characterof-interest.
View Blists all the characters that have appeared up to the time point. The characters are ranked and ordered in the list, and a drop-down menu is provided to enable users to rank roles based on one of the following three scores: (1) Node degree which measures “activeness”, i.e., how many interactions each character has with others. (2) Authority score which measures the social “standing” of each character in the network. As a kind of network centrality, the authority score is popularly used to measure the “importance” of web pages but has also been related to measuring “standing” in social networks [31], which is the case in our work. For an undirected graph, the authority scores of the nodes are defined as the principal eigenvector ofATAwhereAis the adjacency matrix. (3) The estimated age of the character.
In the character list, the attention is on individual characters. Ranking the characters based on the various scores facilitates the identification of more active and authoritative persons, which helps understand the main plots of the story.
View Cis the inspection explorer, the main part for users to explore the relations, emotions, the atmosphere,etc. of the story in the video. It includes the following modules.
View C.1is for character—event inspection. We use a 2D scatter plot to contrast each role’s authority score vs. the role’s attributes such as time of first appearance, duration of appearance, age, etc. This plot enables users to find out which attributes are closely related to the authority of roles, which will in turn help with the identification of authoritative characters based on their attributes.
View C.2is for faction inspection. In a faction,characters are connected to each other and they tend to have similar network structures. As a result, for faction analysis, the information required for each node is not only the attributes of the character,but also the structure of its social relations. To model both pieces of information, we make use of node2vec [32], a graph embedding algorithm, to get a high-dimensional vector representation for each node. Then, t-SNE is used to project the highdimensional representation into 2D coordinates for users to observe potential factions in the inspected co-occurrence social network.
View C.3is for emotion analysis. It shows the dynamic changes of expressions of any selected characters with an emotion string breed chart where the emotions are presented by a breed and they are strung together via a time string. If no characters are selected, it shows the dynamic changes of expressions of all characters up to the current video time. The breed refers to detected emotions encoded with symbolic colors—anger (red), disgust (purple), fear(black), happiness (green), neutral (grey), sadness(blue), and surprise (orange).
The emotion string breed not only shows the overall emotional changes but also provides abundance of information that enables analysis of many aspects about the characters and the story. For example,from the emotional distributions, we can infer useful information such as the inner feelings of a specific character at different time [26], the dispositions of the characters, and the atmosphere of the story.
6.3 Interactions supported
Interactive operations are provided to users to support exploration of implicit patterns. Specifically,the provided interactions include:
(1) Mouse hovering.When the mouse hovers over a node in the co-occurrence social network in View A.2, the view will display the nodes that are connected with the hovered node, together with weights of the connections, while hiding the nodes that are not connected.
The benefit of this feature is to enable a better observation of sub-networks in a complex social network.
(2) Single clicking.When clicking a node (a character) in any view, an “attribute table” will display the attributes of the selected character for users to inspect the details. When a character is selected in one of the views,it will also be highlighted in other views to allow observation of different aspects of the same character to achieve a comprehensive analysis.
(3) Multiple selection.The brush function is provided in faction analysis (View C.2) for users to select multiple characters simultaneously. This multiple selection allows investigating whether the clustering results are consistent with the social network structures. It also enables observation of emotional changes within a group, comparison of attributes among a group, etc.
7 Evaluation
In this section,we first compare the results on faction detection using our method (Section 6.2, View C.2)and other community detection algorithms. We then demonstrate the usefulness of the developed tool through a representative case study. The following two role—event videos from different culture backgrounds are used for the evaluation.
“Romance of the Three Kingdoms”is a classic Chinese TV series. The story is set during the years towards the end of the Han dynasty and the Three Kingdoms period (169—280 AD) in the history of China①https://en.wikipedia.org/wiki/RomanceoftheThree Kingdoms. In the evaluation, Episode 4 is used. The episode is about the union of the eighteen feudal princes, including the three main force leaders Cao Cao, Sun Jian, and Yuan Shao, discussing how to attack Dong Zhuo, the ghostly prime minister.And Dong Zhuo decided to lead the army himself to revenge on the union when he was acknowledged that his general Hua Xiong was defeated by Guan Yu.Through the back end processing, we got a total of 43 characters and 43 relationships from this episode.The co-occurrence social network was dynamically constructed.
“Harry Potter”is a series of movies based on the eponymous novels by British author J. K. Rowling.The series tell the magical story of the protagonist Harry Potter, who studies, lives, and fights at the Hogwarts School of Witchcraft and Wizardry. Used in evaluation is the episode of “Harry Potter and the Goblet of Fire”, which is around the conspiracy of death eaters. The first half of the episode is about the Triwizard Tournament which was bustling with noise and participants from all three schools. In the second half, Harry Potter was transferred to the base of death eaters to revive voldemort, the master of death eaters. The back end processing harvested a total of 67 characters and 214 relationships, from which the co-occurrence social network was constructed.
7.1 Experiments on faction detection
There are existing community detection algorithms[33, 34] that aim to identify highly connected groups from social networks. We carry out experiments on the two videos to compare the detection results from our graph embedding plus t-SNE method with those from the principal community detection algorithms,including label propagation [18], infomap [35], edge betweenness [15], multilevel [36], leading eigenvector[16], and walktrap [17]. Detection results on key characters with the highest authority scores are shown in Fig. 3 for the “Three Kingdoms” video and Fig. 4 for the“Harry Potter”video. Each color in the figures represents a detected community/faction.
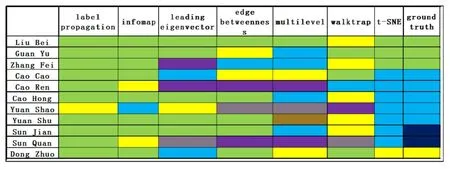
Fig. 3 Faction detection by community detection algorithms and our method for the analysis of “Romance of the Three Kingdoms”.
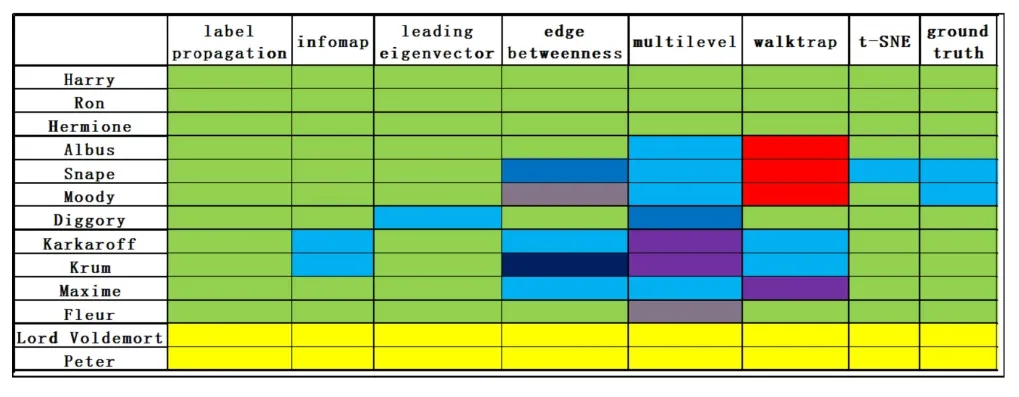
Fig. 4 Faction detection by community detection algorithms and our method for the analysis of “Harry Potter”.
An immediate observation is that different algorithms detect communities at different fine levels.Label propagation algorithm is at the coarsest,dividing the key characters from both videos into two groups only,while the algorithms of edge betweenness,multilevel, and walktrap divide the characters into more and finer groups. Others including our method are in between.
Observing the results on “Romance of the Three Kingdoms” more closely, we found that the most famous faction of Liu Bei, Guan Yu, Zhang Fei was mistakenly split using the algorithms of leading eigenvector, edge betweenness, multilevel,and walktrap. In addition, the algorithms of leading eigenvetor, multilevel algorithm, and walktrap group Dong Zhuo, the enemy of the allied force, into the faction of Cao Cao who is a leader of the allied force, which is also inconsistent with the storyline.Compared to the community detection algorithms,our method demonstrates its superiority for this video.Our method is the only one that correctly separates the faction of Dong Zhuo (including Dong Zhuo and Lu Bu) from the faction of the allied force, and specifically groups Liu Bei, Guan Yu, and Zhang Fei into an exclusive faction.
Turning our attention to the results on the“Harry Potter” video, we first noticed that Peter and Voldemort were correctly grouped together by all the algorithms including our method. The constructed social network (Fig. 5) shows that the two characters mainly interact with each other and have few interactions with others in this episode. This demonstrates the effectiveness of all these algorithms on detecting exclusive factions.
It is also observed that Harry, Ron, and Hermione,collectively called theHarry Trio, are grouped into the same faction but not exclusively. They belong to a faction that include other pupils and teachers. It is especially so for algorithms of label propagation,infomap, leading eigenvector, and our method, which group the trio and almost all the others into one faction.
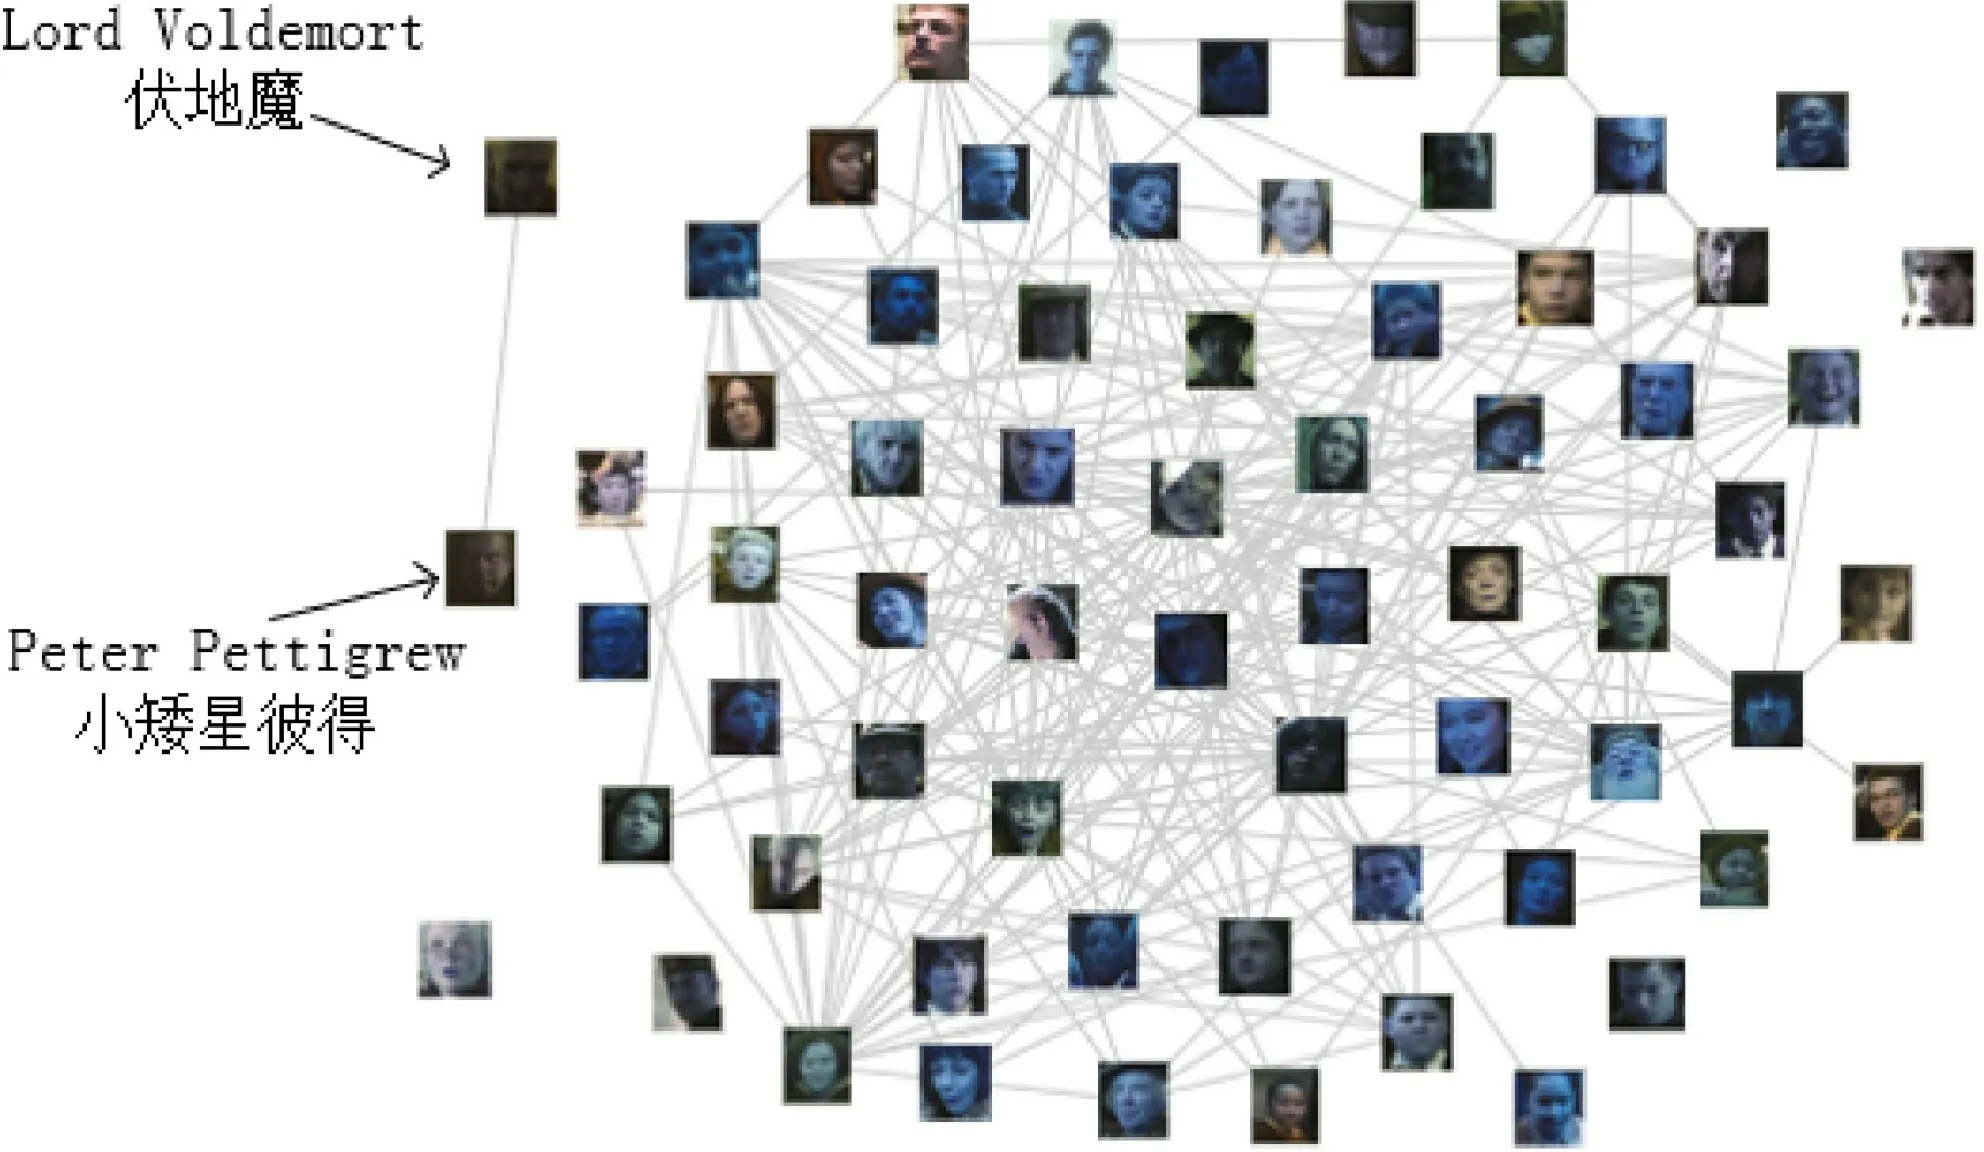
Fig. 5 The constructed social network of “Harry Potter”. It shows that voldemort and Peter are only connected with each other, but not to other characters.
The other three algorithms divide the teachers and pupils into finer factions, however, with some randomness for this video. The Harry Trio is part of the bigger faction formed by teachers and pupils.But the results here demonstrate a limitation of community detection algorithms, i.e., they cannot detect hierarchical factions. An advantage of our method over community detection is visualization.Making use of graph embedding and t-SNE, our method visualizes the distribution of factions and enables the identification of smaller factions inside bigger ones by interactive visual inspection.
7.2 Case study
To demonstrate the effectiveness of the developed tool for analysis of role—event videos, we used the above two videos as examples, and used the tool to interactively discover the key characters, their personalities, the factions, and the activity patterns from the input video. The discoveries were then compared with the video contents to verify their consistency. Due to the limited space, here we present the case study on the “Romance of the Three Kingdoms”.
7.2.1 Inspection of key characters and relationships
We first want to identify and analyze the most important characters in the video. In the character list (Fig. 2(B)), we sorted the characters according to their “authority” scores and found the character of Cao Cao ranked the first. The co-occurrence social network as a whole (Fig. 2(A.2)) further confirms the key role of Cao Cao with his central position in the network. We thus selected this character to observe his interactions with other characters and analyze their relationships.
Figure 6(a) shows the co-occurrence network associated with Cao Cao. We immediately noticed the exceptionally high weight of the connection between Cao Cao and Cao Ren, indicating very frequent interactions between the two. We also noticed that Cao Ren was ranked with the second highest“authority” score. To further inspect the relationship between the two important characters,we first turned to the Faction View (Fig. 2(C.2)) and found that the two characters belonged to the same faction. We then switched between selecting Cao Cao and Cao Ren and observed their co-occurrence social networks.We found that Cao Ren’s co-occurrence network is largely a subset of Cao Cao’s (Fig. 6(b)). Thus so far, we can infer that Cao Cao and Cao Ren work closely in the same faction, and Cao Cao is at a more senior position than Cao Ren. For those who are familiar with the story of “The Three Kingdoms”,this inference above is easily verified, as Cao Cao is indeed one of the most important roles in the story,and Cao Ren is his cousin and right-hand man.
We continued exploring the co-occurrence social network of Cao Cao and checking in the faction view.We noticed some characters in the same faction with Cao Cao had frequent co-occurrence with him but almost no connections with others. An example is a character at the bottom of Fig. 6(a). Figure 6(c)shows the co-occurrence network of this character.We speculated from this exclusive co-occurrence that this character was a guard of Cao Cao. We checked the first appearance time of this character in the event view (Fig. 7(a)), and watched the video from then.From the video,the soldier was following Cao Cao and Cao Ren on the way to visit Liu Bei, which explained the frequent co-occurrence of the soldier with Cao Cao and Cao Ren. The character is indeed a guard soldier of Cao Cao. This again demonstrated the effectiveness of InSocialNet to analyze relationships between characters.
7.2.2 Inspection of events
In the Character—Event Inspection view(Fig.2(C.1)),we compared the authority scores against the time of first appearance and the total duration of occurrence.As shown in Fig. 7, we observed that the earlier the character appears, the more likely this character has higher authority, which means more likely to be an important character in the entire video. We also observed that most of them appeared a longer duration than others.
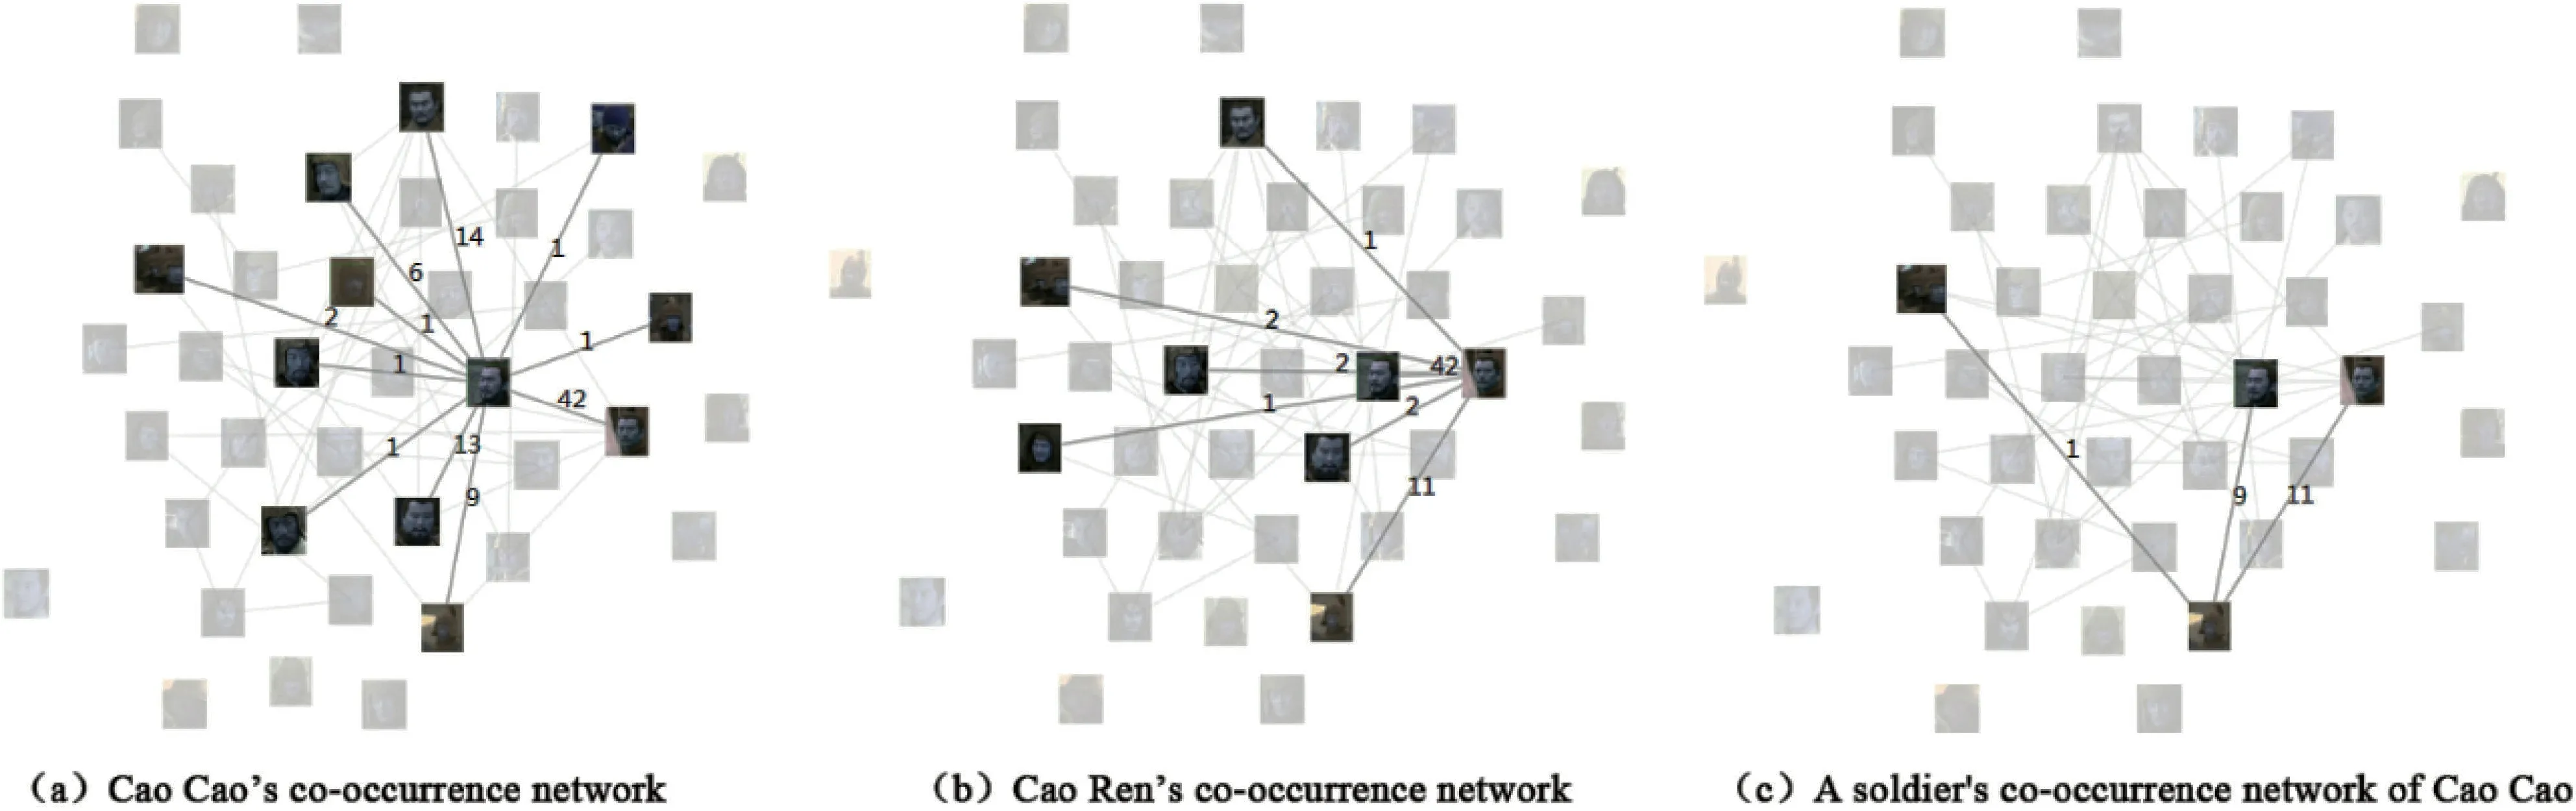
Fig. 6 (a) Cao Cao’s co-occurrence social network. Cao Cao is the most authoritative person, indicating that the number of roles associated with him is the largest. (b) Cao Ren’s co-occurrence social network is largely a subset of Cao Cao’s, which shows that his position in the faction is lower than Cao Cao’s. (c) Some characters in Cao Cao’s faction are only related to the important roles such as Cao Cao and Cao Ren.
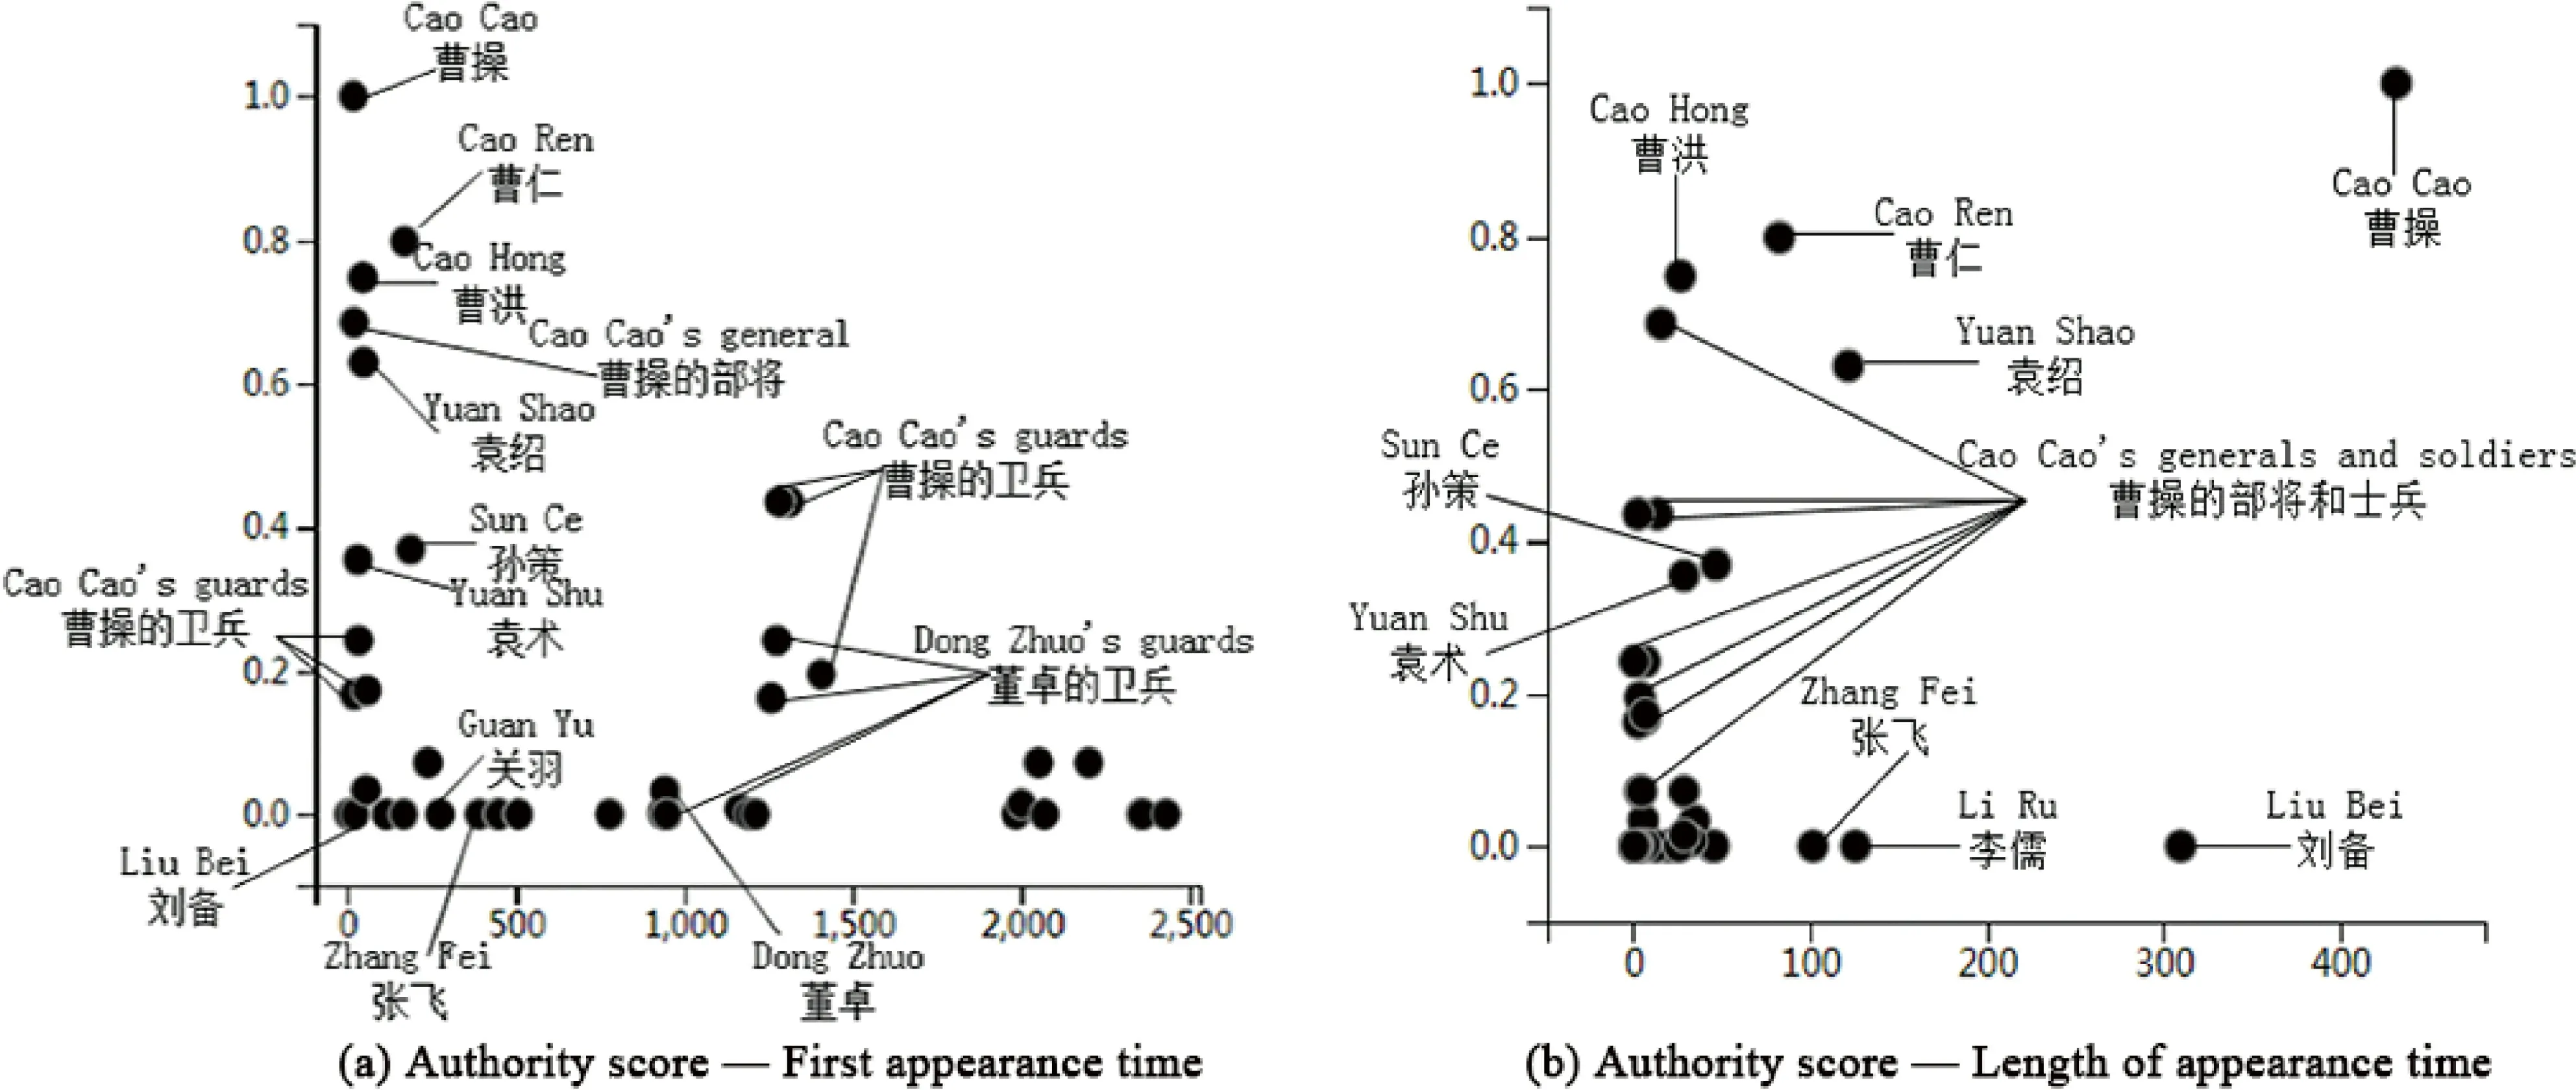
Fig. 7 (a) The Character–Event Inspection view (authority score vs. first appearance time) shows there are two major events: at the beginning and in the middle of the video. Further exploration shows that the first wave is the allied forces of princes planning to attack Dong Zhuo, the ghostly prime minister, while the second wave is about the resistance from Dong Zhuo. (b) The Character–Event Inspection view (authority score vs. length of appearance time) shows Cao Cao with his brotherhood are the main roles, and unsurprisingly, their generals and soldiers also have high frequency appearance.
In addition to the peak at the beginning, we observed a small peak in the middle of the video as well (Fig. 7(a)). Peaks are caused by intensive appearance of key characters, and often indicate important events. Checking the characters in the peaks, we further observed that the two events were happening to different factions of characters. The event at the beginning was among a union of factions including the faction that Cao Cao resided in. While the later event was more focused in one faction as shown in Fig. 8.
Watching the video, in the first five minutes, Cao Cao and his allies, including Yuan Shao, Sun Jian,Liu Bei, and many other generals and guards, were discussing the strategy of attacking Dong Zhuo. And Liu Bei, Guan Yu, and Zhang Fei were also standing aside. Then in the middle of the video, Dong Zhuo decided to defend with his own troops, and some of his soldiers appeared for the first time,contributing to the second small peak. These two events in the video cause the first appearance of many new characters,and correspond to the peaks in the event view.
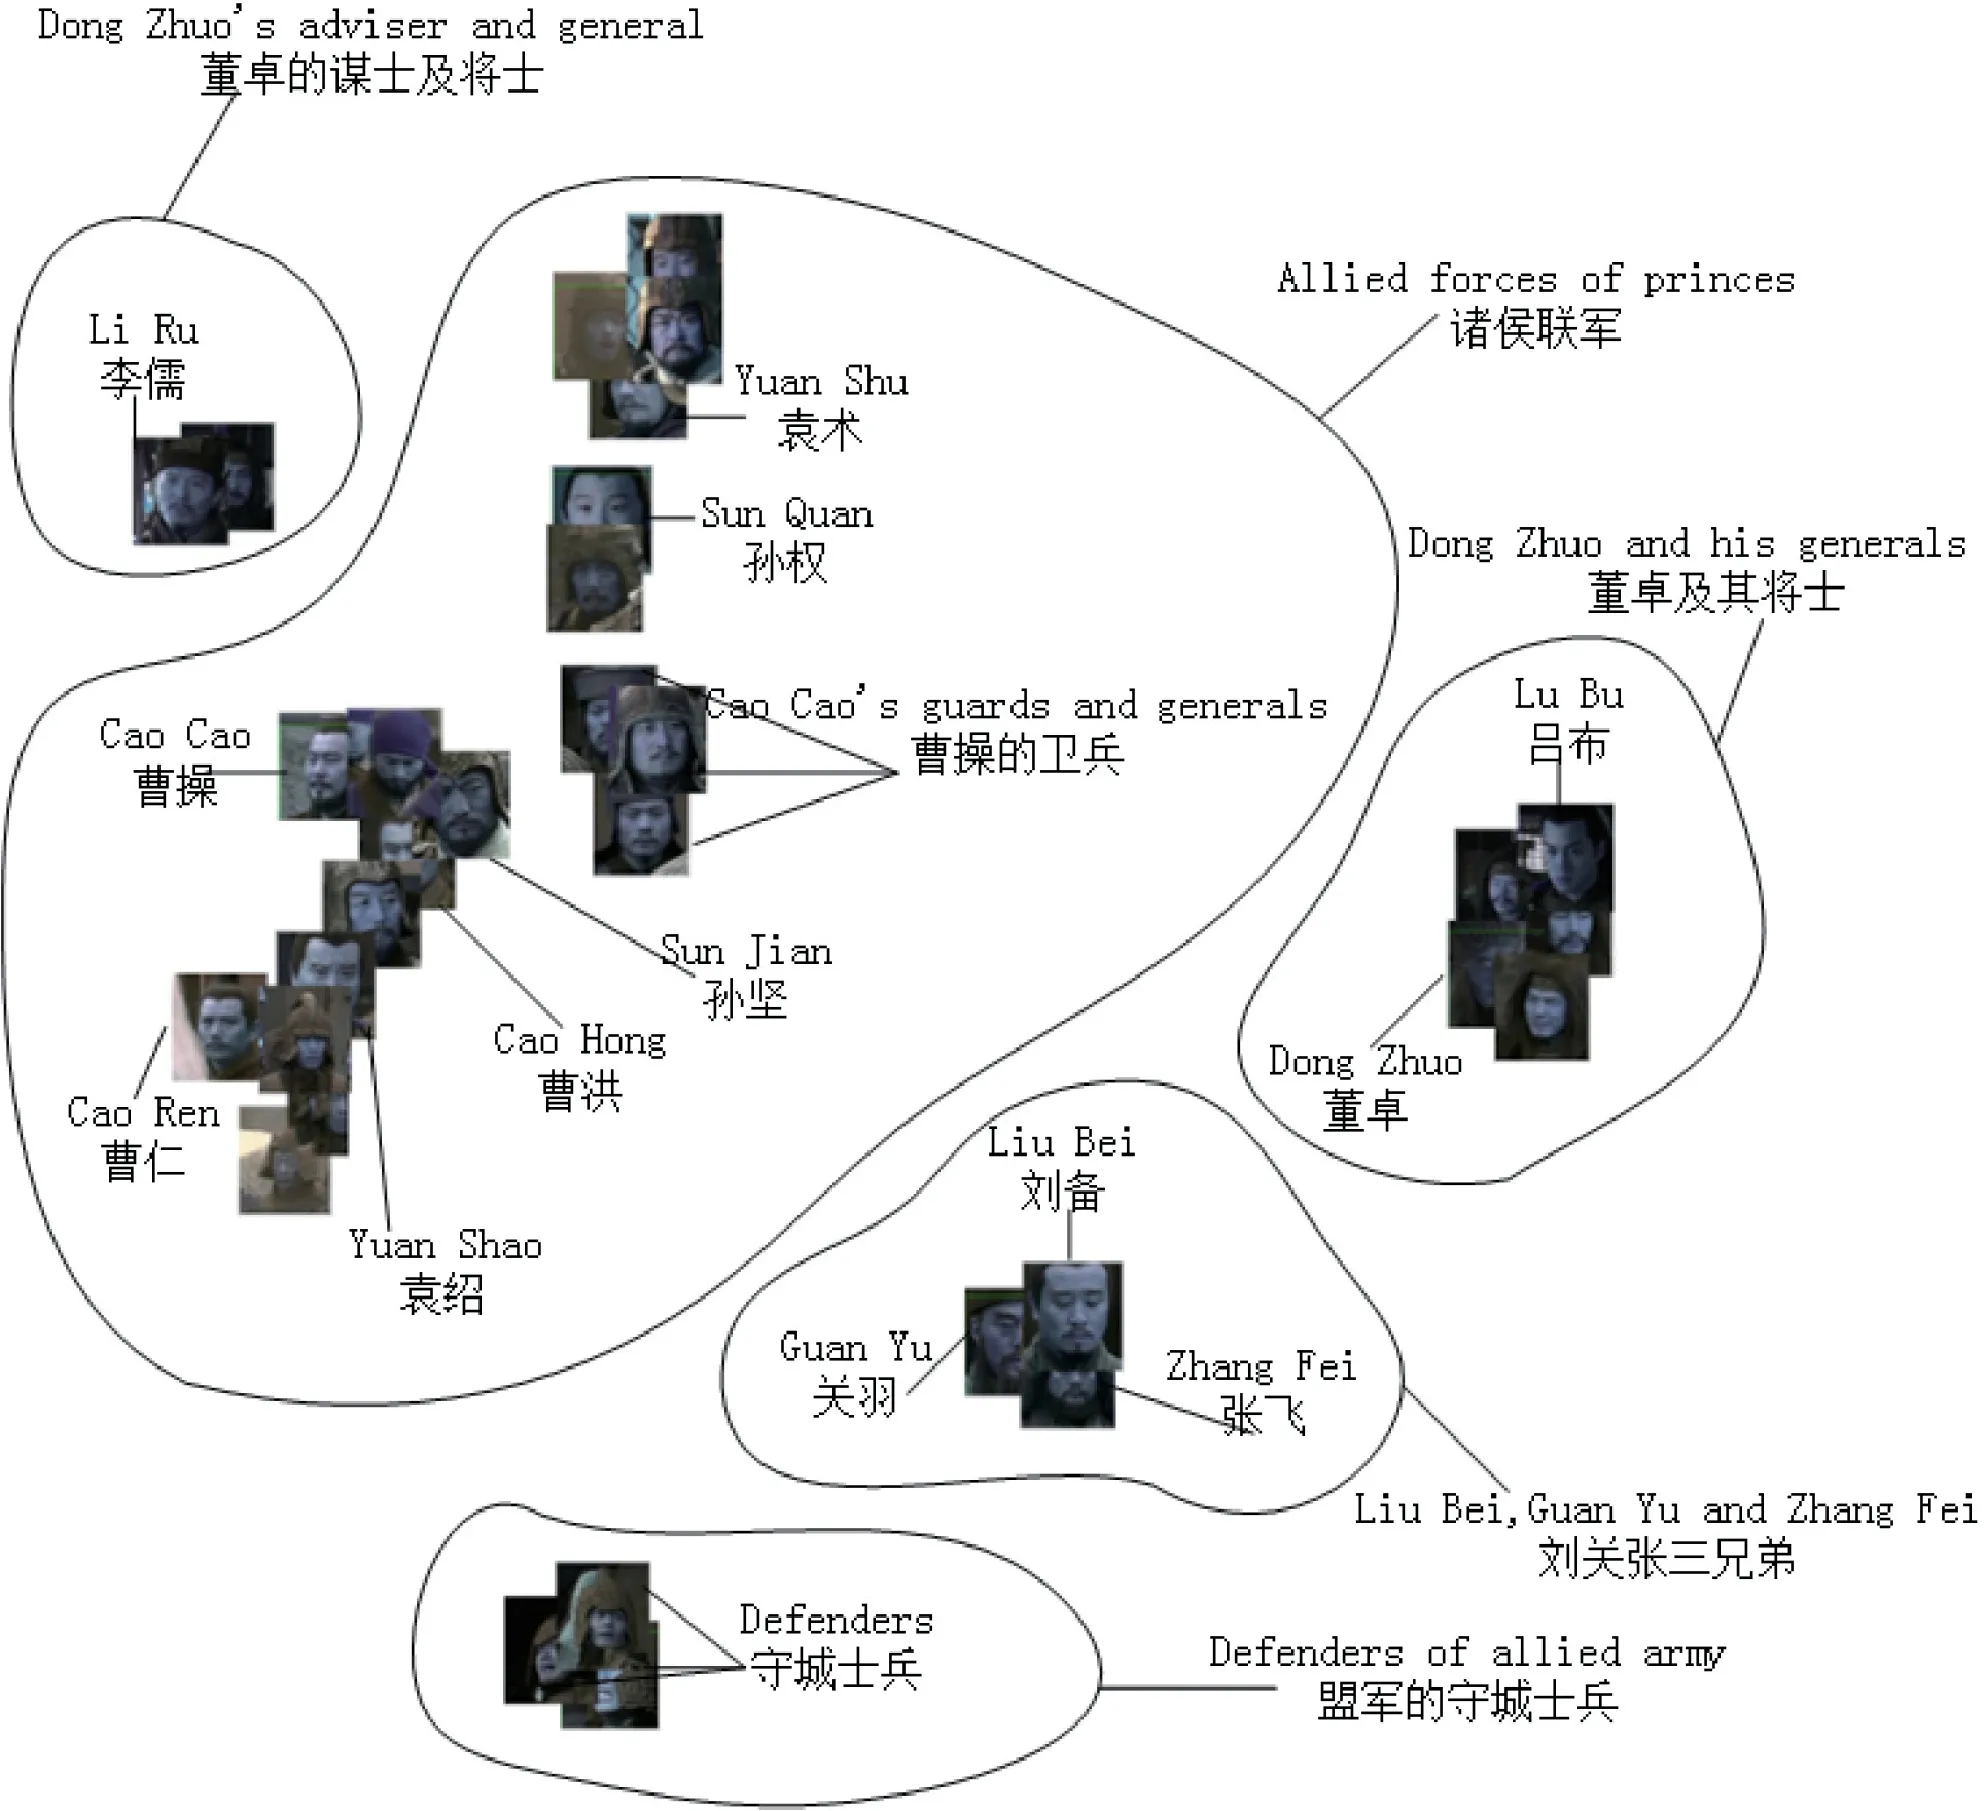
Fig. 8 The back end machine learning algorithms automatically cluster the characters into separated groups. The results of faction analysis show the emerging and potential factions in the video, where the closer the coordinates are, the more likely the characters belong to the same faction. The manually annotated results validate the correctness.
7.2.3 Faction analysis
Continuing the exploration in the Faction Inspection View (Fig. 8) and the event view (Fig. 7(a)), we further found that most of the characters in the faction of Cao Cao had a high authority score and appeared in the first five minutes of the video,indicating that the faction of Cao Cao has a high status in the video. This is consistent with the story of the video that Cao Cao and his allies are the main characters in this episode. But we also found in Fig. 7(a) that three characters, Liu Bei, Guan Yu,and Zhang Fei, although they appeared early in the video and in the same time period as other characters in Cao Cao’s faction, they did not belong to the faction of Cao Cao in Fig. 8, and their authority scores were very low. Checking their co-occurrence networks (Fig. 9), we further observed that these three characters are closely connected to each other,but not with others. This indicated that the three characters formed a small independent faction which participated in the event at the beginning, but had little interactions with others.
Watching the video, it is confirmed that in this episode,the small faction of Liu Bei,Guan Yu,Zhang Fei had just appeared and was insignificant at that time. Because of their low political positions, no authoritative characters had much interactions with them, resulting in their low authority scores.

Fig. 9 Liu Bei, Guan Yu, and Zhang Fei are closely connected to each other, but not with others. So although their first appearances are in the same time period with other characters in the faction of Cao Cao, their authority scores are low.
Three more factions are also formed in Fig. 8.Clicking on each character in these factions, the detailed information of the character is displayed in the info panel, helping with the identification of their roles. Checking the video,we found the faction named“Defenders of allied army” includes the guard soldiers of Cao Cao (noted that the factions and the names are labeled manually for a better illustration of the results). Because they are far away from Cao Cao and other princes, but closely related to each other, they are separately divided into a single faction. The other two factions, named “Dong Zhou and his generals”and “Dong Zhou’s adviser and general” are both formed by characters closely related to Dong Zhou,which is another key role in the story. Ideally,the two factions should merge into one. But as Dong Zhou’s adviser and the general did not appear together with Dong Zhuo and others in this episode, they were separately divided. With the analysis extended to more episodes,the two factions should merge together.In general,the t-SNE algorithm divides the characters into meaningful factions, providing complementary information to the co-occurrence networks.
7.2.4 Analysis of atmosphere and emotion changes

Fig. 10 Emotion Inspection view gives an overview of the atmosphere and also supports the visualization of “the shape of the personalities”of different characters. It can be seen that there are more negative emotions in the first half of the video, and more positive emotions in the second half.
With the Emotional Evolution view (C.3), we can observe and explore how the story atmosphere changes. From Fig. 10, we can see that the emotions of“neutral”and“sadness”dominate the episode. This is consistent with the main theme of war in this video.We also observed that with the progress of the episode,the occurrence of the emotion “fear” decreased while the occurrence of “happiness” increased. It is again consistent with the story progress in this episode. The first half of the video described Cao Cao and other princes who were attacked by Hua Xiong and two generals were defeated, resulting in fears and sadness among Cao Cao’s allies. The second half is mainly about Cao Cao and Liu Bei discussing the situation,and the negotiation between Yuan Shao and Dong Zhuo. The overall atmosphere is relatively relaxed, so positive emotions appear more frequently among the characters.
In addition to analyzing the change of atmospheres,the interface enables users to explore emotion changes of individuals to better understand their personalities.Here, we analyze two main characters in the story:Guan Yu and Zhang Fei. The charts showing their emotional changes are displayed in Figs. 11(a) and 11(b) respectively. We can see that Zhang Fei’s emotion changes more frequently and dramatically,covering all the seven emotions, indicating a more emotional personality that Zhang Fei possesses. In comparison, the change of Guan Yu’s emotion is flatter, and his emotions are dominated by neutral with no happiness,indicating a more calm and serious personality. Watching the video, we can see their emotions change in accordance with the progress of the story. In the first half of the episode, their more negative emotions are triggered by both the war and the belittling remarks from the princes, whereas in the second half, Cao Cao’s visit and praise result in their more positive emotions.
Analyzing the dynamics of atmosphere and emotions enables users to better understand the progress of the story and quickly infer the personalities of characters. This function, when combined with more powerful mining algorithms in the future, may help users make predictions, which is especially important for the potential application of the technique to videos for monitoring purposes.
7.3 Informal user feedback
We conducted informal interviews with the two potential users (also refer to Section 3) of the system and asked them to give brief comments from the aspects of the usefulness, visual design, interactions of the proposed system.
Usefulness. Both experts confirmed the usability of our system.Uapraised the rationale of the social network centered design, as he believes social interaction is an important and unique element in human society. He has interest to try the tool for a psychological experiment.Ubcommented that with the tool, they would be able to obtain objective information and to explore more than what can be provided in the traditional way. Both experts highlighted the usefulness of faction analysis.Ubcommented “this is way beyond what questionnaires can do.” However,Ubalso expressed his concern on applying the approach to real industry surveillance video analysis, as it seems the face recognition approach is not robust when the camera is high over.The face recognition accuracy can be affected by many issues such as occlusion and lighting changes. He suggests that the future social network reconstruction can be based on gait recognition as the action maybe more reliable than faces in practice.
Visual design. Both experts were impressed by the interface. They appraised its conciseness and intuitiveness. They considered the linked views is an effectively way to organize information from overview to individual levels, revealing the hierarchical relationships.Uaespecially likes the colored visualization of characters’ emotions. He thinks it provides an intuitive way to help understand the characteristic personalities.

Fig. 11 Comparing the emotion changes of Guan Yu and Zhang Fei (zoom in for better view). Guan Yu is mostly calm. Even when he is sad,he shows few extreme emotions. On the other hand, his brotherhood, Zhang Fei, with a sharply contrasting emotion shape means that he is a person with distinct love and hate.
Interactions. Experts consider the interactive operations provided are intuitive and smooth, and meet their requirements for information exploration.Ubespecially commented on being able to watch the dynamic construction of the network, which enables him to capture critical moments for analysis.However,Uaexpressed his concern on the accuracy of faction analysis. The current system supports generating a relationship mapping using t-SNE but does not support further interactive exploration. And the discovery of hierarchical relationship, which is common in many social activities, has not been supported in the current system as well.Uasuggests to enhance the interaction in faction analysis to enable the discovery of more complex social relationships.
8 Discussion and future work
In this paper, we report some preliminary work by integrating visual analytics, social network analysis, and video processing for role—event video content understanding. We provide a prototype implementation and report case studies to demonstrate the usefulness of the tool. Although it shows promising results, we note there are still some limitations and they will be our future work.
Firstly, the co-occurrence based social network construction can sometimes be unreliable, as the cooccurrence does not guarantee a special relationship.Hidden activities for political affairs would be a challenge for the current prototype system. Link prediction based approaches such as Ref. [37] may provide a possible solution to fulfill the crucial missing links. More cues obtained by video processing such as emotions, verbal and body languages can help to re-weight the links.
Secondly, since the motivation of our work is to understand social roles and events from videos recording a long-time period, cross-video information would help with the construction of a more complete cross-time social network. Learning based interactive exploration will be developed to support sophisticated hierarchical relationship discovery. The complete social network can help to build a more comprehensive understanding of the roles, behavior patterns, events,and trends, and provide more accurate big pictures.
Finally, we believe real-time video analysis will have broad application domains. In the future, it is desired to have camera(s) attached to the system,and detect humans and perform subsequent analysis from the captured videos in real-time. It would be an important feature for picking up unusual behavior/activity patterns in time.
Acknowledgements
The research is supported by National Natural Science Foundation of China (No. 61802278).
Open AccessThis article is licensed under a Creative Commons Attribution 4.0 International License, which permits use, sharing, adaptation, distribution and reproduction in any medium or format,as long as you give appropriate credit to the original author(s)and the source, provide a link to the Creative Commons licence, and indicate if changes were made.
The images or other third party material in this article are included in the article’s Creative Commons licence, unless indicated otherwise in a credit line to the material. If material is not included in the article’s Creative Commons licence and your intended use is not permitted by statutory regulation or exceeds the permitted use,you will need to obtain permission directly from the copyright holder.
To view a copy of this licence, visit http://creativecommons.org/licenses/by/4.0/.
Other papers from this open access journal are available free of charge from http://www.springer.com/journal/41095.To submit a manuscript, please go to https://www.editorialmanager.com/cvmj.
杂志排行
Computational Visual Media的其它文章
- Computational Visual Media TOTAL CONTENTS IN 2019
- SpinNet: Spinning convolutional network for lane boundary detection
- A three-stage real-time detector for traffic signs in large panoramas
- Adaptive deep residual network for single image super-resolution
- Mixed reality based respiratory liver tumor puncture navigation
- Evaluation of modified adaptive k-means segmentation algorithm