Evaluation of modified adaptive k-means segmentation algorithm
2019-02-27TayeGirmaDebeleeFriedhelmSchwenkerSamuelRahimetoandDerejeYohannes
Taye Girma Debelee() Friedhelm Schwenker Samuel Rahimeto and Dereje Yohannes
Abstract Segmentation is the act of partitioning an image into different regions by creating boundaries between regions. k-means image segmentation is the simplest prevalent approach. However,the segmentation quality is contingent on the initial parameters (the cluster centers and their number). In this paper, a convolution-based modified adaptive k-means (MAKM)approach is proposed and evaluated using images collected from different sources (MATLAB, Berkeley image database, VOC2012, BGH, MIAS, and MRI).The evaluation shows that the proposed algorithm is superior to k-means++, fuzzy c-means, histogrambased k-means, and subtractive k-means algorithms in terms of image segmentation quality (Q-value),computational cost, and RMSE. The proposed algorithm was also compared to state-of-the-art learning-based methods in terms of IoU and MIoU; it achieved a higher MIoU value.
Keywords clustering; modified adaptive k-means(MAKM); segmentation; Q-value
1 Introduction
1.1 Overview
Segmentation is the act of partitioning an image into different regions by creating boundaries that keep regions apart. It is one of the most used steps in zoning pixels of an image [1]. After segmentation,pixels belonging to the same partition have higher similarity values, but higher dissimilarity with pixels in other partitions. Segmentation is a technique used in many fields including health care,image processing,traffic image, pattern recognition, etc. According to the review in Ref. [1], image segmentation techniques can be categorized into two types: layered-based segmentation and block-based segmentation. In layered-based segmentation, the image is divided into layers such as background, foreground, and mask layers. Reconstruction of the final image is decided using the mask layer [2]. This method is not widely applicable to medical image segmentation. Blockbased segmentation divides the image into unequal blocks using attributes such as color, histogram,pixels,wavelet coefficients,texture,and gradient[1,2].Block-based segmentation can be further grouped into methods based on discontinuity or similarity in the image. It can also be further grouped into three categories: region-based, edge- or boundary-based,and hybrid techniques [1, 2].
1.2 Edge-based segmentation
The discontinuous nature of pixels characterizes all algorithms in the edge-based segmentation family[2]. In this type of image segmentation, images are segmented into partitions based on unanticipated changes in gray intensity in the image. In most cases,edge-based segmentation techniques can identify corners, edges, points, and lines in the image.However, pixel miscategorization errors are the main limitation of the edge-based segmentation category.The edge detection technique is an example of this class of segmentation method [2].
1.3 Region-based segmentation
Edge-based segmentation techniques use the discontinuous nature of pixels. However, regionbased techniques use similarity of pixels in the image.Edges,lines,and points are attributes that decide the effectiveness of region-based techniques. Algorithms like clustering, splitting and merging, normalized cuts, region growing, and thresholding belong to the region-based segmentation family [1, 2]. Our main interest is in clustering algorithms. Schwenker and Trentin [3] presented traditional machine learning as supervised and unsupervised learning: supervised learning associates every observation of the samples with a target label whereas this is not the case in unsupervised learning. Clustering algorithms are very important, especially for unlabeled larger dataset classification [3]; they belong to the unsupervised category. However, there is another machine learning approach, partially supervised machine learning,which lies between unsupervised and supervised machine learning. A detailed review is given in Ref. [3].
1.4 Learning-based segmentation
Deep learning models are well known in object detection, feature extraction, and classification. In addition, semantic image segmentation or image labeling is also an area in which deep learning has been applied. Semantic segmentation is a technique in which semantic labels (like “cat” or “bike”) are assigned to every pixel in the image [4]. The most common models that have been applied to semantic image segmentation include FCN-8s [5], DeepLab [4],DeepLab-Msc [4], MSRA-CFM [6], TTI-Zoomout-16 [7], DeepLab-CRF [4], DeepLab-MSc-CRF [4],DeepLab-CRF-7x7 [4], DeepLab-MSc-LargeFOV [4],DeepLab-MSc-CRF-LargeFOV [4], and Front-End Modules [8]. Consecutive application of pooling in deep convolutional neural networks(DCNNs)reduces feature resolution and allows DCNNs to learn abstract representations of objects [9].
2 Related work
2.1 k-means segmentation
There has been much research on image segmentation for different application areas, using various techniques from conventional and learning-based methods. Among many segmentation algorithms,k-means is one of the simplest for generating a region of interest [10—12]. It has a time complexity ofO(n)fornsamples [13]. However, it is sensitive to outliers and initialization parameters [14]. As a result, it gives different clustering results with different cluster numbers and initial centroid values [12]. Much research has considered how to initialize the centers fork-means with the intention of maximizing the efficiency of the algorithm. In thek-means clustering algorithm, each pixel belongs to only one cluster and center, so it is a hard clustering algorithm[10, 11]. Some recent works in clustering methods of segmentation and deep learning based segmentation are addressed in Sections 2.2 and 2.3 respectively.
2.2 Clustering methods for segmentation
In Ref.[15],adaptivek-means clustering is introduced to ameliorate the performance ofk-means. Here, the initialization parameters remain consistent for several iterations. However,the initial seed point is computed simply by taking the usual mean of all data values in the input image, making it a simple post-processing operation for good quality image segmentation.
A first attempt to ameliorate the deficiencies ofk-means clustering with respect to outliers occurred three decades ago. Bezdek [16] came up with a new algorithm named fuzzyc-means (FCM) in 1981.This algorithm is a membership-based soft clustering algorithm.
Faußer and Schwenker [17] proposed an algorithm that divides the samples into subsets to perform clustering in parallel, and merges the output repeatedly. In their proposed approach they used many kernel-based FCM clustering algorithms. Two datasets (the Breast Cancer database from the UCI repository and Enron Emails) were used to evaluate their algorithm. The experimental analysis proved that the algorithm has high accuracy and works well for large real-life datasets. Benaichouche et al.[18]brought in a region-based image segmentation algorithm using enhanced spatial fuzzy FCM. Lei et al. [19] explained that traditional FCM is susceptible to noise, and describes improvements based on the addition of local spatial information. This solves the robustness problem but greatly increases the computational complexity. First, they used morphological reconstruction to smooth images to enhance robustness and then applied FCM. They also modified FCM by using faster membership filtering instead of the slower distance computation between pixels within local spatial neighborhoods and their cluster centers. The gray-level histogram of the morphologically reconstructed image is used for clustering. The median filter is employed to avoid noise from the fuzzy membership matrix generated using the histogram. The paper demonstrated that the proposed algorithm is faster and more efficient when compared to FCM and other types of modification.
Arthur and Vassilvitskii [20] introduced a new algorithm calledk-means++ that improves upon the initial selection of centroids. The selection for initial clusters is started by selecting one initial center randomly. The other cluster centers are then selected to satisfy specific probabilities determined by “D2weighting”. The probabilities are defined based on the squared distance of each point to the already chosen centers. The paper claims thatk-means++outperforms the originalk-means method in achieving lower intra-cluster separation and in speed. The number of clusters is still chosen by the user. But the algorithm is faster and more effective and even provided as a library in MATLAB.
Zhang et al. [21] used Mahalanobis distance instead of Euclidean distance to allocate every data point to the nearest cluster. Using their new clustering algorithm,PCM clustering,they got better segmentation results. However, their algorithm also has high computational cost and the challenge of initializing parameters.
Purohit and Joshi [22] presented a new approach to improvek-means with aim of reducing the mean square error of the final cluster and attaining minimum computation time. Yedla et al. [23] also introduced an enhancedk-means clustering algorithm with better initial centers. They achieved an effective way to associate data points with appropriate clusters with reduced computation time compared to standardk-means.
Dhanachandra et al. [12] initializedk-means clustering using a subtractive clustering approach which attempted to find optimal centers based on data point density. The first center is chosen to have the highest density value in the data points. After selecting the first center, the potential of the data points near this center decreases. The algorithm then tries to find other centers based on the potential value until the potential of all grid points falls below some threshold. The algorithm is effective at finding centers but the computational complexity increases exponentially as the number of data points increases. The standardk-means algorithm is then initialized with these centers. Since the aim of the paper was the segmentation of medical images, which suffer from poor contrast, a partial spatial starching contrast enhancement technique was applied. After segmentation, filtering is applied to avoid unwanted regions and noise. The paper attempted to illustrate the out-performance of subtractive clustering basedk-means over normalk-means. However, it failed to compare it to other methods. Subtractive clustering has a higher computational time than other clustering methods, which is the main drawback of this technique.
2.3 Deep learning in image segmentation
Recently a number of deep learning models have shown astounding results in semantic segmentation[4, 25, 26].
According to Ref. [26], deep learning has shown its success in handwritten digit recognition,speech recognition, image categorization, and object detection in images. It has also been applied to screen content image segmentation, and proven its application to semantic pixel-wise labeling [25].Badrinarayanan et al.[26]proposed SegNet,a method for semantic pixel-wise segmentation of road scenes,and tested their algorithm using the CamVid road scenes dataset. They used three popular performance evaluation parameters: global accuracy, class average accuracy, and mean intersection over union (MIoU)over all classes.
Minaee and Wang [25] introduced an algorithm for segmentation of screen content images into two layers (foreground and background). The foreground layer mainly consists of text and lines and the background layer consists of smoothly varying regions.They compared their results with two algorithms(hierarchicalk-means clustering in DjVu,and a shape primitive extraction and coding (SPEC) method) in terms of precision and recall values using five test images. The proposed approach scored 91.47% for precision and 87.73% for recall.
Chen et al. [4] proposed a technique that embeds multiscale features in a fully connected convolutional neural network to perform pixel-based semantic segmentation through pixel-level classification. They introduced an attention model to softly determine the weight of multi-scale features at each pixel location. They trained the FCN with multiscale features obtained from multiple resized images using a shared deep network. The attention model played the role of average pooling and max-pooling. Besides feature reduction, the attention model overcame one of the challenges of deep learning: it enabled the authors to visualize the features at different positions along with their level of importance. They proved the effectiveness of their approach using three datasets:PASCAL-Person-Part, VOC 2012, and MS-COCO 2014.
As reviewed by Minaee and Wang [27], various algorithms are in use to separate text from its background. Approaches include clustering-based algorithms, sparse decomposition based methods,and morphological operations. In their paper,they proposed an alternating direction method of Lagrange multipliers(ADMM)for this problem. They adopted the proposed algorithm to separate moving objects from the background. In a comparison made with the hierarchicalk-means approach and sparse decomposition, their proposed method scored higher precision (95%), recall (92.5%), andF1 (93.7%)values. The sparse decomposition approach was proposed by themselves in Ref. [28].
3 Materials and methods
3.1 Dataset
Images used in this paper are from different sources.Some are from the MATLAB image database and some from the Berkeley segmentation datasets (BSD) [29]. The same images were used in Refs. [12] and [30] to evaluate their segmentation algorithms. The images used for the first experiment are MRI (mri.tif), Bag (bag.png), Cameraman(cameraman.tif), Coins (coins.png), Moon (moon.tif),Pout (pout.tif), and Glass (glass.png). We ran the second experiment using AT (AT31m401.tif),Lena (lena.png), Valley (valley.jpg), Airplane(airplane.jpg), Mountain (mountain.jpg), and Breast(bet06.jpg) images [31]. Further experimental analysis was done to measure the effectiveness of our proposed segmentation algorithm using the VOC2012 challenge datasets [32].
3.2 Proposed approach
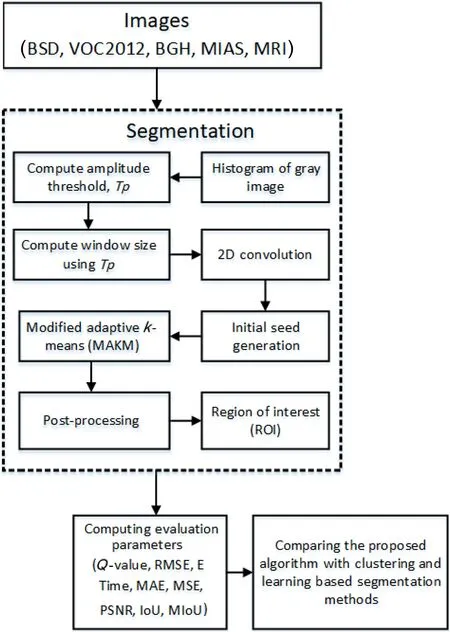
Fig. 1 Flowchart of our convolution-based segmentation algorithm.First, histograms of the grayscale image of the original image are generated. Second, amplitude thresholds, Tp, are computed using the histogram levels. Third, the dynamic window size is computed using an amplitude threshold for each image. This is followed by a 2D convolution operation. Finally, the mean of the convolution is set as the initial seed to generate other new seed values that can be used as the centers of clusters, which are then used to perform clustering.
Our proposed segmentation approach is convolution based, as indicated in Fig. 1. First, the histogram distribution (ali) of the grayscale image is generated for each image. Second, out of the generated histogram values we select only those withali≥1.Third, we computed the ratio of the sum of the selected histograms to the number of occurrences(l0) of such histogram values to obtain the amplitude threshold (Tp). Fourth, we added the histogram values ≥Tpand divided byαto get a window size. See Algorithm 1;αis computed as indicated at the end of Algorithm 1. Finally, the convolution operation is performed and the result is converted to an array to compute the mean value used as the initial seed point of the convolution-based modified adaptivek-means (MAKM) segmentation algorithm.The parameters used in the proposed algorithm are constant for each image and the segmentation result is consistent for a number of iterations which is not true for the other clustering algorithms (FCM, HBK,SC, andk-means++) used for comparative analysis.The pseudocode of the proposed algorithm is given in Algorithm 2.

Algorithm 1 Pseudocode for window size generation Get input image and convert to gray image Image = readimg()if (channels(Image)≥3) then grayimage = rgb2gray (Image)else grayimage = Image end if Calculate the Amplitude Histogram Threshold Hist = histogram (grayimage)for i = 0:255 do if (ali ≥1) then l0 =l0+1 Sumali = Sumali +ali end if end for Tp = Sumali/l0 Window size determination, w for i=0:255 do if (ali ≥Tp) then Sumali≥T p = Sumali≥T p +ali end if end for w = Sumali≥T p/α Determine α:hist = imhist(img, k), k =256 hist2 = max(hist-Tp+1,0)nonzeros2 = find(hist2)lt = length(nonzeros2)α=1+floor(min(9,lt/2))

Algorithm 2 Pseudocode for modified adaptive k-means Input: window size w and gray image Perform Convolution operation gray=conv2(gray,ones(w)/(w2),’same’)Place the convolution result in an array array = gray(:)Initialize iteration Counters: i=0, j =0 while true do Initialize seed point, seed = mean(array)Increment counter for each iteration, i=i+1 while true do Initialize counter for each iteration, j =j+1 Compute distance between seed and gray value dist = sqrt((array-seed)2)Compute bandwidth for cluster center distth= sqrt(sum((array-seed)2)/numel(array))Check values are in selected bandwidth or not qualified = dist<distth Update mean newseed = mean(array(qualified))condition for termination if (seed = newseed or j>10) then j =0 Remove values assigned to a cluster Store center of cluster center(i) = newseed break end if Update seed: seed = newseed check maximum number of clusters if (isempty(array) or i >10) then Reset counter: i=0 break end if end while Sort centers Compute distances between adjacent centers Find minimum distance between centers Discard cluster centers less than distance Make a clustered image using these centers end while
3.3 Evaluation
In this paper we use theQ-value criterion [30],computational cost [30], root mean squared error(RMSE) [33, 34], standard deviation, mean absolute error(MAE),intersection over union(IoU)[35],mean intersection over union (MIoU) [35], entropy (E),and peak signal to noise ratio (PSNR) to assess our proposed, convolution-based, modified adaptivekmeans segmentation algorithm.
TheQ-value measures image segmentation quality taking into consideration both small and large regions in the final segmented images. TheQvalue evaluation function used in this paper is given by

whereNandMare the numbers of rows and columns in the image respectively,Ris the total number of regions in the segmented image,eiis the color difference between the original and segmented image,Aiis the area of regioni, andR(Ai) is the number of regions with the same area asAi. The area of each regionAiis the number of pixels constituting that region;empty regions and regions with 1 pixel are left unconsidered. Smaller values ofQrepresent better segmentation results whereas higher values indicate higher color errors due to either under-segmentation or over-segmentation.eiis given by

whereSandOare points in 2D Euclidean space with coordinatesS(xsi,ysi) for the segmented image andO(xoi,yoi) for the original (raw) image.
RMSE measures how much the output image deviates from the input image. Mean squared error(MSE) is given by

wherer(x,y) andt(x,y) are grayscale values at positionx,yin the raw and segmented images. RMSE is the square root of the MSE [33, 34].

A smaller value means higher image segmentation quality.
For the VOC2012 challenge datasets, popular performance evaluation parameters include global accuracy, class average accuracy, and mean intersection over union (MIoU) for all classes [26].Global accuracy is the percentage of pixels correctly classified in the dataset whereas the mean of the predictive accuracy over all classes is class average accuracy. In this paper, we use MIoU to compare the performance of our algorithm with learning-based segmentation methods. MIoU is defined as


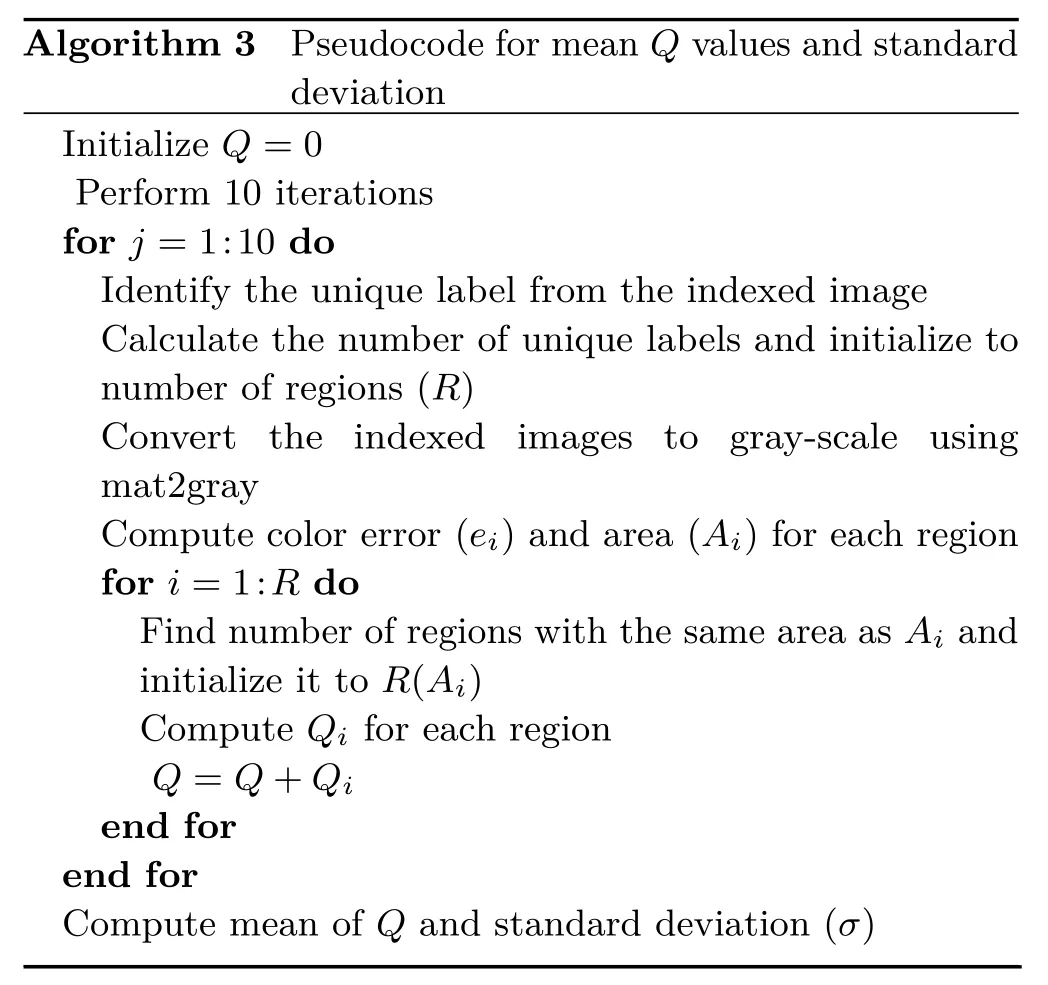
Algorithm 3 Pseudocode for mean Q values and standard deviation Initialize Q=0 Perform 10 iterations for j =1:10 do Identify the unique label from the indexed image Calculate the number of unique labels and initialize to number of regions (R)Convert the indexed images to gray-scale using mat2gray Compute color error (ei) and area (Ai) for each region for i=1:R do Find number of regions with the same area as Ai and initialize it to R(Ai)Compute Qi for each region Q=Q+Qi end for end for Compute mean of Q and standard deviation (σ)
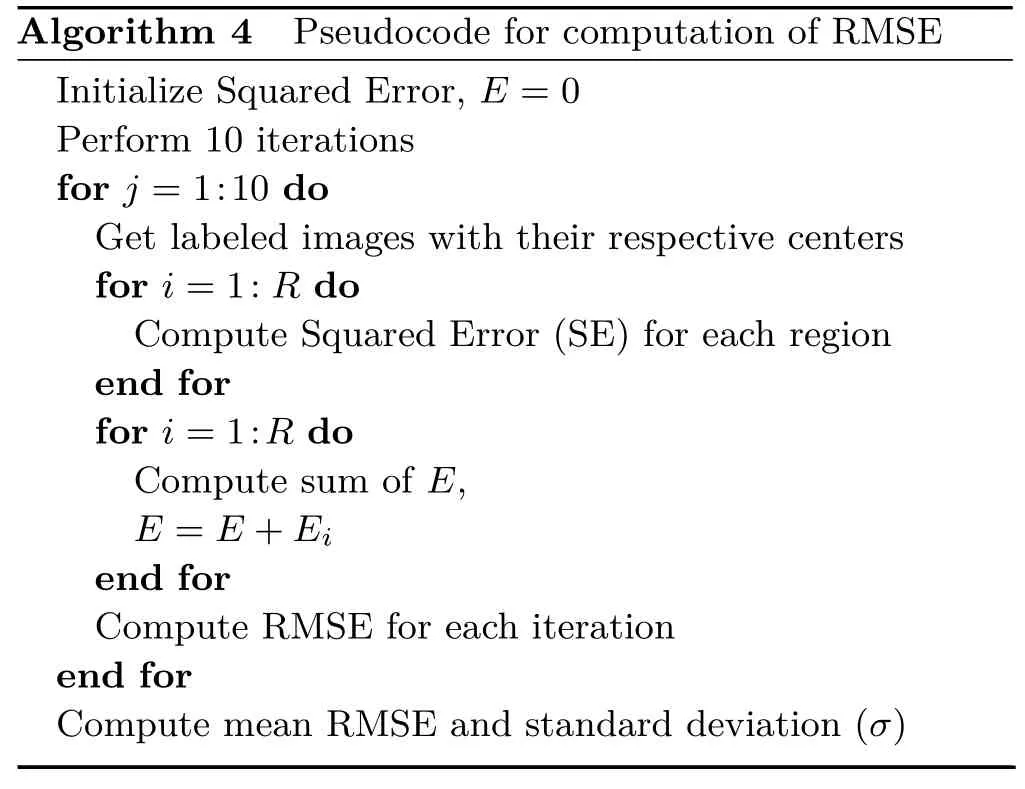
Algorithm 4 Pseudocode for computation of RMSE Initialize Squared Error, E =0 Perform 10 iterations for j =1:10 do Get labeled images with their respective centers for i=1:R do Compute Squared Error (SE) for each region end for for i=1:R do Compute sum of E,E =E+Ei end for Compute RMSE for each iteration end for Compute mean RMSE and standard deviation (σ)
where intersection over union (IoU) is defined in Eq. (6) andNis the number of objects considered from the dataset for a particular experiment.where area of overlap is the area between the predicted bounding box and the ground-truth bounding box, and area of union is the area covered by both the predicted bounding box and the groundtruth bounding box.
4 Results and discussion
The outcomes of the experiments we conducted using the proposed technique show that gray image segmentation task can be carried out efficiently while initialization of parameters is done automatically. All experiments were performed in MATLAB version 2016b and run on a 3.00 GHz Intel Core i7-4601M CPU, under the Microsoft Windows 10 operating system. The performance of the proposed segmentation algorithm was evaluated using RMSE,Q-value, computation time, MAE, E, PSNR, IoU,and MIoU. RMSE and MAE were used for standard quality measurement of the segmented output image. It tells us the degree of deviation between the output image and the input image. The same evaluation parameters were used for other selected clustering segmentation algorithms for comparative analysis, but for the deep learning based segmentation algorithm, only IoU and MIoU were used for comparison with the proposed segmentation algorithm. Some performance aspects of the proposed method are discussed in this section.
To evaluate the proposed image segmentation approach, we used images that were also used in Refs. [12] and [30]. In the first experiment, we used MRI (mri.tif), Bag (bag.png), Cameraman(cameraman.tif), Coins (coins.png), Moon (moon.tif),Pout (pout.tif), and Glass (glass.png). The results obtained are indicated in Figs. 2—6 and Tables 2—4.
In Table 1,we list images with their respective sizes and number of cluster for every clustering algorithm considered in this paper. In Table 2,we compare other clustering algorithms with our proposed algorithm in terms of segmentation quality. Since the cluster centers varying forK++, FCM, and HBK, theQvalue in Table 2, RMSE in Table 3, and computation cost in Table 4 are computed 10 times and their mean value and standard deviation are determined.However, in the proposed modified adaptivekmeans clustering method, the cluster centers are consistent for any number of iterations. Compared to other clustering algorithm, histogram-basedkmeans (HBK) had the lowest segmentation quality for moon.tif, as indicated in Table 2. ComparingK++ and FCM with HBK shows thatK++ and FCM had lowerQscore. However, adaptivek-means and modified adaptivek-means methods outperform these three algorithms, even if the adaptivek-means algorithm needs post-processing image to find the region of interest. In some cases, MAKM performs better than AKM, for example for images glass.png,pout.tif, and mri.tif.
In terms of RMSE, FCM had highest score for pout.tif which shows that it is the worst performing clustering algorithm: see Table 3. However, our proposed approach had the minimum RMSE value for all images used in the experiment.
To evaluate the attainment of the proposed technique in image segmentation for other gray images, further experiments were conducted on some commonly used images: AT31m401.tif, lena.png,valley.jpg, airplane.jpg, mountain.jpg, and bet06.jpg.The subtractivek-means algorithm has the highest computation cost for all images, although in some cases it shows better segmentation quality thanK++,HBK, and FCM.

Fig. 2 MRI-labeled image segmented using various approaches.

Fig. 3 Bag-labeled image segmented using various approaches.
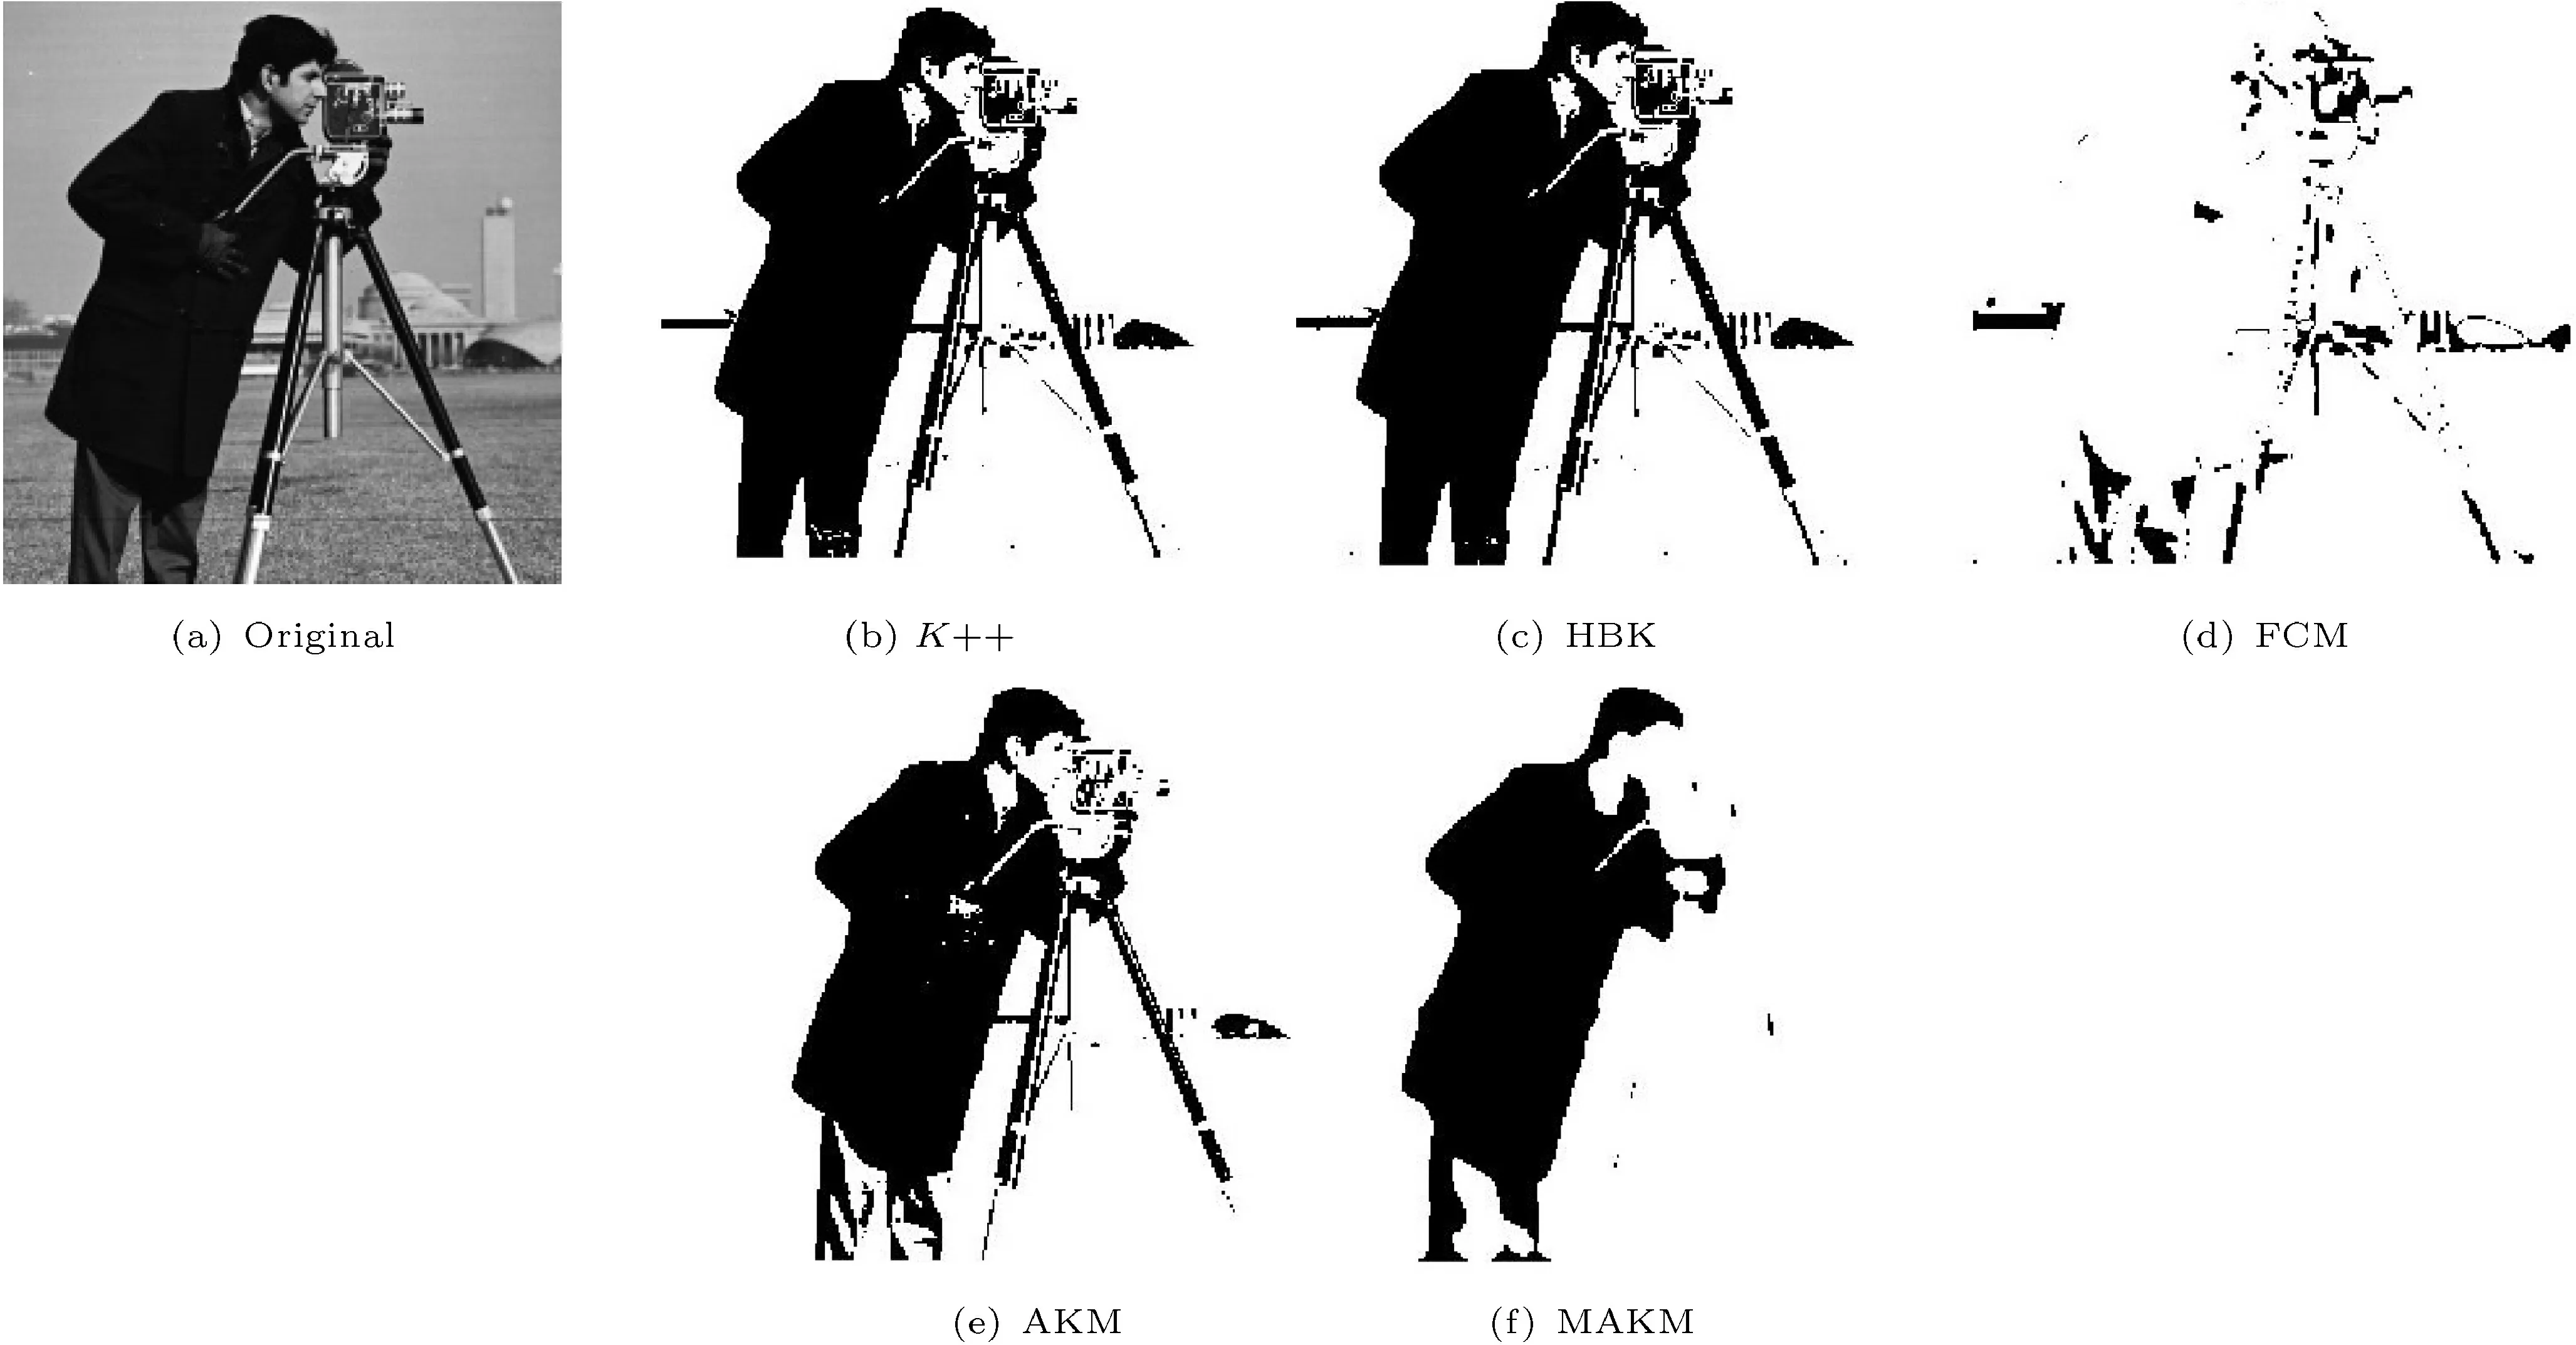
Fig. 4 Cameraman-labeled image segmented using various approaches.
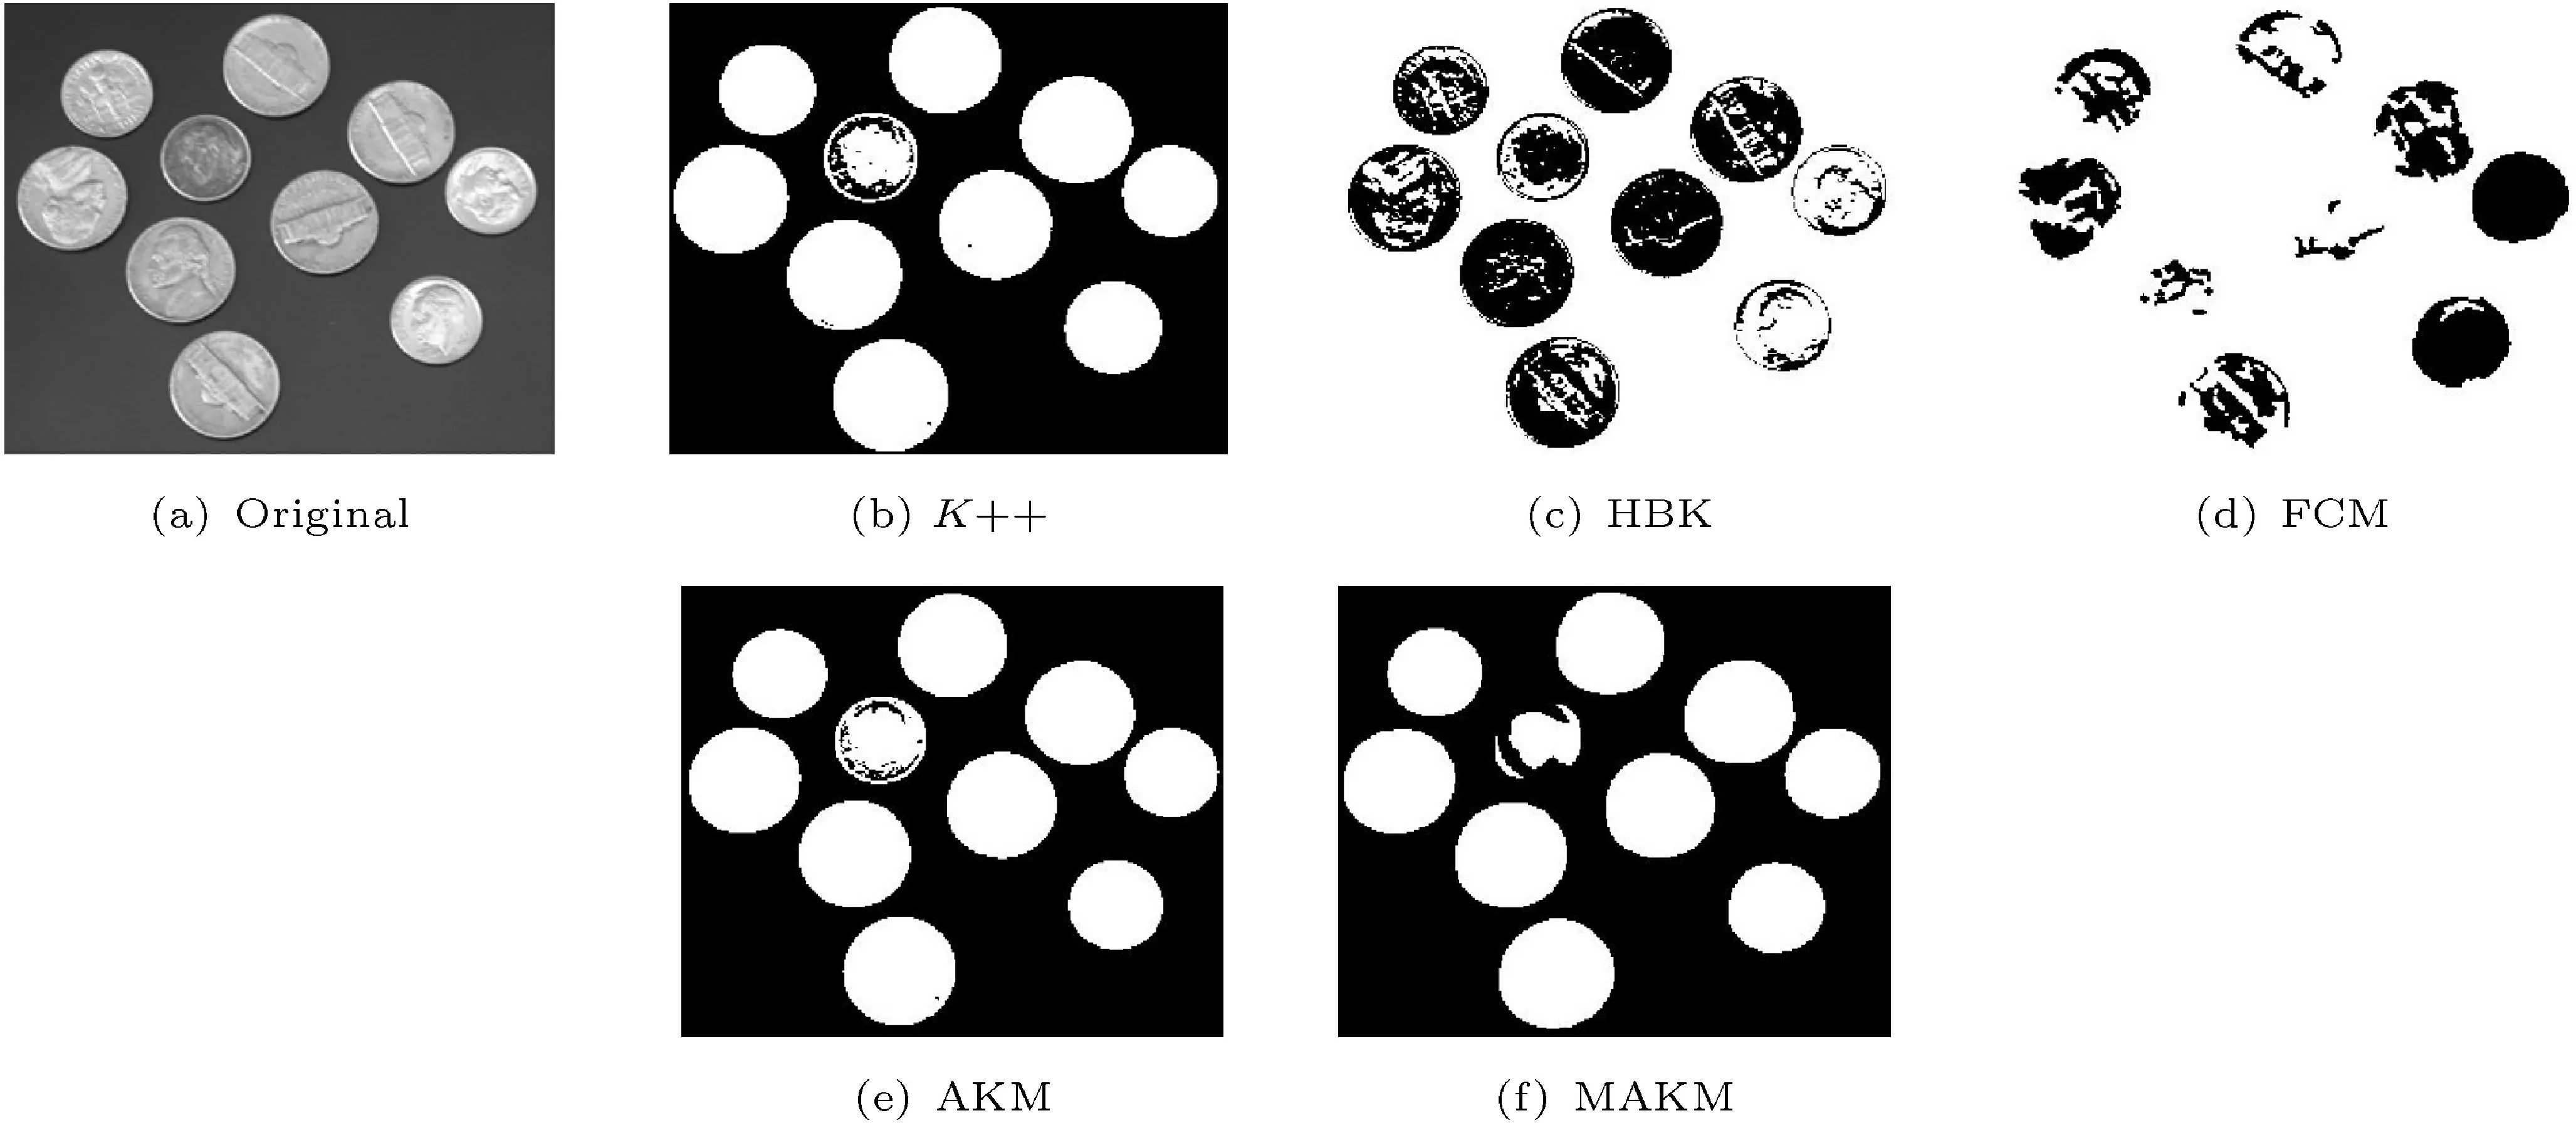
Fig. 5 Coins-labeled image segmented using various approaches.

Fig. 6 Moon-labeled image segmented using various approaches.

Table 1 Number of clusters used in each algorithm for each respective images

Table 2 Comparison of algorithms in terms of mean Q-value and standard deviation (Q-value, σ)

Table 3 Comparison of algorithms in terms of mean RMSE and standard deviation (RMSE, σ)

Table 4 Comparison of algorithms in terms of mean computation time and standard deviation (time (s), σ)

Table 5 Comparison of proposed algorithm with K++, HBK, FCM, and SC in terms of mean Q-value for AT, LE, VA, AI, MT, and Breast images

Table 6 Comparison of proposed algorithm with K++, HBK, FCM, and SC in terms of mean RMSE for AT, LE, VA, AI, MT, and Breast images

Table 7 Comparison of proposed algorithm with K++, HBK, FCM, and SC in terms of mean computation cost (s) for AT, LE, VA, AI, MT,and Breast images
From the data analysis, we observe that the time taken by subtractivek-means becomes very expensive for some images. The three image samples with highest time cost are AT31m401.tif (2846 s),lena.png (2075 s), and moon.tif (1565 s).
In the experimental results presented in Table 2,K++ shows better performance than FCM and HBK, except for some image samples: glass.png for both HBK and FCM, and bag.png for FCM.However, in the second experiment using images like AT31m401.tif,lena.png,valley.jpg,airplane.jpg,mountain.jpg, and bet06.jpg, HBK proved to provide the best image segmentation quality except for mountain.jpg. The modified adaptivek-means algorithm has better image segmentation quality,and minimum RMSE for all cases discussed. It scored well for the breast image compared to other images. The low computation cost of our proposed approach makes it more suitable for image segmentation. The sample indexed images in the second experiment are given in Fig. 7. The final results of the experiment show that the overall achievement of the proposed modified adaptivek-means is superior to other clustering algorithms in terms of image segmentation quality(Q-value), computational cost, and RMSE.
For further analysis, we considered additional images from the VOC2012 challenge dataset and mammography images from Bethezatha General Hospital (BGH) and MIAS.
Four randomly selected images (dog, airplane,plant, and person) from VOC2012 were used to compare the proposed algorithm to three clustering algorithms (AKM, FCM,K++) in terms ofQ, time,MAE, E, and PSNR. For all images our proposed algorithm scored better forQ, computation time,and PSNR compared to other clustering algorithms,but not for MAE and entropy: see Table 8. In the case of the “person” image, our proposed algorithm scored minimum MAE compared to other algorithms,indicating good performance for this particular image.

Fig. 7 Lena-labeled image segmented using various approaches.
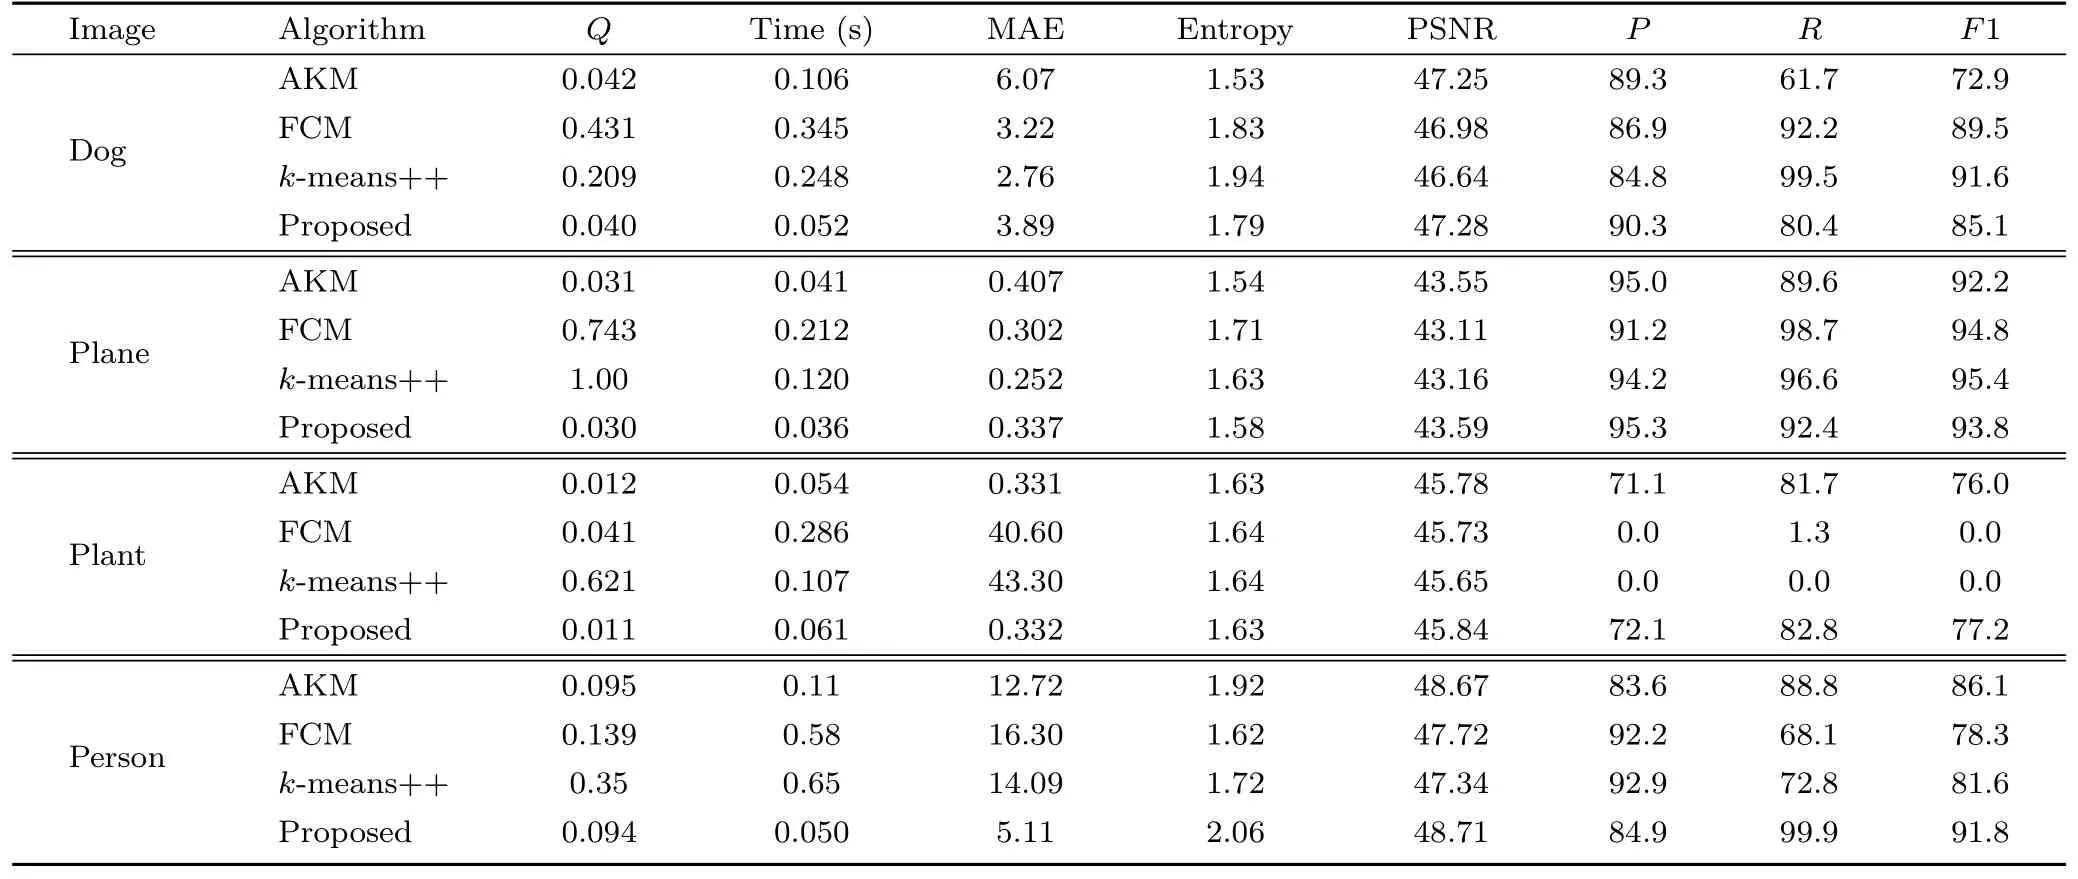
Table 8 Comparison of proposed method with clustering algorithms in terms of Q, computation time, MAE, entropy, PSNR, precision (P),recall (R), and F-score (F1) using VOC2012 dataset
Comparative performance of the proposed algorithm for two randomly selected MRI images is given in Table 9. The proposed algorithm performs better in terms of MSE,Q, and computation time for both MRI images. However, the second MRI recorded a higher IoU value than the first image, asindicated in Table 10. Segmentation results for the second MRI image are given in Fig. 11.
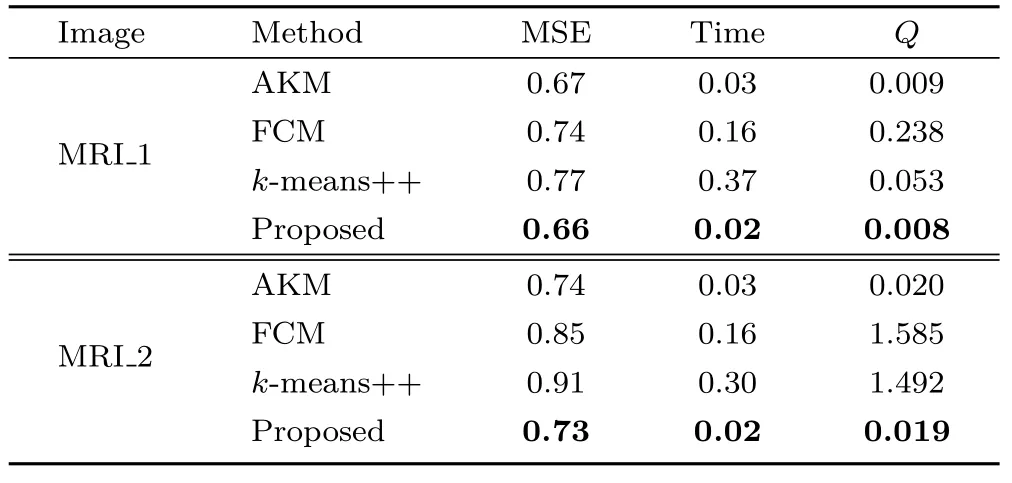
Table 9 Comparison of proposed algorithm with clustering image segmentation algorithm in terms of MSE, Time, and Q for two MRI images
A comparison of the proposed algorithm with learning-based and clustering algorithms is presented in Table 11. The comparison terms of IoU and MIoU indicate that the proposed algorithm scored higher IoU and MIoU for plant and person images, but for the dog and plane images,k-means++ scoredhigher values of IoU and MIoU. Figures 8—10 present segmentation results for the proposed algorithm for images randomly selected from VOC2012, BGH, and MIAS datasets.

Table 10 Comparison of proposed algorithm with clustering algorithm in terms of IoU and MIoU for two MRI images

Fig. 8 Examples of annotated and extracted region with cancer for breast mammographic images from BGH and MIAS datasets using proposed method.
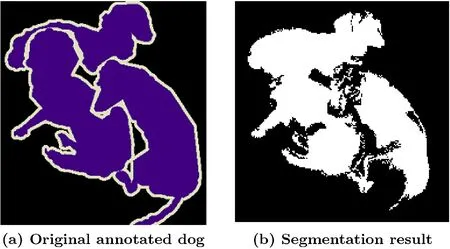
Fig. 9 Annotated and respective segmentation result for dog from VOC2012 challenge datasets using proposed method.
5 Conclusions
In this study, we presented a convolution-based modified adaptivek-means algorithm, to get the best out of the normalk-means method during image segmentation. Firstly, an automatic window size generation approach was designed to perform the convolution process to get the central value for every convolution step, and the mean of these values is assigned as the initial seed point. Then, using this seed point, the cluster centers and number of clusters are determined as initial parameters and given to the adaptivek-means algorithm. A comparative analysis of the proposed modified adaptivek-means withK++,HBK,and SC methods was made in terms of image segmentation quality (Q), RMSE, and time.The results obtained confirmed the advantages of our proposed modified adaptivek-means algorithm.Furthermore,an objective comparison of the proposed modified adaptivek-means algorithm with another soft clustering algorithm, FCM, also proved the advantages of our proposed technique.

Fig. 10 Annotated and respective segmentation result for plane and person from VOC2012 challenge datasets using proposed method.
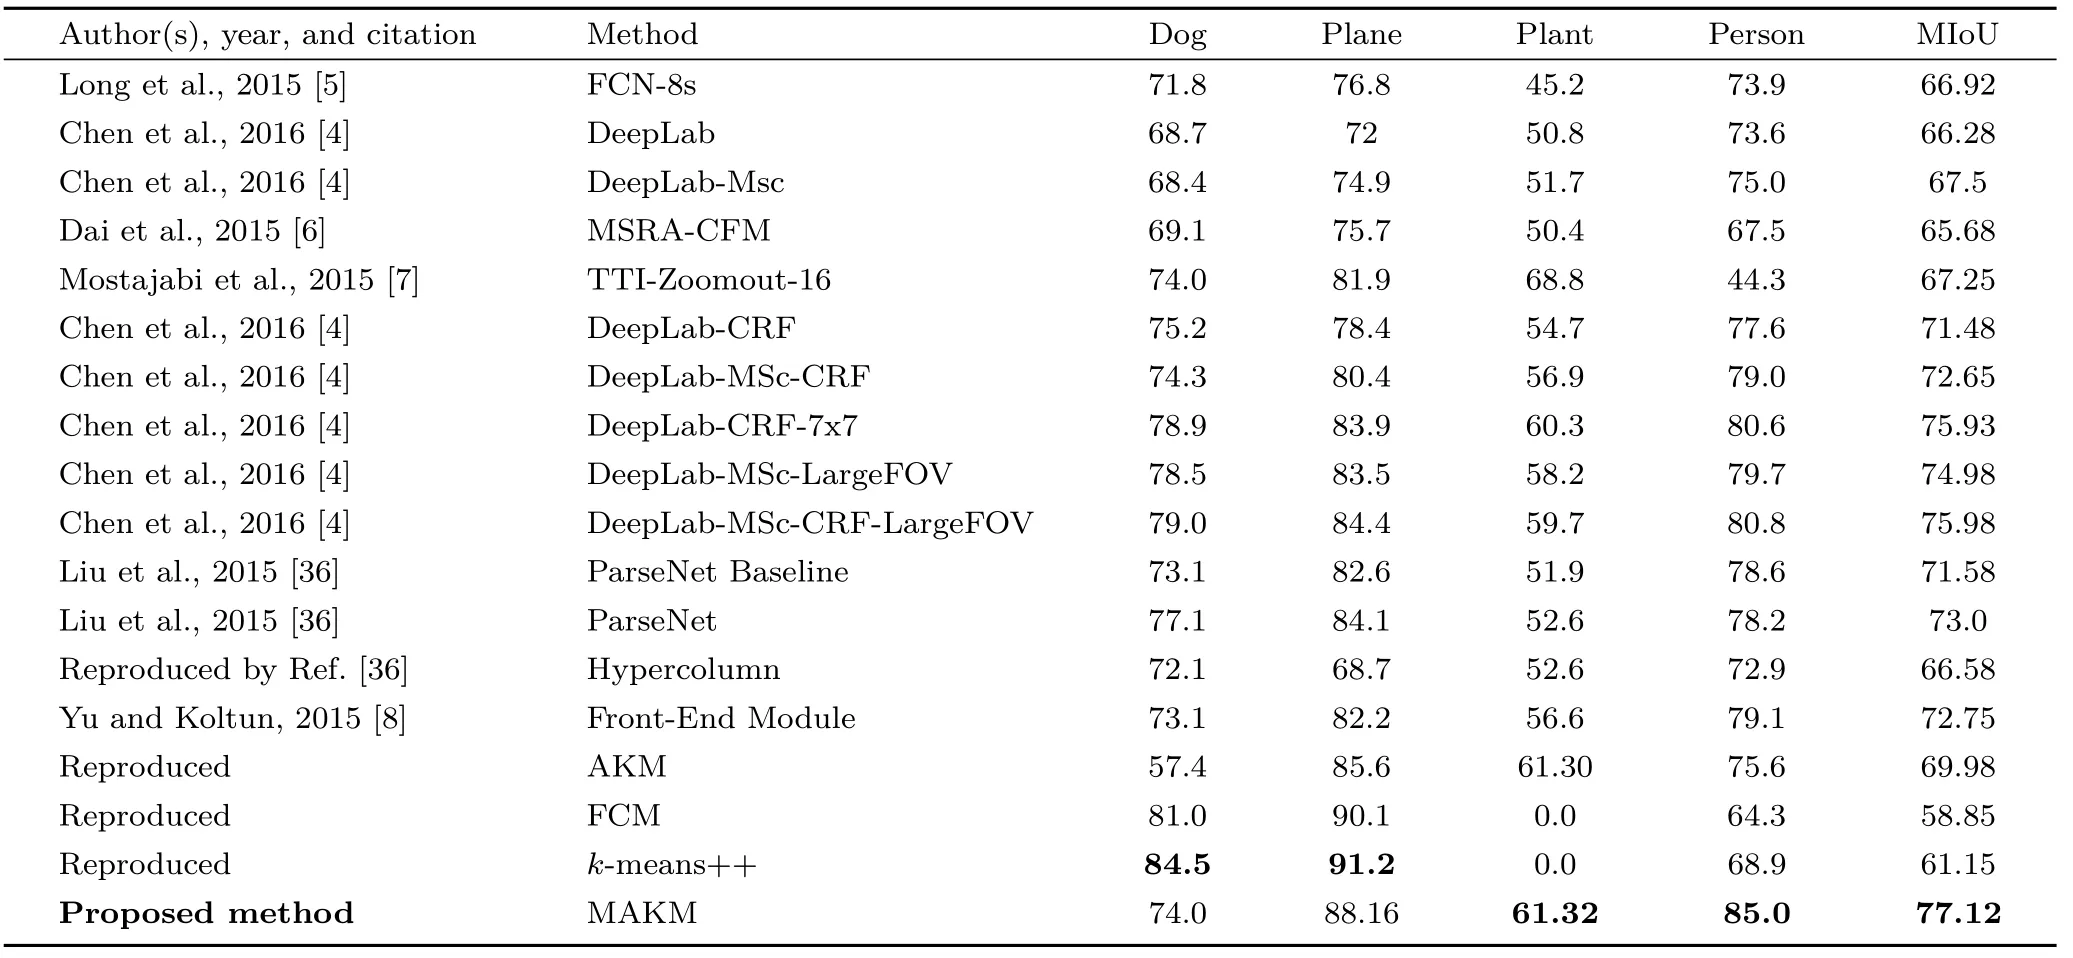
Table 11 Related works from learning-based methods and clustering algorithms for comparison with proposed method in terms of IoU and MIoU for selected images from VOC2012 dataset

Fig. 11 Examples of annotated and extracted region with tumor for MRI image using proposed method.
To evaluate the robustness of our algorithm we ran additional experiments using the VOC2012 challenge dataset and MRI images, comparing the proposed segmentation algorithm with learning-based methods in terms of IoU and MIoU. They found that our algorithm outperforms learning-based methods for the VOC2012 challenge dataset.
In work, we hope to apply our method to breast cancer image analysis. After segmentation, texture features (quantized compound change histogram,Haralick descriptors,edge histogram MPEG-7,Gabor features, gray-levelc-occurrence matrix, and local binary patterns)and shape features(centroid distance function signature, chain code histogram, Fourier descriptors, and pyramid histogram of oriented gradients) can be extracted and used as input to various classifiers to distinguish between normal and abnormal mammograms.
Acknowledgements
The corresponding author would like to thank the Ethiopian Ministry of Education (MoE) and the Deutscher Akademischer Auslandsdienst (DAAD)for funding this research work (funding number 57162925).
Open AccessThis article is licensed under a Creative Commons Attribution 4.0 International License, which permits use, sharing, adaptation, distribution and reproduction in any medium or format,as long as you give appropriate credit to the original author(s)and the source, provide a link to the Creative Commons licence, and indicate if changes were made.
The images or other third party material in this article are included in the article’s Creative Commons licence, unless indicated otherwise in a credit line to the material. If material is not included in the article’s Creative Commons licence and your intended use is not permitted by statutory regulation or exceeds the permitted use, you will need to obtain permission directly from the copyright holder.
To view a copy of this licence, visit http://creativecommons.org/licenses/by/4.0/.
Other papers from this open access journal are available free of charge from http://www.springer.com/journal/41095.To submit a manuscript, please go to https://www.editorialmanager.com/cvmj.
杂志排行
Computational Visual Media的其它文章
- Computational Visual Media TOTAL CONTENTS IN 2019
- SpinNet: Spinning convolutional network for lane boundary detection
- A three-stage real-time detector for traffic signs in large panoramas
- Adaptive deep residual network for single image super-resolution
- InSocialNet: Interactive visual analytics for role–event videos
- Mixed reality based respiratory liver tumor puncture navigation
