Spatial variability of soil total nitrogen, phosphorus and potassium in Renshou County of Sichuan Basin, China
2019-02-14GAOXuesongXIAOYiDENGLiangjiLIQiquanWANGChangquanLIBingDENGOupingZENGMin
GAO Xue-song, XIAO Yi, DENG Liang-ji, LI Qi-quan, WANG Chang-quan, LI Bing, DENG Ou-ping,ZENG Min
College of Resources, Sichuan Agricultural University, Chengdu 611130, P.R.China
Abstract Understanding soil nutrient distributions and the factors affecting them are crucial for fertilizer management and environmental protection in vulnerable ecological regions. Based on 555 soil samples collected in 2012 in Renshou County, located in the purple soil hilly area of Sichuan Basin, China, the spatial variability of soil total nitrogen (TN), total phosphorus (TP) and total potassium (TK) was studied with geostatistical analysis and the relative roles of the affecting factors were quanti fied using regression analysis. The means of TN, TP and TK contents were 1.12, 0.82 and 9.64 g kg–1, respectively. The coef ficients of variation ranged from 30.56 to 38.75% and the nugget/sill ratios ranged from 0.45 to 0.61, indicating that the three soil nutrients had moderate variability and spatial dependence. Two distribution patterns were observed. TP and TK were associated with patterns of obvious spatial distribution trends while the spatial distribution of TN was characterized by higher variability. Soil group, land use type and topographic factors explained 26.5, 35.6 and 8.4% of TN variability, respectively,with land use being the dominant factor. Parent material, soil group, land use type and topographic factors explained 17.5,10.7, 12.0 and 5.0% of TP variability, respectively, and both parent material and land use type played important roles. Only parent material and soil type contributed to TK variability and could explain 25.1 and 13.7% of TK variability, respectively.More attention should focus on adopting reasonable land use types for the purposes of fertilizer management and consider the different roles of the affecting factors at the landscape scale in this purple soil hilly area.
Keywords: soil nutrient, spatial variability, affecting factors, purple soil hilly area of China
1. Introduction
Soil nitrogen (N), phosphorus (P) and potassium (K) are the primary macronutrients in terrestrial ecosystems, which are closely related to soil fertility, plant growth, environmental problems and biogeochemical cycles (Quilchanoet al.2008; Darileket al.2009; Wanget al.2012; Liuet al.2013; Yanget al.2014; Chenget al.2016). deficiencies of these nutrients in soil may lead to low plant productivity while the removal of excesses of these nutrients from the soil can contribute to non-point source pollution if they enter surface water and ground water through leaching,runoff and soil erosion (Wanget al.2009; Yanget al.2013;Liet al.2016a). Furthermore, levels of these nutrients(especially N and P) are closely correlated with the carbonnitrogen biogeochemical cycles, which have great impacts on greenhouse gas emissions and global climate change(Bronsonet al.2004; Liuet al.2013; Yanget al.2014; Zhaoet al.2017). Due to the impacts of various natural and human factors, soil N, P and K are distributed heterogeneously in space. Therefore, better knowledge of soil N, P and K levels,their spatial variability and the affecting factors is necessary for evaluating soil productivity, guiding nutrient management and assessing potential environmental pollution, as well as for understanding biogeochemical cycles.
During the past decades, various chemical fertilizers have been applied by farmers to prevent deficiencies of soil nutrients. This greatly alters the spatial variability of soil nutrients from the field level to the national scale and changes the relationships between soil nutrients (Jiaet al.2011; Liuet al.2013; Rogeret al.2014; Shuklaaet al.2016). Thus, considerable effort has been expended to assess the spatial variability of soil nutrients and the affecting factors in different areas in recent years (Wanget al.2009;Wanshnonget al.2013; Elbasiounyet al.2014; Rogeret al.2014; Liet al.2016a). Due to the complexity of terrestrial ecosystems, the spatial variability of soil nutrients varies in different regions (Yanget al.2007; Wanshnonget al.2013;Rogeret al.2014; Xinet al.2016). These variations are caused by many environmental factors including climate,parent material, topography, soil type and human activity(Walteret al.2003; Wanget al.2009; Yanget al.2013;Bassoet al.2016; Liet al.2016a). These environmental factors can be divided into two types, including intrinsic factors (such as climate, parent material, topography and soil type) and extrinsic factors (such as land use type and farming practices) (Wanget al.2009; Yanget al.2013; Liet al.2016a). Their impacts on the spatial variability of soil nutrients vary across different scales and regions (Wanget al.2009; Liet al.2016a). The widely used geostatistical method of semi-variogram analysis provides an ideal tool to assess the spatial variability and to determine the relative importance of the two types of the factors based on the degree of spatial dependence. However, further study is still required to identify the relative importance of different factors and the dominant factors affecting spatial variability of soil nutrients, which are essential for improving site-specific recommendations in agricultural activities and environmental protection.
The purple hilly area of Sichuan Basin, located in the upper reaches of the Yangtze River in China, is characterized by a wet climate, complex topography and purple soil (Purpli-Udic Cambosols) that is prone to erosion.The special geological background features, such as the thin soil horizons, coarse texture, easily weathered parent material, high population density and high cropping intensity,make this area one of the most vulnerable ecological regions in China, with severe soil erosion and soil nutrient loss(Wanget al.2009; Yanget al.2013; Zhanget al.2016).Assessing spatial variability of soil nutrients by incorporating parent materials, soil type, topography and land use types is critical to the design of effective management practices in agricultural activities and environmental protection. This broad perspective is especially crucial for understanding the relative importance of different environmental factors and evaluating the impact of these factors on the reserves of soil nutrients and the control of non-point pollution caused by the severe soil erosion.
Therefore, this study, focuses on an in-depth assessment of the spatial variability of the main soil nutrients including N, P and K, and their affecting factors in Renshou County, a typical area in the purple hilly area of Sichuan Basin, China. Considering the response of topsoil to the external environment and their impacts on crop yields and environmental problems, total nitrogen (TN), total phosphorus (TP) and total potassium (TK) in topsoil were analyzed in this study. The specific objectives are: (1) to investigate the spatial variability of these soil nutrients in the selected study area using a combination of classical statistics, geostatistics and geographic information system (GIS); and (2) to identify the relative importance of different affecting factors using a quantitative method.Information obtained from this study can provide sitespecific recommendations for agricultural activities and environmental monitoring in the purple hilly area.
2. Materials and methods
2.1. Description of study area
Renshou County in Sichuan, China, which covers an area of 2 606 km2, lies between 29°37´ and 30°20´N and 103°54´and 104°29´E (Fig. 1-A). The whole study area, with the typical geological background of the purple hilly area, is mainly covered by hills, with a small low mountain area distributed in the northwestern part. It has an altitude that ranges from 345 to 972 m above sea level (Fig. 1-B), and a subtropical monsoon climate with an average annual temperature of 17.4°C, and a mean annual precipitation of 1 009.4 mm which mainly occurs between June and September. Purple sand shale from the Jurassic (J1,2,3 purple shale), Cretaceous (K1 purple shale) and Triassic periods (T3 purple shale) is the dominant parent material of soil in this area. Old alluvium and fluviological deposits of the Quaternary period (Q2 alluvial and fluviological deposits) also account for a small part of the parent material,which is mainly distributed in the northwest (SCOSP 1983).Three major soil groups include Purpli-Udic Cambosols(purple soil), Ali-Perudic Argosols (yellow soil) and Stagnic Anthrosols (paddy soil) (Fig. 1-C). The primary land use types are croplands including upland (31.22%) and paddy field (23.34%), woodland and grassland (21.26%), orchard land (8.98%), and others such as built-up area and water area (Fig. 1-D). The distribution of land use is largely determined by topography. Orchard land and upland are generally distributed in the upper parts of valleys and gently sloping lands, while paddy fields often appear in the lower parts of valleys. Rice, rape, corn and wheat are the dominant crops, while peach and loquat are the main fruit trees in the orchard land. Woodland and grassland are mainly distributed in the northwestern and southern parts,which are characterized by low mountains and high hilly areas. The trees primarily consist of pine, cypress and bamboo.

Fig. 1 Location of the study area, soil sampling sites and the spatial distributions of land use types and soil groups. A, location of the study area in Sichuan Province, China. B, elevation and soil sampling sites. C, spatial distribution of soil groups. D, spatial distribution of land use types.
2.2. Soil sampling and analysis
The sampling sites were determined on the basis of a 2 km×2 km grid and information on parent material, soil type,land use type and topographic characteristics in each grid.They were also remote from the built-up land and water areas. The uniformity of soil sampling points relative to different factors in space was taken into account in the final distribution of sampling sites. Based on this sampling design,soil samples were collected in November and December of 2012. At each sampling site, four replicate samples were collected at a depth of 0–20 cm within a distance of 5 m from the speci fied sampling location and the replicate samples were then homogenized by hand mixing. The geographic coordinates of each sampling site were precisely measured using a global positioning system (GPS). Soil samples were air-dried indoors and ground to pass through 2- and 0.149-mm sieves, respectively. The contents of TN,TP, and TK of soil samples were measured by the semimicro Kjeldahl method, the molybdate colorimetric method after perchloric acid digestion, and the flame photometry method after melting with sodium hydroxide, respectively.Blank value assays and parallel determinations were used to verify the accuracy and the precision of the measurements.Abnormal samples or outliers were identi fied and eliminated within each soil group and land use type using the ranges of mean±3SD (standard deviation) according to exploratory analyses. In the final analysis, the locations of the 555 soil samples used in this study are shown in Fig. 1-B.
2.3. Basic data of the affecting factors
Soil composition is controlled by various soil-forming factors at different spatial scales. Considering the scale of the study area and results of previous studies, the impacts of parent materials, soil types, land use types and topographic factors on soil nutrients were assessed in this study. Maps of parent materials and soil types, with a scale of 1:10 000,were digitized from the paper maps obtained during period of the China National Soil Survey in the 1980s, and the land use map of 2011 was obtained from the local Land and Resources Bureau. As stated previously, there are four types of parent materials and three soil groups, while the land use types were divided into four classes. Topography controls the flow of water, solutes and sediments and thus greatly affects soil development and the formation of spatial distributions of soil properties (Liet al.2016b). Elevation(H), slope (S), aspect (AS), vertical curvature (Cp), horizontal curvature (Ct), slope length (LS), topographic wetness index(WTI) and stream power index (SPI) are the terrain attributes that previous studies have often shown to be significantly correlated with soil properties (Wanget al.2009; Umaliet al.2012; Zhanget al.2012; Liet al.2013; Adhikariet al.2014).The above seven topographic factors were derived from a 30-m grid digital elevation model (DEM) of the county which was generated from the 1:10 000 topographic map with a contour interval of 5 m using the Spatial Analyst and Raster Calculator functions in ArcGIS. Particularly, the cosine value of the aspect was used to show differences in aspect from the north to the south. The topographic factors for each sampling site were finally extracted from the corresponding raster maps.
2.4. Statistical and geostatistical analysis
Soil nutrient data were subjected to descriptive analysis using SPSS. The mean, minimum and maximum, standard deviation, skewness and kurtosis were calculated to describe the data characteristics and levels of soil nutrients.The one-dimensional Kolmogorov-Smirnov (K-S) test together with skewness and kurtosis values were used to determine whether the data were normally distributed,because the distribution type of data has an important effect on the geostatistical analysis (Fuet al.2010).
Geostatistical methods including semi-variance analysis and Ordinary Kriging were used to determine the spatial dependence and spatial patterns of soil nutrients. A semivariogram was used to quantify the spatial dependence and consequently to provide necessary parameters for interpolating the target soil variables. The semi-variogram(γ(h)) of a target soil variable is defined by the following equation (Goovaerts 1999; Kravchenko and Bullock 1999):
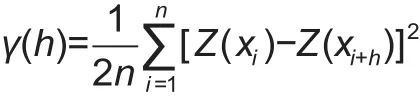
Where,Z(xi) is the measured value for the target soil variable at the location ofxi;nis the number of data pairs separated by lag distanceh; andγ(h) represents the semivariogram for a distancehbetween observationsZ(xi) andZ(xi+h). In this study, four variogram models (spherical,exponential, linear, and Gaussian) were used to describe the semi-variograms, and the best- fitted model with the largest regression coef ficient (R2) and the smallest residual sums of squares (RSS) for matching the experimental semi-variogram was selected for each soil nutrient index.Parameters generated by the best- fitted model were then used to analyze spatial structure and to provide the input parameters for Ordinary Kriging in the Geostatistical Analyst extension of ArcGIS.
Based on data from sampling sites, one-way analysis of variance (ANOVA) was performed to assess the in fluence of parent materials, soil groups and land use types on soil nutrients. Pearson correlation coef ficients were used to determine the statistical relationships between soil nutrients and topographic factors. Regression analysis was then performed using each factor as dependent variables and the adjusted determination coef ficients (adjustedR2) of the regression equations were used to re flect the independent explanatory power of each affecting factor for the spatial variability of different soil nutrients and to determine the relative importance of different affecting factors. For regression analysis, a dummy variable was employed to quantify the qualitative factors including parent materials,soil groups and land use types with numbers 0 and 1. For example, the soil type Purpli-Udic Cambosols was recorded as (1, 0, 0), Ali-Perudic Argosols was recorded as (0, 1, 0),and Stagnic Anthrosols was recorded as (0, 0, 1).
3. Results and discussion
3.1. Descriptive statistics
Descriptive statistical parameters of the soil nutrients are shown in Table 1. The average contents of TN, TP and TK were 1.12, 0.82 and 9.64 g kg–1, respectively. According to the classification criteria of soil nutrients developed during the period of the China National Soil Survey in the 1980s,soil nutrients in this study area were each at mid-range levels. In China, the mean contents of TN, TP and TK were 1.54, 0.74 and 18.60 g kg–1, respectively (Zhanget al.2005;Shangguanet al.2013). This indicated the study area had relatively higher levels of TP while contents of other two soil nutrients were much lower compared with their national levels. The coef ficients of variation (CV) of the soil nutrients,as indices of the overall variation of heterogeneity, ranged from 30.56 to 38.75%. According to the classification standards proposed by Nielsen and Bouma (1985), all the soil nutrients had moderate variability.
The results of the K-S test showed that the raw data of TP and TK were normally distributed while TN data were log-normally distributed. Therefore, the raw data of TP and TK and the log-transformed values of TN content were used so that all datasets met the normality requirements for ANOVA, geostatistical and regression analyses.
3.2. Spatial variability analysis
The best- fitted models and their parameters for matching the experimental semi-variograms are listed in Table 2.The best- fitted model for TP was a spherical model, while the models for TN and TK were both exponential models.TheR2value of the semi-variogram model for TN was 0.79 and the values for TP and TK exceeded 0.9, suggesting the spatial structures of the three soil nutrients were well- fitted with the selected semi-variogram models.
The semi-variograms of the soil nutrients exhibited different spatial autocorrelations (Table 2). As shown, TP and TK had much larger ranges than TN, indicating these soil nutrients had different ranges of spatial autocorrelation.The nugget to sill ratio of the semi-variogram model can be regarded as a criterion for classifying the spatial dependence of a variable. The degree of spatial dependence can be considered to be strong, moderate, or weak if the ratio is equal to or lower than 0.25, between 0.25 and 0.75 or greater than 0.75, respectively (Cambardellaet al.1994).In this study area, the nugget to sill ratios for all the three soil nutrients were between 0.25 and 0.75, suggesting that the soil nutrients had moderate spatial dependence and the distributions of these soil nutrients were determined by the combined effects of both intrinsic factors and extrinsic factors (Cambardellaet al.1994). In contrast to TP and TK,the nugget to sill ratio for TN was larger than 50%, which indicated that the extrinsic factors, such as land use, might be more important than the intrinsic factors in causing the spatial heterogeneity of TN.
The spatial distributions of the soil nutrients were generated based on the fitted semi-variogram models. As shown in Fig. 2, there were two distinct spatial patterns of the soil nutrients. The first pattern showed high values of TK and TP concentrations with a large area in the center of the study area, while low concentrations of these soilnutrients appeared in the northwest and southeast. The spatial distribution of TN displayed the second pattern,where low TN contents were mainly found in the southcentral area while higher TN contents were mainly found in the mountain and southern areas. In general, the spatial distribution of TN content was characterized by much higher spatial variability, while TP and TK showed more obvious spatial trends which were closer to the distributions of soil types and parent materials.
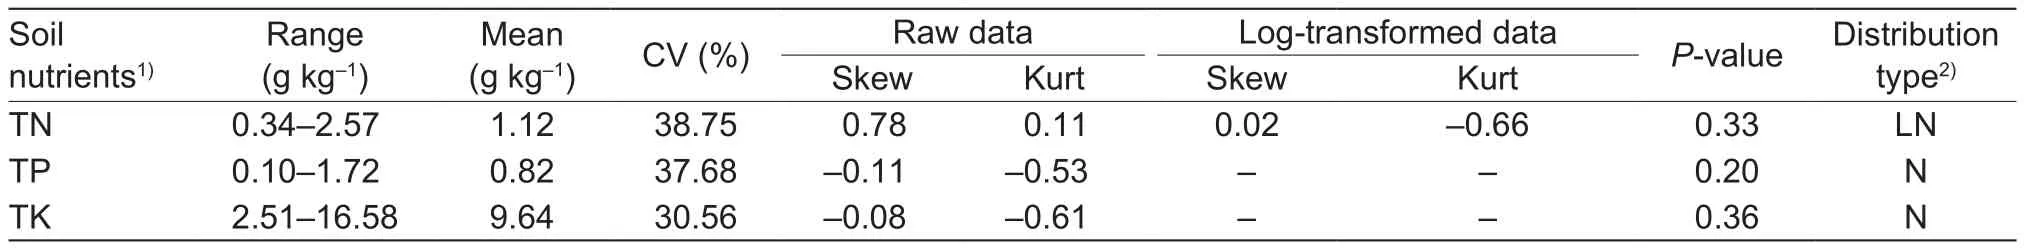
Table 1 Descriptive statistics for soil nutrients

Table 2 Semi-variogram models and their parameters for soil nutrients
3.3. Factors affecting the spatial variability of soil nutrients
Parent materialsThe results of one-way ANOVA showed statistically significant differences for TP and TK content among the four types of parent materials, while there was no significant difference for TN content among the parent materials (Table 3). This indicated that parent materials had significant impacts on the spatial distributions of TP and TK but not on TN. Soils formed from J1,2,3 purple shale had the highest mean value of TP content, followed by soils formed from K1 purple shale and Q2 alluvial and fluviological deposits, and the lowest mean value of TP content was found in soils from T3 purple shale. The highest mean value of TK content was also found in soils formed from J1,2,3 purple shale but the lowest mean value appeared in soils formed from Q2 alluvial and fluviological deposits. Parent materials can affect the supply of soil nutrient elements by determining soil composition and formation (Zhanget al.2016). Similarly, other studies also found different soil nutrient levels from diverse parent materials (Kooijmanet al.2005; Mayeset al.2014). The differences of TP and TK contents among the parent materials here were relative to the contents of the soil nutrient elements of the parent materials such as the mineral composition (He 2003). The content of potassium oxide (K2O) and phosphorus pentoxide(P2O5) of J1,2,3 purple shale was much higher than that of other purple shale in this purple area (He 2003), which resulted in higher TP and TK contents in soils formed from J1,2,3 purple shale.
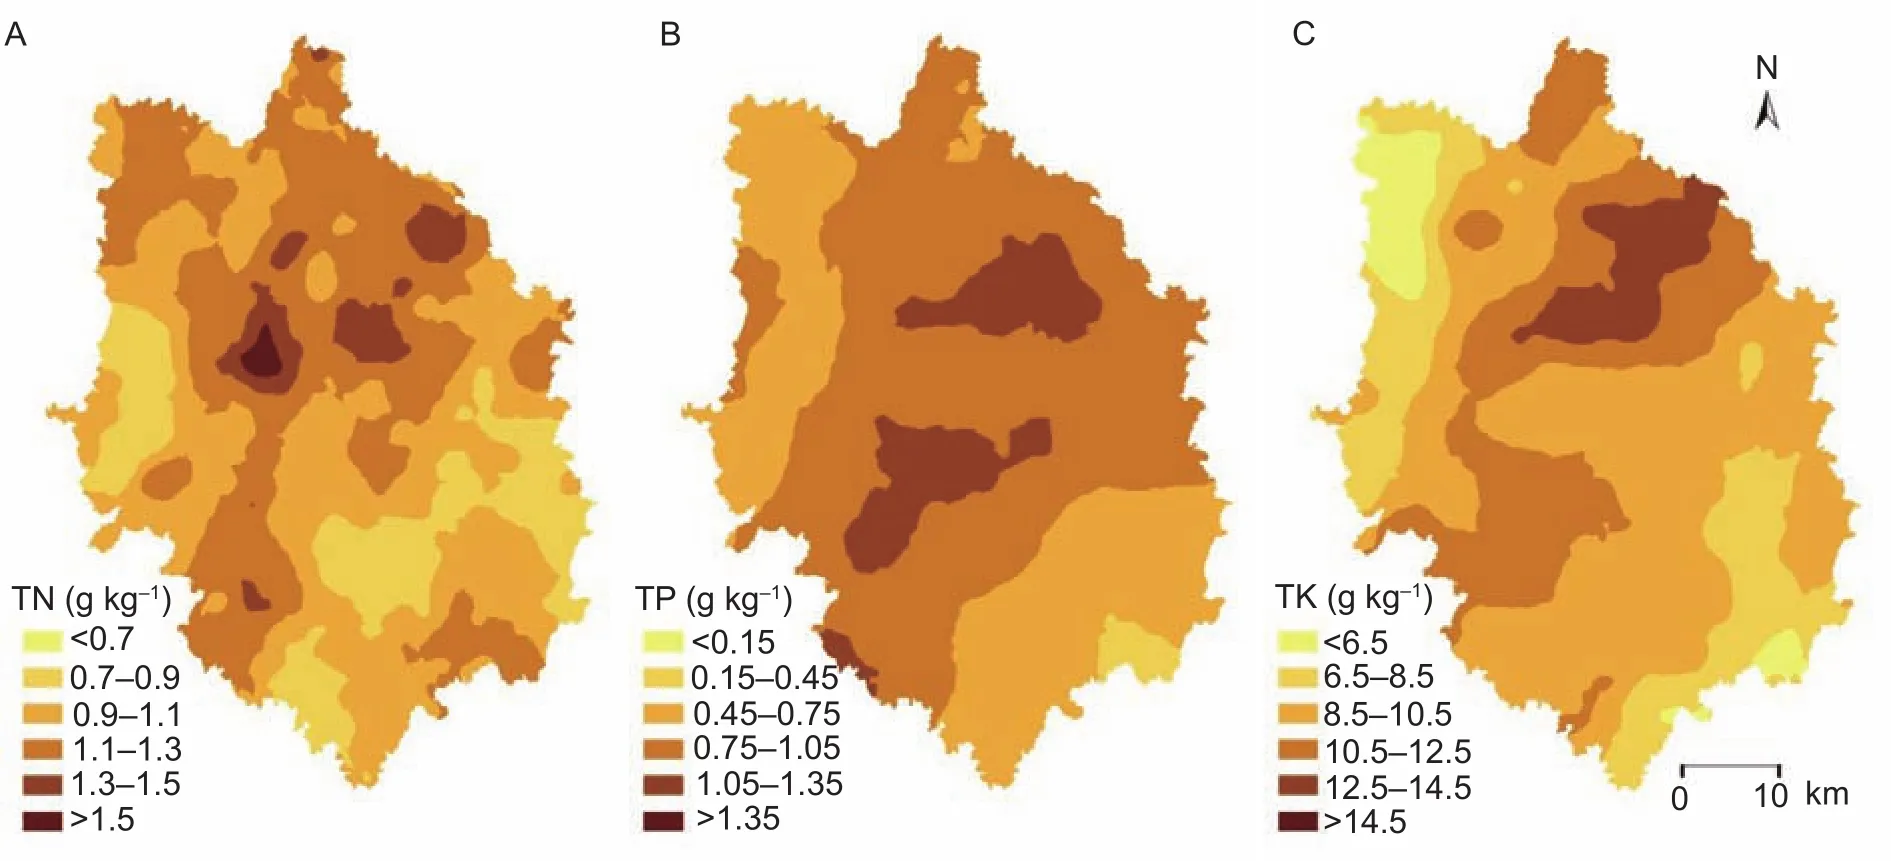
Fig. 2 Spatial distributions for the three soil nutrients in the study area produced by Ordinary Kriging. A, spatial distribution of soil total nitrogen (TN). B, spatial distribution of soil total phosphorus (TP). C, spatial distribution of soil total potassium (TK).

Table 3 The effects of parent materials on soil nutrients1)
Soil typeThe relationships between soil types and soil nutrients were determined by one-way ANOVA. It was found that soil nutrients among the three soil groups had different concentration levels (Table 4). As shown, the contents of TN were higher in Stagnic Anthrosols than those in Purpli-Udic Cambosols and Ali-Perudic Argosols, which was similar to the results reported in another purple area of Sichuan Basin (Zhanget al.2016). For TP and TK, the contents from the different soil groups decreased in the order: Purpli-Udic Cambosols>Stagnic Anthrosols>Ali-Perudic Argosols(P<0.05).
Land use typeLand use is one of the most important factors affecting soil nutrients (Wanget al.2009; Wiesmeieret al.2013; Mayeset al.2014). Many studies have reported that soil nutrients show significantly different contents among different land use types (Wanget al.2009; Coboet al.2010;Mayeset al.2014; Zhanget al.2016). In the current study,the contents of TN and TP showed significant differences among different land uses (P<0.05) while the statistical difference for TK was not significant (P>0.05) (Table 5).Similarly, Wanget al.(2009) also found no significant differences in soil TK among the different land uses in a small-scale watershed in the purple area. This is probably because the parent material had the greatest impact on soil TK in this purple hilly area (He 2003).
The mean values of TN contents were the highest in paddy field, followed by wood and grassland and orchard land, while upland was the lowest. One reason for high soil nitrogen contents in paddy field is the higher fertilizer rates applied to paddy fields than to upland areas. Another likely reason is the fact that paddy fields are generally distributed in the footslopes and gullies where the erosion and leaching N from the slope is deposited into the soil (Zhanget al.2016), while litterfall and rhizomes in woodland and grassland can increase soil nitrogen contents by increasing soil organic matter due to their close correlations (Benhamet al.2012; Liet al.2016a).
Generally, the agricultural lands showed higher levels of TP and TK content than wood and grassland; especially,orchard land which had the highest contents of soil P and K (Table 5). Similar results were reported in a small scale study in the purple area by Wanget al.(2009). This information suggested that the application of fertilizer could be the reason for high P and K contents in agricultural lands,especially in orchard land which needs more nutrients for the fruit trees.
Topographic factorsCorrelation coef ficients between soil nutrients, topographical factors and vegetation index are listed in Table 3. The soil nutrients showed different relationships with topographical factors (Table 6). Soil nitrogen showed significantly positive correlations with WTI and cosine values of slope aspect (AS). The higher WTI values mainly appeared in the footslopes and gullies, where the paddy fields are generally distributed, while the lowerWTI values corresponded to the tops of hills where upland often appears, which lead to positive correlations between soil nitrogen and WTI. The significantly positive correlation between soil nitrogen and AS indicated that the TN content was higher on the northern slope. This was consistent with the findings of other researchers (Schmidtet al.1993; Qiuet al.2004). The smaller decomposition rate of organic matter, lower temperature and higher moisture on the northern slope were the reasons for higher TN content on this aspect due to the close correlation between soil organic matter and soil nitrogen (Schmidtet al.1993; Wanget al.2009). TP was negatively related to slope and elevation(P<0.01). This was also similar to the results obtained from the previous small scale study in the purple area (Wanget al.2009), showing that the lower TP values appeared in higher elevation ranges and steeply sloped soils. However, there were no significant correlations between topographic factors and TK, which suggested that topographic factors were not main factors affecting TK in the current study area and scale.Relative importance of the affecting factorsTo identify the relative importance of the affecting factors and determine the dominant factors affecting the heterogeneity of soil nutrients, regression models were established using each affecting factor as an independent variable. The significance levels and determination coef ficients of the regression equations are given in Table 7. Results show that there were appreciable differences in the relative importance associated with different factors. The independent explanatory abilities of soil group, land use type and topographic factors for TN variability were 26.5, 35.6 and 8.4%, respectively, indicating that soil type and land use type were the two most important factors in controlling the spatial distributions of soil nitrogen,and that land use type played a more important role than soil type. Land use was also found to be the dominant factor affecting TN at the small watershed scale and the valley scale in the purple area (Wanget al.2009; Zhanget al.2016).

Table 4 The effects of soil types on soil nutrients

Table 5 The effects of land use on soil nutrients

Table 6 Correlation coef ficients between soil nutrients and topographical factors1)
The four selected factors in our study could explain 17.5, 10.7, 12.0 and 5.0% of TP variability, respectively,suggesting that parent material, land use and soil type were the important factors for TP variability in this study area (Table 7). Similarly, parent material had the highest explanatory ability for TK variability, which was much larger than the other factors. These results indicated that parent material was the dominant factor affecting spatial variability of both TP and TK. Generally, high P and K content could be attributed to the soil parent material (He 2003). There were several parent materials in the study area which had significantly different contents of P and K elements (He 2003). This was different from the results obtained from a previous small watershed scale study where only one type of parent material was available (Wanget al.2009).
3.4. Mechanism of spatial variability
The spatial variability of soil properties is determined by both intrinsic factors and extrinsic factors. The nugget to sill ratio of the semi-variogram model can be used to indicate the proportion to which extrinsic factors induce spatial variability (Cambardellaet al.1994). For TP and TK, the nugget to sill ratio was smaller than 50%, suggesting that their spatial heterogeneities were mainly caused by intrinsic factors. This was further proven by the regression analysis that indicated parent material was the dominant factor. In the current study area, purple sand shale from Triassic period and Q2 alluvial and fluviological deposits, which had lower contents of P and K elements (He 2003), were mainly distributed in the southeast and northwest, while the parent materials with higher P and K contents were concentrated in the center of the study area. Therefore, due to the spatial distributions of these parent materials, the study area showed the first spatial pattern of soil nutrients, including TP and TK, where high values appeared in the center part of the study area while low concentrations were distributedin the northwest and southeast. This also suggested that the spatial distributions of soil total phosphorus and potassium were still somewhat determined by the intrinsic factors in this area, although there existed intensive human activities. According to regression analysis, land use was the dominant factor for TN, which was consistent with the results of the semi-variogram analysis, where the nugget/sill ratio for TN was larger than 0.50 suggesting that the extrinsic factors played more important roles than intrinsic factors. The higher values of TN appeared in the mountain and southern areas, where woodland and grassland are mainly distributed, which also partially suggests that land use was the dominant factor for TN. The higher spatial variability of TN was mainly caused by high heterogeneity of land use distribution, which was associated with the amounts of N inputs in different land use types (Liet al.2016b).

Table 7 Regression analysis for soil nutrients using different factors as independent variables (n=555)
Although the spatial variability of soil nutrients could be analyzed by geostatistical methods, the spatial patterns of soil nutrients produced by Ordinary Kriging only indicated the spatial distribution trends of soil nutrients, and no details were presented in the interpolation maps. Thus, highlyaccurate spatial prediction methods, which can employ the affecting factors as auxiliary variables and explore the interaction effects of these factors, are needed for obtaining accurate spatial information of soil nutrients in the agricultural and environmental sciences.
4. Conclusion
The contents of soil TN, TP and TK in this study area were all at mid-range levels. All the three soil nutrients had moderate variability and spatial dependence, and two distribution patterns were observed. TP and TK were associated with patterns of obvious spatial distribution trends where high values were mainly distributed in the center and low values appeared in the northwest and southeast. In contrast, TN was characterized by high variability, and low TN contents appeared in the southcentral area and higher contents were mainly distributed in the mountain and southern areas.
Parent material, soil type, land use and topographic factors all contributed to the spatial variability of soil nutrients, but the relative importance of these factors varied with the particular nutrient component. Soil group, land use type and topography factors were the important factors contributing to the spatial heterogeneity of TN, with land use type likely being the dominant factor. All four factors contributed to the spatial variability of TP, and parent material was the dominant factor while land use type also played an important role. Only two factors, parent material and soil type, contributed to variability of TK and parent material was the dominant factor. Although topography factors were important factors affecting soil nutrient variability, they were not the dominant factors at this landscape scale. More attention should be payed to the adoption of reasonable land use types for the purposes of environmental protection at landscape scales. In addition, considering the complexity of the environmental factors, future studies are needed to explore the interaction effects of these factors and the spatial non-stationarity of the relationships between soil nutrients and their affecting factors.
Acknowledgements
This work was supported by grants from the National Key Research and Development Program of China(SQ2018YFD080041), and the Science Fund of the Education Department of Sichuan Province, China(16ZB0048).
杂志排行
Journal of Integrative Agriculture的其它文章
- Modelling and mapping soil erosion potential in China
- Updating conventional soil maps by mining soil–environment relationships from individual soil polygons
- Spatial variability of soil bulk density and its controlling factors in an agricultural intensive area of Chengdu Plain, Southwest China
- An integrated method of selecting environmental covariates for predictive soil depth mapping
- Remotely sensed estimation and mapping of soil moisture by eliminating the effect of vegetation cover
- Automatic extraction and structuration of soil–environment relationship information from soil survey reports