Modelling and mapping soil erosion potential in China
2019-02-14TENGHongfenHUJieZHOUYueZHOULianqingSHIZhou
TENG Hong-fen , HU Jie ZHOU Yue ZHOU Lian-qing SHI Zhou
1 College of Environmental and Resource Sciences, Zhejiang University, Hangzhou 310058, P.R.China
2 State Key Laboratory of Soil and Sustainable Agriculture, Chinese Academy of Sciences, Nanjing 210008, P.R.China
Abstract Soil erosion is an important environmental threat in China. However, quantitative estimates of soil erosion in China have rarely been reported in the literature. In this study, soil loss potential in China was estimated by integrating satellite images,field samples, and ground observations based on the Revised Universal Soil Loss Equation (RUSLE). The rainfall erosivity factor was estimated from merged rainfall data using Collocated CoKriging (ColCOK) and downscaled by geographically weighted regression (GWR). The Random Forest (RF) regression approach was used as a tool for understanding and predicting the relationship between the soil erodibility factor and a set of environment factors. Our results show that the average erosion rate in China is 1.44 t ha–1 yr–1. More than 60% of the territory in China is in fluenced by soil erosion limitedly,with an average potential erosion rate less than 0.1 t ha–1 yr–1. Other unused land and other forested woodlands showed the highest erosion risk. Our estimates are comparable to those of runoff plot studies. Our results provide a useful tool for soil loss assessments and ecological environment protections.
Keywords: soil erosion potential, RUSLE, mapping, modelling
1. Introduction
Soil erosion by water, hereafter soil erosion, not only causes soil nutrient loss and land degradation, but also degrades water quality and clogs rivers and reservoirs (Zhuet al.2013;Wang Bet al.2016). The rate of soil erosion is in fluenced by climate, physical, hydrological, chemical, mineralogical and biological factors, such as rainfall amount and intensity,runoff depth and velocity, and the susceptibility of soil to erosion (Wanget al.2015).
According to the Bulletin of First National Census for Water, China is severely affected by soil erosion; the total area of land affected by water and wind is estimated to be about 3 million km2, which represents approximately 32% of the territory of China (MWR and NBS 2013; Wang Bet al.2016). Precipitation, including extreme events such as heavy precipitation and droughts, will change significantly in China, and these changes might continue in the near future (Jianget al.2016), and thus accelerated soil erosion processes. The spatio–temporal variation of soil erosion in China must be analysed quantitatively and rapidly.
To calculate erosion risk and identify ways to control soil loss in China, descriptions of erosion have been performed through field surveys (Zhanget al.2009; Zhuet al.2013; Guoet al.2015; Zhaoet al.2017) and laboratory experiments (Li and Zhang 2010; Shiet al.2010; Sheet al.2014) directly. However, these precise predictions are dif ficult to apply on a large scale, especially for the national scale of China, because erosion combines the effects of land surface cover, soil conditions and environmental factors(Parket al.2011). Guoet al.(2015) reviewed soil erosion based on runoff plot studies in China. Wang Xet al.(2016)employed an empirical approach to monitor soil erosion in China and analysed its relationship with land use change.Chenet al.(2017) reviewed the effects of terracing on soil conservation in China. However, these studies failed to estimate and map soil erosion quantitatively in China. Thus,forecasting formulae based on statistical approaches are essential for estimating soil erosion across China.
The Revised Universal Soil Loss Equation (RUSLE)is the product of complex factors including climate, soil,terrain, vegetation and human practice (Shiet al.2004;Tenget al.2018a), which is used to calculate soil loss rate from hillslopes (Wischmeier and Smith 1978). RUSLE can be used to estimate soil erosion potential over large areas,including on the regional (Parket al.2011; Zhaoet al.2012;Xuet al.2013; Tenget al.2018a), national (Tenget al.2016;Yueet al.2016), continental (Luet al.2003; Panagoset al.2015a), and global (Yanget al.2003; Borrelliet al.2017)scales. To estimate soil erosion in China, spatially explicit data sets are needed to ful fil the requirements of the RUSLE model. However, the collection of these data sets over periods of time using field experiments are dif ficult and expensive, so such studies are only available over limited areas. The dearth of suitable data sets creates a need to make soil erosion estimates, which is a challenging prospect over large regions. In this study, soil erosion in China was modelled and estimated based on the RUSLE by integrating satellite images, field samples, ground observations and machine learning techniques.
2. Materials and methods
Using an approach with climate, soil, terrain, vegetation and human practice factors as inputs, the simplicity of RUSLE facilitates the analysis of large data sets and calculations over large scale assessments (Kinnell 2010).

Where,Ais the annual soil erosion (t ha–1yr–1);Ris the rainfall erosivity factor (MJ mm ha–1h–1yr–1);Kis the soil erodibility factor (t ha h ha–1MJ–1mm–1);Cis the cover management factor;LSis the slope length and steepness factor; andPis the control practice factor.
2.1. Rainfall erosivity factor (R)
TheRfactor is an indicator which combines the effects of the duration, magnitude, and intensity of rainfall invents(Tenget al.2017). Daily precipitation data that provided by the National Climate Centre of the China Meteorological Administration (CMA) was used in this study. For the fifteen-year period from 2002–2016, daily rain gauge data from 650 stations across China were selected in this study(Fig. 1-A). Rainfall estimates from the 3-hourly tropical rainfall measuring mission (TRMM) provided by algorithm 3B42 Version 7 (Huffmanet al.2007; Tenget al.2014; Maet al.2017), with a spatial resolution of 0.25°×0.25°, were also used in the calculation of theRfactor in this study.TRMM 3B42 rainfall products were accumulated over 24 h to construct daily rainfall estimates.
In this study, theRfactor was modeled following the steps described by Tenget al.(2017): first, rain gauge and TRMM measurements were merged by Collocated CoKriging (ColCOK) and thus to provide a new daily rainfall product with less error and high spatial resolution. Then, a power function model, which was developed by Zhanget al.(2002) and widely used in China (Sunet al.2014; Guet al.2016; Qinet al.2016), was applied to calculateRfactor using the merged daily rainfall data. Zhanget al.(2002)estimatedRbased on this model and veri fied the result byEI30. The results indicated that the daily model showed a better performance than other models, with an averageR2of 0.718. This method estimates half-monthRvalue:

Where,Rkis theRvalue of theihalf-month (MJ mm ha-1h-1);jis the days in thekhalf-month; andis the effective precipitation (≥12 mm) for dayiof thekhalf-month.Otherwise,is equal to zero. The parametersmandnare defined as:
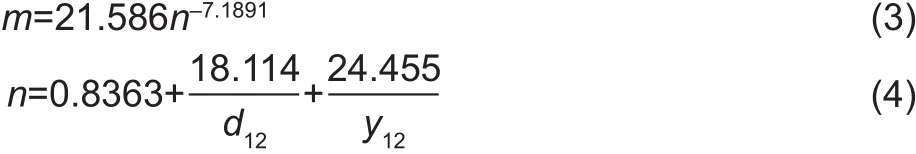
Where,d12is the average daily rainfall (≥12 mm),y12is the yearly average rainfall for days with rainfall no less than 12 mm. Monthly and annualRvalue can be obtained by aggregatingRvalues in each half-month.
In addition, geographically weighted regression (GWR)(Xuet al.2015; Maet al.2017) was applied to downscaleRfactor to 1-km spatial resolution. Some key steps were described in Maet al.(2017) and Tenget al.(2017). The environmental variables, including terrain attributes, climatic variables, vegetation and soil (Table 1), were chosen in the downscaling procedure.
Before merging daily rainfall data by ColCOK, the 650 rain gauges were split into a training set (433) and a test set(217) randomly (Fig. 1-A), following the approach presented in Tenget al.(2017). The 217 testing gauges were used to validate the performance of the model independently. The predictedRvalue was estimated by the root mean square error (RMSE) and coef ficient of determination (R2) based on the test set:

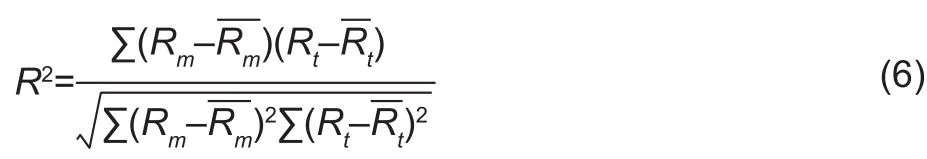
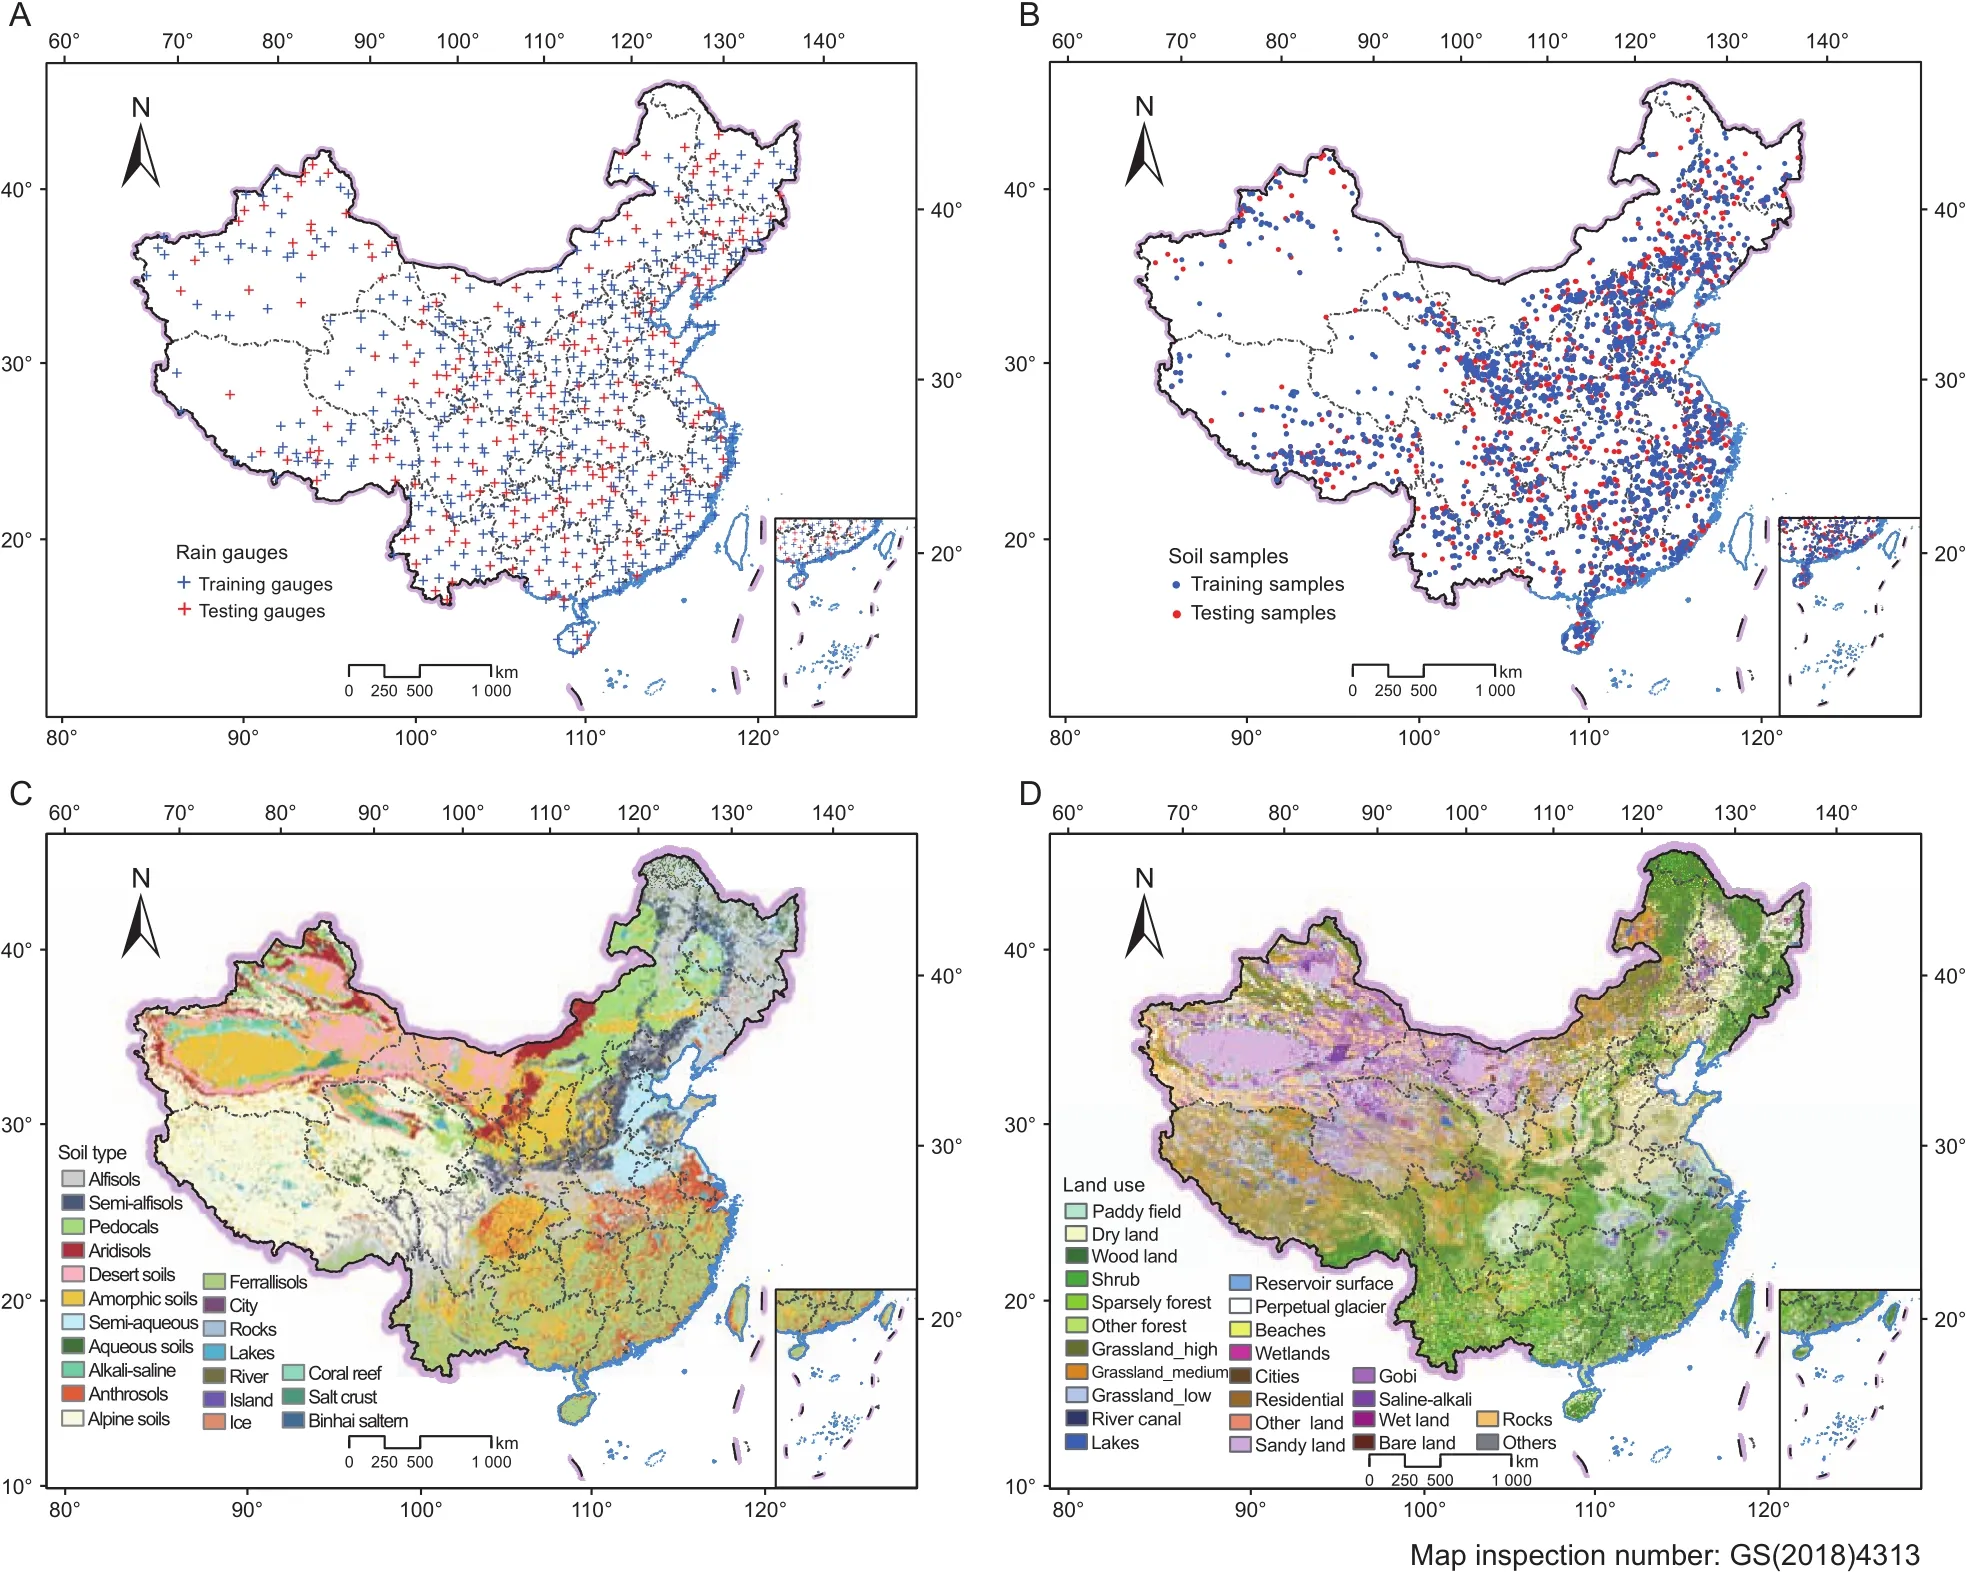
Fig. 1 Maps of rain gauges (A), soil samples (B), soil types (C) and land use types (D) used in this study.

Table 1 The environmental predictors used in the machine learning methodologies
Where,nis the gauges used in the analysis,Rtis theRfactor value estimated by training set, andRmis theRfactor value estimated by test set.
2.2. Soil erodibility factor (K)
TheKfactor was calculated following recommendations of Sharpley and Williams (1990).

Where,Sanis the sand content (0.05–2 mm);Silis the silt content (0.002–0.05 mm);Clais the clay content (<0.002 mm);TOCis the soil total organic carbon (TOC) content;andSN1=1–San/100. All these contents are presented in %.
Zhanget al.(2008) evaluated the accuracy of the environmental policy integrated climate (EPIC) model for estimating theKfactor and developed an improved model to estimateKvalue. The improved model was built based on the relationship betweenKvalues that were modelled by EPIC and those calculated using soil loss ratio from natural experiments in China. Their results showed that the estimatedKvalue using the improved model was much improved compared to the EPIC estimates. In this study, the finalKvalues were calculated following the recommendations of Zhanget al.(2008).

Data for the soil texture and organic carbon contents were collected from the 3 758 soil pro files (see Fig. 1-B) analysed during the Second National Soil Survey (NSSO 1993,1994a, b, 1995a, b, 1996, 1998). After calculation, digital soil mapping (DSM) methodology (McBratneyet al.2003;Zhanget al. 2017) was applied to mapKfactor over China:

Where, the factors describe the interactions between soil(s), climate (c), vegetation (v), terrain (r), and geology (p) in space (u={u1; u2}), and in time (t). It should be noted that sand, silt, clay and TOC have been used in the calculation ofKvalues (eq. (7)), and thus these variables in the Table 1 were not included in theKmapping procedure.
Random Forest (RF) was used in theKmapping procedure in this study. Its theoretical details can be found in the literature (Viscarra Rossel and Behrens 2010; Heet al.2016; Tenget al.2018b). From the 3 758 data, 2 506 data were randomly selected and used for training the model by 10-fold cross validation. The remaining 1 252 data were used for validation. The accuracy of the model was shown usingR2and RMSE of the predictions.
2.3. Slope length and steepness factor (LS)
TheLSfactor was calculated using the 3 arc–second(approximately 90 m) grid Shuttle Radar Topography Mission (SRTM) digital elevation model (DEM) following the methodology presented by Desmet and Govers (1996).
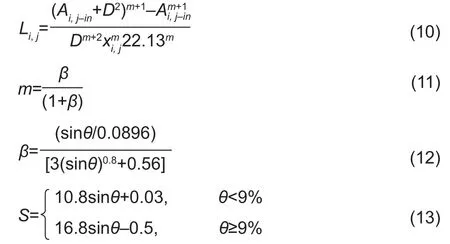
Where,Li,jis theLfactor from the cell (i,j);Ai,j–inis the contributing area at the inlet of the grid cell measured in m2;Dis the cell size;xi,j=(sinαi,j+cosαi,j);αi,jis the aspect direction for the cell (i,j);θis the slope angle.
2.4. Cover management factor (C) and control practice factor (P)
As a factor that is in fluenced by the vegetation, land surface roughness, land use type and mulch cover (Mhangaraet al.2012), theCfactor is known to be dif ficult to estimate at the national scale and also vary considerably during the seasons. ThePfactor can be estimated according to the land cover type (Tenget al.2018a). In this study,Land-Use/Cover Data set (Liuet al.2010) in China with a resolution of 1 km, which is publicly shared by the Data Centre for Resources and Environmental Sciences at the Chinese Academy of Sciences (RESDC) (http://www.resdc.cn), is used to derive theCandPvalues according to the classification criteria that listed in the Table 2 in Tenget al.(2018a).
3. Results
3.1. Erosion factors in China
Maps of the erosion factors are shown in Fig. 2. It should be noted that areas of cities, rocks, salt crusts, water bodies and permanent glaciers, which are commonly deemed to be soil-free areas, are excluded from consideration.
The spatial pattern of the predicted annualRfactor in China during the period of 2002–2016 is represented in Fig. 2-A. For the downscaledRfactor, the validation results of GWR model showed thatR2and RMSE were 0.86 and 804.36 MJ mm ha–1h–1yr–1, respectively.Rvalue less than 100 MJ mm ha–1h–1yr–1mainly existed in the northwestern China. The largestRvalues (>10 000 MJ mm ha–1h–1yr–1)were observed in southern China, in accordance with the local climate. Given 217 testing rain gauges data, the results
ofRvalues were satisfactory, withR2of 0.90 and RMSE of 693.15 MJ mm ha–1h–1yr–1.
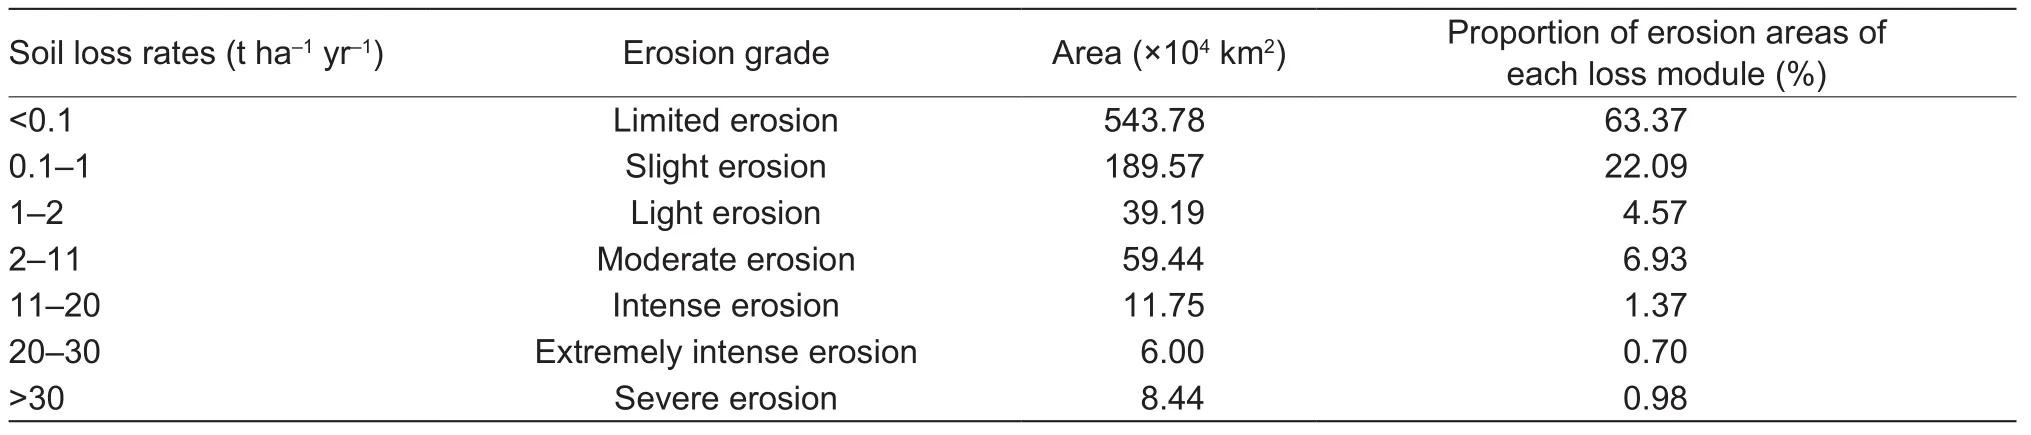
Table 2 Conversion from erosion rate to erosion grade, with corresponding areas of each erosion grade and its proportion in China

The map ofKfactor is illustrated in Fig. 2-B. TheR2and RMSE were 0.56 and 0.032 t ha h ha–1MJ–1mm–1for theKfactor in the DSM validation procedure. Fig. 2-B shows that the soils withKfactor less than 0.01 t ha h ha–1MJ–1mm–1are mostly found in the sandy soil with a caliche layer among desert regions (the Tarim Basin and Qaidam Basin).Soil which is hard to get detached and carried away by overland flow also shows smallKvalue. The most erodible soils (K>0.022 t ha h ha–1MJ–1mm–1) are mostly observed in the eastern part of the Tianshan Mountains.
Fig. 2-C describes theLSfactor map of China. The lowestLSfactor (<0.1) occurred in the areas of deserts,e.g., in the Tarim Basin and Qaidam Basin. Areas with low relief, such as the Yangtze Plain and North China Plain, also showed lowLSvalues. Whereas the highestLSfactors(>8) occurred in the western part of the Sichuan Basin, the Hengduan Mountains and the southern Himalayas.
TheCfactor map is displayed in Fig. 2-D. TheCvalues have a tendency to grow from the southeast to the northwest of China. The largestCvalues occurred in areas where almost no vegetation exist, for example, the Qaidam and Tarim Basins. The smallestCvalues were observed in the rain forests with evergreen trees, e.g., in the southern and northeastern China. The North China Plain and Yangtze Plain have relatively largeCvalues. Fig. 2-E, namely thePfactor map, shows the decrease in soil erosion resulting from human activities. As shown in Fig. 2-E, human engineering activities are mainly occurred in the east part of China and primarily focus on farmland.
3.2. Soil loss potential in China
A map of the potential annual soil erosion of China (1-km resolution) is shown in Fig. 3. The average potential erosion rate in China is 1.44 t ha–1yr–1, which means around 1 180.28×10⁶tonnes of soil is potentially lost annually in China (Table 3). Southwestern China, especially the eastern Tibetan Plateau, the Hengduan Mountains and western Yunnan-Guizhou Plateau showed the greatest erosion potential (>10 t ha–1yr–1). The smallest rates (<0.001 t ha–1yr–1) were evident in northwestern China, particularly in the Tarim Basin, Qaidam Basin and southern Kunlun Mountains(Fig. 3). The Sanjiang Plain, Hetao Plain and eastern Yangtze Plain also showed low erosion rates (Fig. 3).
The estimated average erosion rate in China was converted into seven erosion grades (Limited, Slight,Light, Moderate, Intense, Extremely Intense, and Severe)according to the rules listed in Table 2. Fig. 4 presents a map of China’s soil erosion condition at different grades.According to Table 2 and Fig. 4, limited erosion areas account for the largest proportion of erosional areas in China and mostly occur in the Yangtze Plain, North China Plain,northwestern and northeastern China, whereas Extremely Intense and Severe erosion areas were obligated to the lowest proportion of the erosional area in China and mostly appear in the eastern Tibetan Plateau and the Hengduan Mountains (Fig. 4).
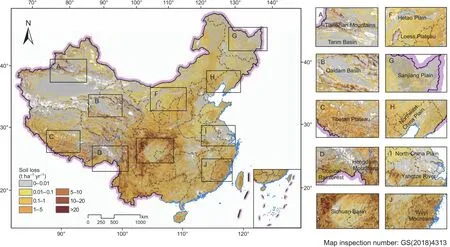
Fig. 3 Map of predicted annual soil erosion for the period of 2002–2016 of China.
3.3. Regional and land use assessment
Table 3 describes the estimated average and total soil erosion potential in China. Hong Kong, Sichuan and Chongqing have the highest erosion rates (Table 3). Fujian,Yunnan and Hainan have the next highest erosion rates.Jiangsu, Shanghai and Jilin have relatively low erosion rates.Inner Mongolia, Tianjin and Heilongjiang have the lowest rates of erosion (Table 3). The total soil loss in southwestern China is more than 40% of the total annual soil loss of China.Northeast China, including Liaoning, Jilin and Heilongjiang,accounts for less than 1% of the total soil loss of China.
Table 4 shows the estimated potential average and overall soil loss in China categorized by land use type. Other unused land and other forested woodlands have the largest erosion rates and total soil loss. Other forested woodland have experienced relatively minor total soil loss due to their limited areas over China (Table 4). Grasslands, bare land and dry land have the next highest erosion rates. The Gobi desert, sandy land and saline-alkali land have lower rates of erosion. Woodlands, wetlands and paddy fields have the lowest rates of erosion (Table 4). The total amount of these land use types accounts for approximately 1% of the entire annual soil loss from these areas.
3.4. Comparison of erosion rates with runoff plot assessments
To assess the skill of our modelling, we compared the predicted potential soil erosion rates with erosion rates measured on runoff plots collected from the literature(Table 5). All plots were selected according to thefollowing criteria: (i) under natural rainfall conditions and (ii)obtained from direct measurements with site and plot-data descriptions for interpretation were selected. A total of 237 plot data from 22 studies were used in the validation. For each plot, the erosion rate was recorded. The comparison was made by taking erosion rates for both measured and predicted values for the plot locations.

Table 3 Estimates of annual soil loss potential across China
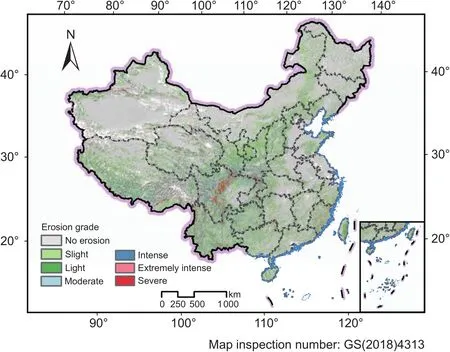
Fig. 4 Map of soil erosion grade of China at 1-km resolution.
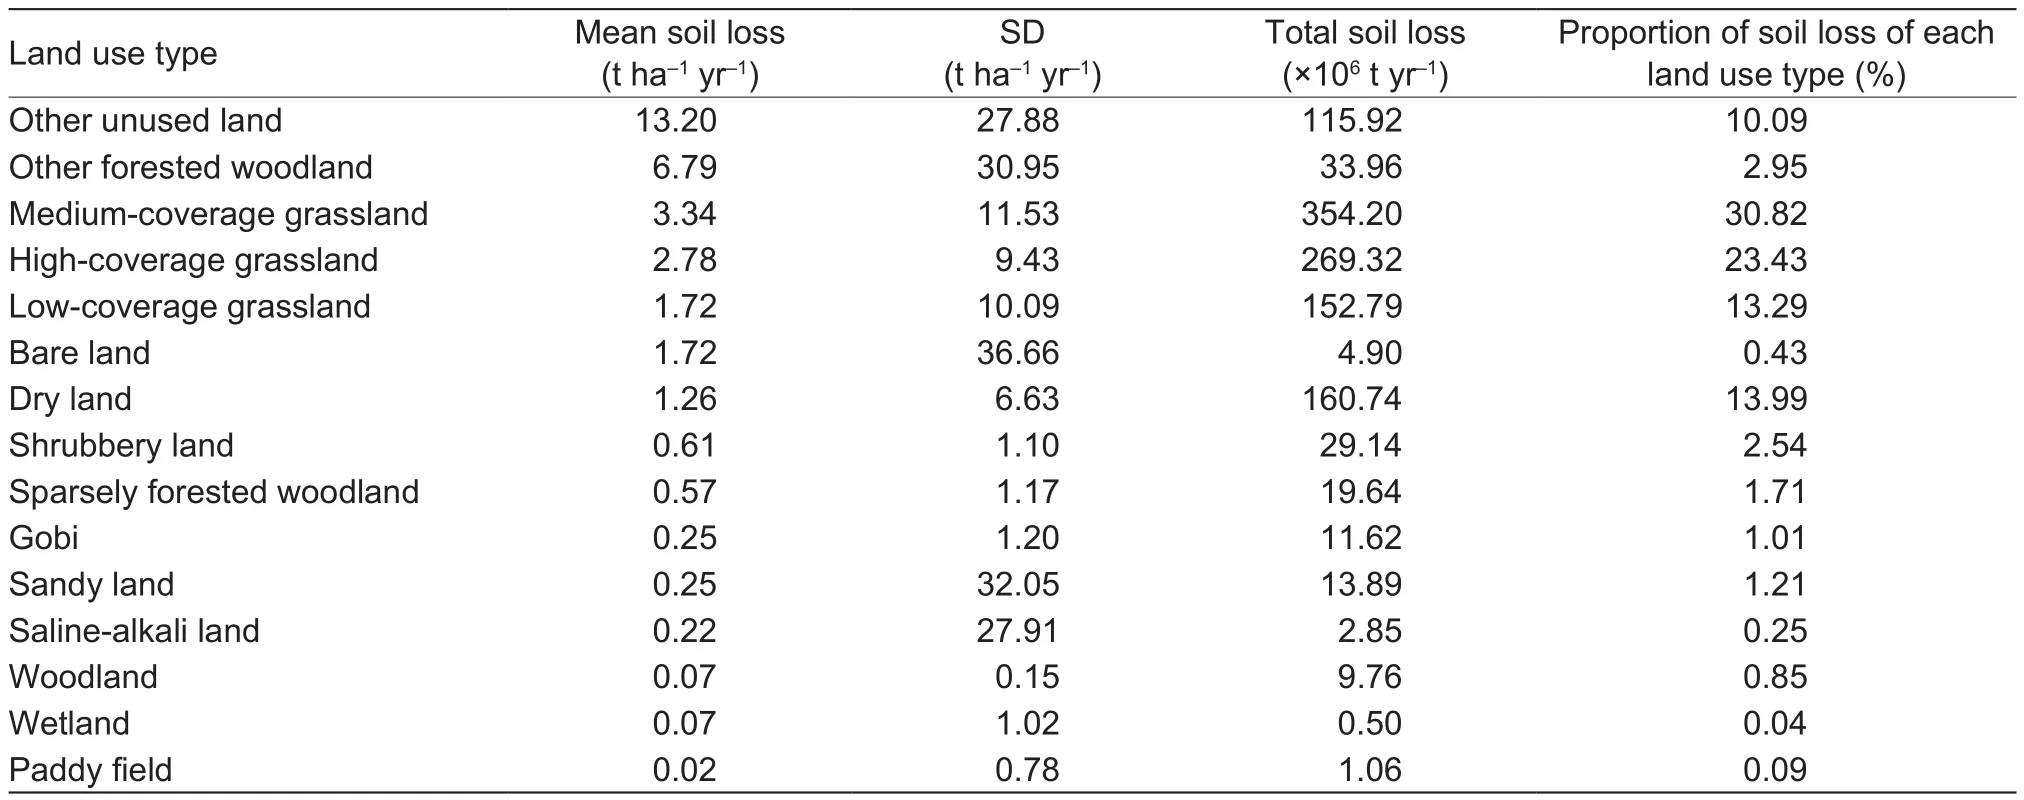
Table 4 Estimates of annual soil loss potential across China by land use types
The relationship between our predictions and the plot measurements is shown in Fig. 5; it has aR2of 0.72 and a RMSE of 22.14 t ha–1yr–1. Our prediction underestimated the relatively high erosion rate (>100 t ha–1yr–1). In general, the potential erosion rates that modelled using RUSLE compares well with erosion rates calculated using runoff plots.
4. Discussion
Previous studies of soil erosion in China were mainly focused on regional (Zhaoet al.2003; Huet al.2010; Fuet al.2011; Zhanget al.2013; Weiet al.2014; Maet al.2016; Sunet al.2016; Zhang and McBean 2016; Wuet al.2017) or watershed scale (Liet al.2010; Miaoet al.2012;Wanget al.2013, 2017; Zhanget al.2014; Duet al.2016;Maet al.2016), and only a few of them were conducted at the national scale (Guoet al.2015; Wang Xet al.2016;Yueet al.2016; Chenet al.2017). Our research is the first attempt to rapidly quantify soil erosion potential in China withthe most current and public sharing data sets.
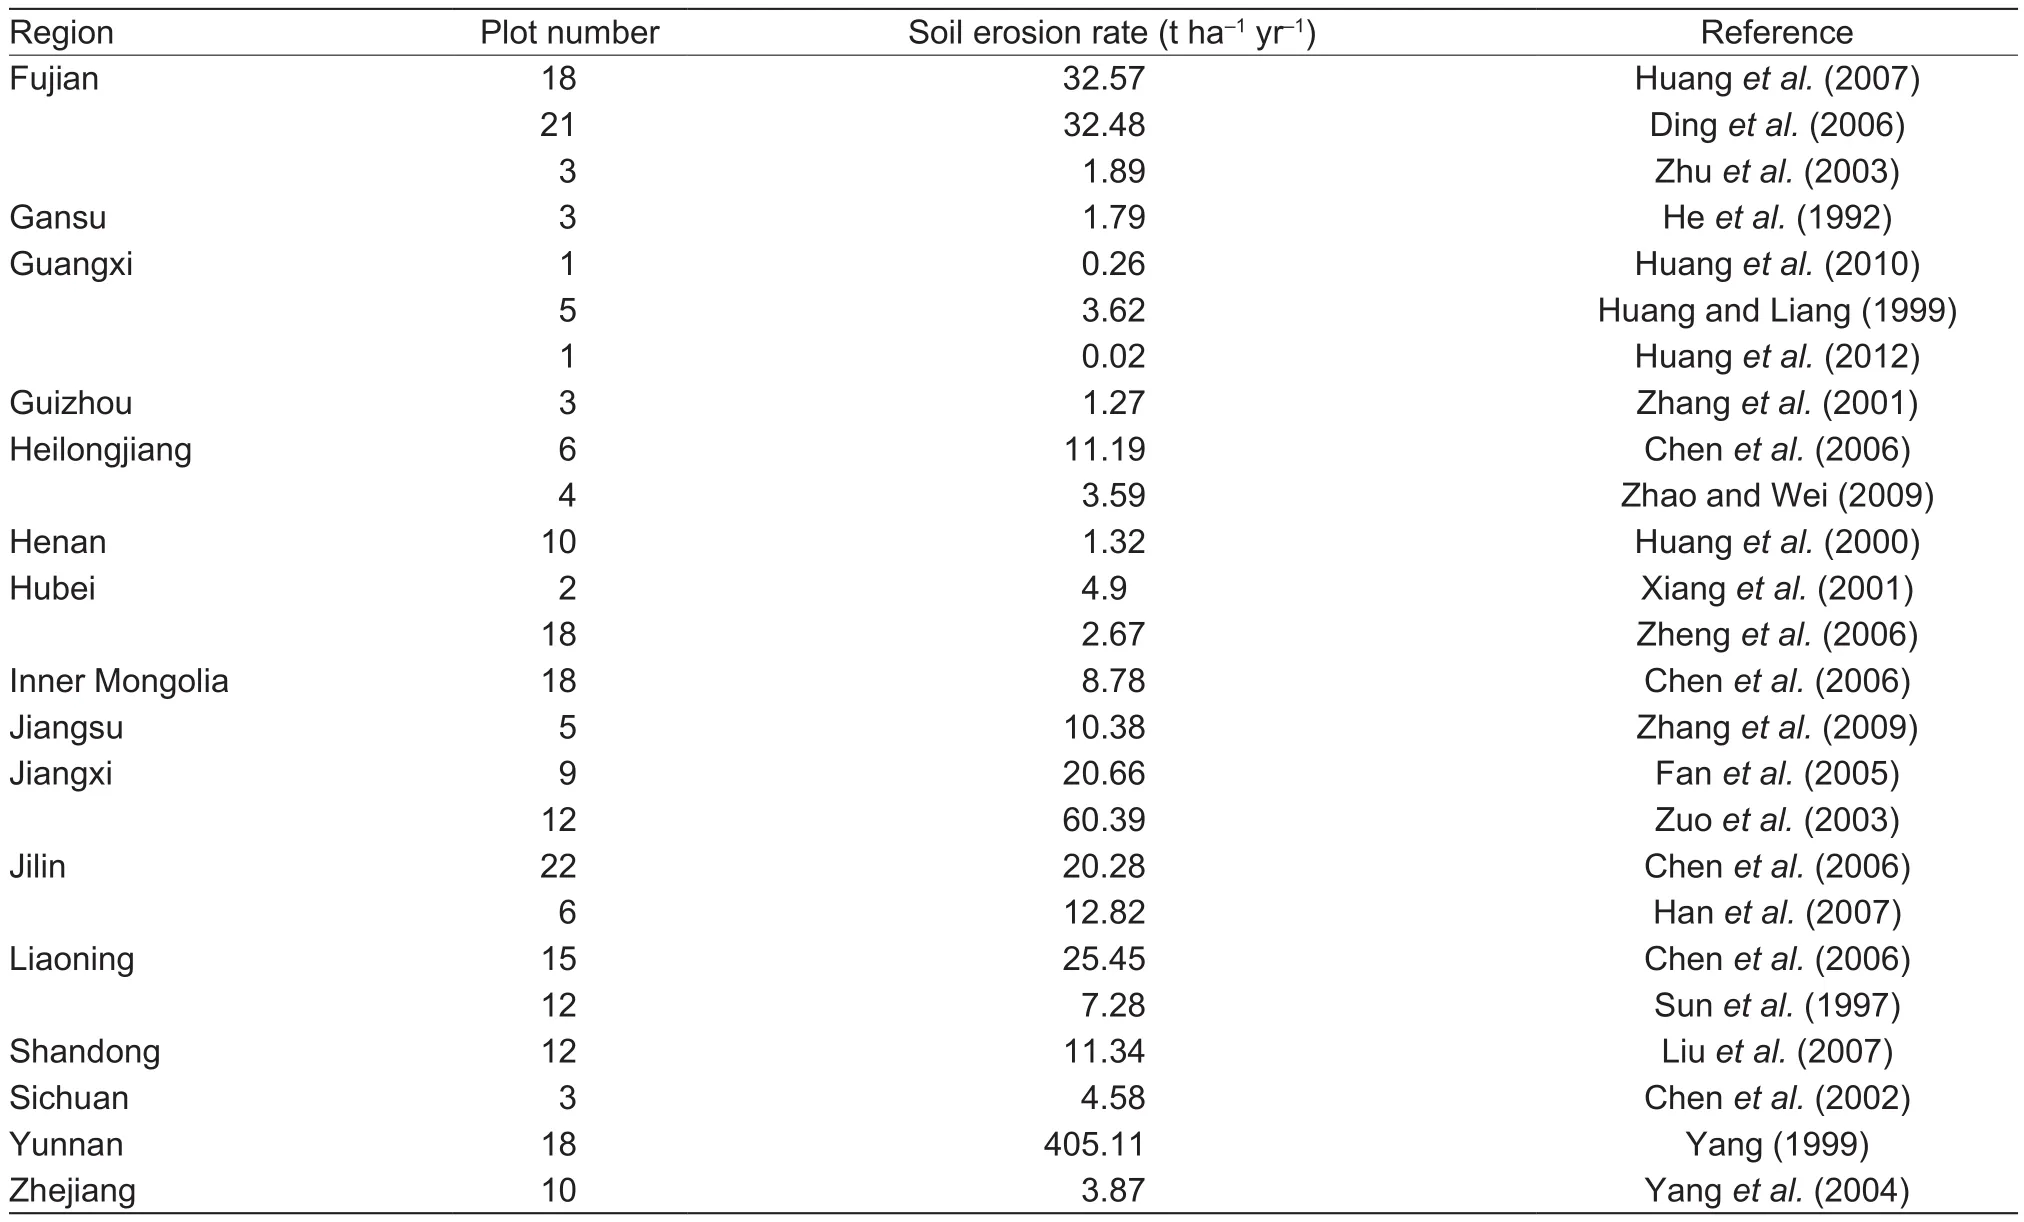
Table 5 Data sources used for validation
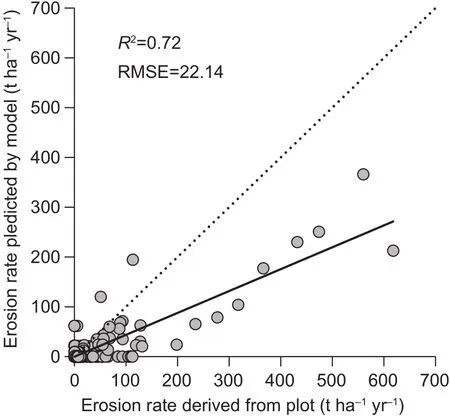
Fig. 5 Comparison between erosion rates predicted by the model used in our study and those derived from runoff plots for 237 sites. RMSE, root mean square error.
The effect of high steep topography (steep and long slopes) is most visible in the southwestern China, which has the highest potential erosion rates, even though relatively high vegetation cover exists in this area. Due to the combination effect of highRandKvalues, the potential erosion risk in southern China is also remarkable. The Tibetan Plateau,which includes Tibet and Qinghai, has a relatively high potential mean and total soil loss because of the large areas it occupies (Table 3). The potential erosion risk on flat land of the Sanjiang Plain, the North China Plain and the Middle-Lower Yangtze River, which are the main grainproducing areas in China, is low because of the flat terrain and advanced farming management, therefore, the amounts of soil erosion resulting from water runoff could be negligible.The Loess Plateau, which is one of the most severely eroded area in the world, showed a significant declining trend of soil erosion thanks to ecological construction and the increment in vegetation cover. Over the last ten years, the Grain-to-Green Program has been witnessed to be effective in improving land cover and decreasing erosion risk in the Loess Plateau(Sunet al.2014).
Soil loss potential on the high canopy cover land,particularly on the woodland and shrubbery land, is lower than that on the low canopy cover land, such as other forested woodland, low-coverage grassland and bare land.Grasslands are mainly distributed in western China at high altitude, high-coverage grasslands that accounted for more than half ground cover showed lower potential erosion rates than medium-coverage grasslands. Dense vegetation cover acts a pivotal part in reducing the loss of soil by decreasing the velocity of raindrops and protecting them from directly scouring soil surface particles (Weiet al.2010). The dense vegetation slows land surface water flow and its root system decreases runoff by improving soil characteristics (Sunet al.2014). Terrace fields, which usually occur on hillsides with a specific slope, have the lowest erosion risks because of the support practice of ridges. The preservation of ridges is crucial for water and soil conservation on steep slopes(Panagoset al.2015b).
In this study, soil erosion in China is estimated based on the RUSLE. RUSLE refers to the net loss of soil by soil erosion, which calculates the quantity of sediment that lands the end of a hillslope. It does not include areas of the slope that experience net deposition. Estimates of potential gross soil loss is inherently inconsistent with net estimates of erosion, as soil can be redeposited elsewhere in the study area. RUSLE has been noted to overestimate soil erosion(Tenget al.2016), and efforts have been made to improve the erosion factors in the RUSLE model to better estimate soil erosion (Xieet al.2016; Zhanget al.2017; Fenget al.2018). This study will apply improved methodologies in evaluating soil erosion potential in China. Our gross estimates of soil loss potential in China are significantly lower than those derived from runoff plot assessments(Table 5 and Fig. 5), especially in southwestern China.The inconsistency between this study’s erosion estimates and former soil erosion research might be due to the new methodologies and more up to date data sources that were collected to calculate erosion factors in this study, especially the improvement ofRandKfactors.
Rainfall data from rain gauges were used to calculateRvalues. Estimation and mapping ofRfactor over large areas is mainly based on spatial interpolation of limited ground gauges. The accurate estimation ofRis highly dependent on the spatial distribution of the rain gauges and model that used in the interpolation procedure. OurRfactor results were likely to be better because the merged rainfall data were used to estimate daily rainfall and the downscaling methodology was applied to produce a high spatial resolution map ofRacross China. A local study,which was carried out by Fanet al.(2013) and specific to Tibet, con firmed largeRvalues in the southeastern tropical rainforest areas of approximately 12 189 MJ mm ha–1h–1yr–1.Our estimates of theRfactor over this area are consistent with those of Fanet al.(2013). National studies conducted by Liuet al.(2013) and Panagoset al.(2017) showed spatial patterns very similar to ourRfactor distribution in China. Liuet al.(2013) applied daily rainfall data from 590 meteorological stations to calculate theRfactor in China,and our estimations of the averageRvalue for the different climate regions in China were well within theirRvalue ranges. Panagoset al.(2017) used high-temporal resolution rainfall records to assess the globalRvalues and found that China has an average value of 1 600 MJ mm ha–1h–1yr–1with an extreme erosivity value over 15 000 MJ mm ha–1h–1yr–1in the southeastern coastal zones.
The most commonly utilizedKestimators include RUSLE(Renardet al.1997), the Geometric Mean Diameter based model (Römkenset al.1988), and EPIC (Sharply and Williams 1990). Zhanget al.(2008) assessed the suitability of these methods which were used to estimate theKfactor of Chinese soils from natural runoff plots at 13 sites in eastern China, and draw a conclusion that all estimatedKvalues exhibited considerably higher than the measuredKvalues for these sites in eastern China. In this study, an improved method proposed by Zhanget al.(2008) based on the EPIC model was used to calculate theKfactor in China. Moreover, comprehensive soil property data, which is currently available, and environmental factors that might in fluence the process of soil loss were incorporated into the mapping of theKfactor. Zhanget al.(2007) estimatedKvalues in China and showed that theKvalues are typically in the range of 0.007–0.02. Wanget al.(2013) measuredKvalues in China based on long-term observations of natural runoff plots and reported that the most observed values were concentrated in a range of 0.015–0.035. OurKvalues bear a resemblance to the results of Zhanget al.(2007) and correspond to the range of Wanget al.(2013).
Conventionally, theCfactor refers to the combined effect of canopy cover, canopy height, residual cover,below-ground biomass and time; thePfactor could be measured according to the support practice in China.However, measuring these factors across China would be dif ficult and costly. In this study, theCandPfactors are involved with land use type. The methods that we used in this study might not fully expound the content of theCandPfactors. Besides, some uncertainties that produced in theRdownscaling andKmapping procedures will remain in the subsequent soil erosion estimates and thus in fluence the accuracy of the results. Since soil can be redeposited elsewhere in the landscape, our estimates are intrinsically larger when compared with net estimates of erosion. Future efforts should be focused on algorithm improvements and the uncertainty analysis of erosion factors.
5. Conclusion
This study quantitatively estimated and mapped soil erosion potential in China using RUSLE. All of the data that we used for calculating erosion factors are the most detailed and publicly available data set for China. Our estimates are comparable to those made by other studies at the national and local scales. The greatest erosion rates mainly occur in southwestern China, whereas desert areas showed the lowest erosion rates. More than 60% of the total areas of China are in fluenced by soil erosion in a limited way. Other unused land and other forested woodlands have the highest erosion rates, whereas woodland, wetlands and paddy fields have the lowest rates of erosion. The RUSLE is useful for understanding and evaluating soil erosion potential over large areas with sparse data. As the most quantitative estimation of soil erosion potential with publicly available data in China, our estimates could support national and regional policy regarding land degradation in China.
Acknowledgements
This work was supported by the National Natural Science Foundation of China (41461063 and 41571339), the China Postdoctoral Science Foundation (2018M630682),the Research Fund of State Key Laboratory of Soil and Sustainable Agriculture, Nanjing Institute of Soil Science,the Chinese Academy of Sciences (Y412201430).
杂志排行
Journal of Integrative Agriculture的其它文章
- Updating conventional soil maps by mining soil–environment relationships from individual soil polygons
- Spatial variability of soil total nitrogen, phosphorus and potassium in Renshou County of Sichuan Basin, China
- Spatial variability of soil bulk density and its controlling factors in an agricultural intensive area of Chengdu Plain, Southwest China
- An integrated method of selecting environmental covariates for predictive soil depth mapping
- Remotely sensed estimation and mapping of soil moisture by eliminating the effect of vegetation cover
- Automatic extraction and structuration of soil–environment relationship information from soil survey reports