Remotely sensed estimation and mapping of soil moisture by eliminating the effect of vegetation cover
2019-02-14WUChengyongCAOGuangchaoCHENKelongChongyiMAOYahuiZHAOShuangkaiWANGQiSUXiaoyiWEIYalan
WU Cheng-yong , CAO Guang-chao, CHEN Ke-long, E Chong-yi , MAO Ya-hui , ZHAO Shuangkai , WANG Qi , SU Xiao-yi , WEI Ya-lan
1 College of Geographical Sciences, Qinghai Normal University, Xining 810008, P.R.China
2 Key Laboratory of Environment and Ecology of Qinghai-Tibet Plateau, Ministry of Education/Qinghai Key Laboratory of Natural Geography and Environmental Processes, Xining 810008, P.R.China
Abstract Soil moisture (SM), which plays a crucial role in studies of the climate, ecology, agriculture and the environment, can be estimated and mapped by remote sensing technology over a wide region. However, remotely sensed SM is constrained by its estimation accuracy, which mainly stems from the in fluence of vegetation cover on soil spectra information in mixed pixels.To overcome the low-accuracy defects of existing surface albedo method for estimating SM, in this paper, Qinghai Lake Basin,an important animal husbandry production area in Qinghai Province, China, was chosen as an empirical research area. Using the surface albedo computed from moderate resolution imaging spectroradiometer (MODIS) re flectance products and the actual measured SM data, an albedo/vegetation coverage trapezoid feature space was constructed. Bare soil albedo was extracted from the surface albedo mainly containing information of soil, vegetation, and both albedo models for estimating SM were constructed separately. The accuracy of the bare soil albedo model (root mean square error=4.20, mean absolute percent error=22.75%, and theil inequality coef ficient=0.67) was higher than that of the existing surface albedo model (root mean square error=4.66, mean absolute percent error=25.46% and theil inequality coef ficient=0.74). This result indicated that the bare soil albedo greatly improved the accuracy of SM estimation and mapping. As this method eliminated the effect of vegetation cover and restored the inherent soil spectra, it not only quantitatively estimates and maps SM at regional scales with high accuracy, but also provides a new way of improving the accuracy of soil organic matter estimation and mapping.
Keywords: soil moisture, remote sensing, bare soil albedo, trapezoid feature space, Qinghai Lake Basin
1. Introduction
Soil moisture (SM) is a basic requirement for plant growth and development. It directly involves the material and energy cycles of land surface/atmosphere interface and thus effects on hydrological, biological and biogeochemical processes (Wang and Qu 2009). It indirectly determines the absorption, re flection, and emission of short-wave solar radiation and long-wave earthly radiation, thus affecting and changing the energy balance of the earth surface system. Therefore, it plays an important role in the study of climate, hydrology, ecology, agriculture and the environment(Legateset al.2011).
Traditional methods of measuring SM, including the gravimetric method, e.g., the drying and weighing method(Yi 2009), provide a measurement of the collected sample,and are able to generate accurate point measurements,However, they are local measurements, and are dif ficult to widely apply at regional scales. Remote sensing (RS)technology, with the advantage of high temporal resolution,wide coverage and low cost, has become the main technical means of detecting and monitoring SM and other soil properties in large regions (Tanget al.2010). Previous optical RS studies have mainly applied visible, near infrared,shortwave infrared, and thermal infrared spectra to estimate SM. The main methods are as follows: spectral re flectance methods (Schmugge 1983; Wagneret al.1999; Ahmadet al.2010; Sha fian and Maas 2015); shortwave infrared water indices, e.g., shortwave infrared perpendicular water stress index (SPSI; Ghulamet al.2007), and shortwave infrared water stress index (SIWSI; Zhaoet al.2013); vegetation index methods such as vegetation condition index (VCI;Kogan 1990); thermal inertia method (Watsonet al.1971);and temperature vegetation dryness index (TVDI; Sandholtet al.2002). These methods have achieved good results in estimating SM, but some of them have certain limitations based on land surface conditions, including the thermal inertia method (applicable in bare soils), and temperature/vegetation indices (e.g., surface temperature (Ts)/normalized difference vegetation index (NDVI), applicable in vegetated areas) (Zhaoet al. 2010), these methods are especially limited in determining vegetation coverage. It is therefore necessary to explore new RS methods for estimating SM by eliminating or reducing the effect of vegetation cover.
As the basic unit of quantitative RS, RS pixels usually contain energy re flected from more than one type of land use such as soil or vegetation (Meiet al.2008), and are thus regarded as mixed pixels. In this case, vegetation has a large effect on soil re flectance, resulting in a decrease of SM estimation accuracy. Therefore, to further improve SM estimation accuracy, it is necessary to eliminate or reduce the contribution of vegetation re flectance in mixed pixels. Three methods, spectral mixture analysis (SMA),optical vegetation coverage (OVC; advanced by Liuet al.1995) and trapezoid feature space (Carlson 2007), were proposed to eliminate the interference of vegetation in soil spectra. Among several SMA models, linear mixed models(LMM) and non-linear mixed models are widely used (Chenet al.2016). LMM has a clear physical meaning and is the most widely used model but requires input of the various ground object spectra which are dif ficult to obtain. Nonlinear mixed models have good mixed-pixel decomposition effect but have the disadvantage of complicated calculation process. Therefore, although SMA has achieved good results, there are still some disadvantages in application(Lv 2003). The OVC method successfully converts mixed pixel spectra into bare soil spectra by determining the biomass of completely vegetated areas and areas with no vegetation. Obviously, such areas rarely appear in some regions and might not be found in satellite imagery. The trapezoid feature space is formed by the scatter plots of land surface temperature/vegetation index, or albedo/vegetation index, etc. Because it does not rely on ground observation data and can be combined with other models e.g., surface energy balance algorithm for land (SEBAL, Bastiaanssenet al.1998), trapezoid feature space can be used to estimate vegetation transpiration, surface flux, soil evaporation, and soil water content. In the early 1990s, Price (1990) analyzed the related variations of satellite-derived land surface temperature (LST) to the NDVI computed from satellite visible and near-infrared data, and proposed LST/NDVI feature space and estimated regional evapotranspiration.Nemaniet al.(1993) found that the Ts/NDVI relationship was sensitive to surface SM. Roerinket al.(2000) proposed a Ts/albedo trapezoid and estimated regional land surface heat fluxes. Zhanget al.(2008) found that the scatter plots of albedo/vegetation coverage formed a trapezoid. In addition,for the time requirements of agriculture-animal husbandry production and other activities (for instance, during critical crop growth periods, SM needed to be monitored daily),SM data should be obtained rapidly and updated in a timely manner, and the corresponding RS time resolution should be high. The moderate resolution imaging spectroradiometer(MODIS), which is able to perform a high-time resolution viewing of the entire surface of the earth every one to two days, can meet the time requirements of monitoring SM.
In this study, using MODIS RS data and actual measured SM data obtained from field soil investigations, we developed a simple RS method for estimating and mapping SM at a regional scale and applied it to the Qinghai Lake Basin empirical research area. Specifically, we address the following aims: 1) to extract the bare soil albedo from the MODIS surface albedo, which is composed of mixed pixels, for eliminating the in fluence of vegetation spectra on soil spectra by constructing a surface albedo/vegetation coverage trapezoid space; 2) to show the feasibility and superiority of this method by comparing estimated SM results from the existing surface albedo model and the bare soil albedo model, and thereby map SM at a pixel scale;and 3) to improve the RS estimation accuracy of SM and other terrestrial parameters in a land surface process study and to provide a model that can also be used in ecology,agriculture, and other environmental fields of study.
2. Data and processing
2.1. Experimental area
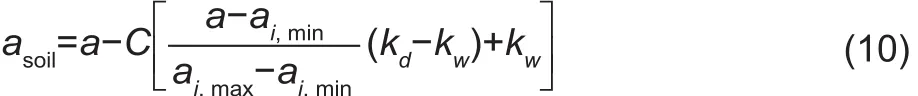
The Qinghai Lake Basin, which lies on the northeastern edge of the Qinghai-Tibetan Plateau (Fig. 1), is a center of ecotourism and an important animal husbandry production area in Qinghai Province, China, with a cold climate and a long freezing season. Its average annual air temperature from 1951 to 2007 was 1.2°C. Its main vegetation types areBlysmus inocompressus,Kobresia humilis,Stipa purpureaandElymus nutans. Its main soil types are inceptisols,mollisols, entisols, histosols, and aridisols. Due to spatial heterogeneity of vegetation in the area, soil and terrain altitude greatly varied, and Qinghai Lake Basin can be taken as a typical empirical research area to test the feasibility and accuracy of estimating SM models under conditions of varied vegetation and diverse soil types.
2.2. Field data
The SM data of field measurements can be used as true values to construct SM estimation models and validate their accuracy. In early October 2016, grasses and other vegetation in Qinghai Lake Basin stopped growing and vegetation cover reached the highest level of the year, resulting in the best time to verify the effect of eliminating vegetation cover. During this time period, according to sampling method based on soil pro file (Tianet al.2007), we collected soil samples of three surface soil layers (0–10, 10–20, and 20–30 cm) using a ring sampler to take soil in the middle of each layer, and recorded the location of samples with a handheld GPS receiver. All samples were brought back to the laboratory.First, the aluminum box was placed into an oven at 105°C and baked for 2 h, and was then weighed by an electronic analytical balance, with a precision of 0.0001 g. Second,the lid of the aluminum box was placed under the aluminum box, soil from the depth of 0–10 cm was put into the box,then the box was placed into the oven at 105°C and baked for 8 h. Third, the aluminum box was removed from the oven, and its lid was placed on top of the box, and the box was then placed in a dryer for cooling and weighing. This operation continued until the difference in weight between two replicates was no more than 3 mg.
SM was calculated as follows (Zhanget al.2005):
SM (%)=(W1–W0)/(W0–W)×100
Where,W1is the weight of wet soil,W0is the weight of dry soil, andWis the weight of aluminum box. Thus, in this study, SM represents the soil mass water content.
Twenty-two effective samples of surface (0–10 cm) soil were obtained. The locations where these samples were collected are shown in Fig. 1. Eleven samples, with elevation ranges from 3 203 to 3 809 m, were used for building the existing surface albedo model and the bare soil albedo model, and the remaining eleven samples, with elevation ranges from 3 203 to 3 662 m, were used to verify accuracy of the models. The samples for both building and validating models appeared to have roughly the same altitude ranges and a balanced spatial distribution in the study area.

Fig. 1 Location of Qinghai Lake Basin, China and soil sample points.
2.3. RS data
MODIS is an earth observing system (EOS) instrument onboard the Terra and Aqua platforms, which were launched in December 1999 and May 2002, respectively, having 36 spectrum bands between 0.405 and 14.385 μm. MYD09A1,the MODIS 8-day composite surface re flectance product,provides re flectance values for bands 1–7 at 500-m spatial resolution (Kwaket al.2014). The bands were corrected for the effects of atmospheric gases, aerosols, and cirrus clouds (Vermote and Vermeulen 1999). To ensure that the MODIS data acquisition time and soil sampling time were as close as possible, MYD09A1 data with an imaging time of October 7, 2016 were obtained from the NASA EOS.
3. Methods
3.1. Method of SM estimation
The relationship between surface albedo and SM is usually expressed as follows (Liuet al.1995):

Where,ais the surface albedo,Pis percent gravimetric SM, andmandnare undetermined coef ficients.
Taking the natural logarithm of both sides of eq. (1):

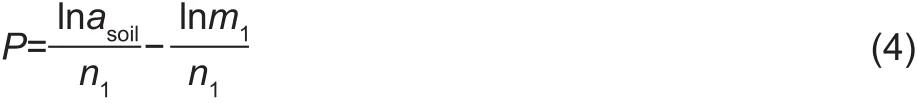
As noted in the previous section, to eliminate the in fluence of vegetation on soil spectra, we used bare soil albedoasoilin place ofain eq. (1). The undetermined coef ficientmandn, correspondingly becomesm1andn1, given by:

Similarly, taking the natural logarithm of both sides of eq. (4), gives:
Eqs. (2) and (4), defined the estimation SM method using surface albedo and bare soil albedo, respectively. Surface albedoa, can be computed from RS re flectance data, and the bare soil albedoasoil, can be obtained from the trapezoid feature space.
3.2. Trapezoid feature space
Some methods (e.g., TVDI) usually need constructions of triangle or trapezoid feature spaces to estimate SM (Zhaoet al.2013). Because LST, NDVI, albedo, and vegetation coverage can indirectly express SM information, the trapezoid feature spaces of LST/NDVI (Price 1990; Wanget al. 2007), NDVI/Albedo (Gutman and Ignatov 1998) and albedo/vegetation coverage (A/VC, Zhanget al.2008; Pan and Li 2010), can be used to estimate SM. In mountainous areas, the accuracy and stability of LST obtained from RS retrieval cannot be easily guaranteed, so in this study, SM was estimated by A/VC trapezoid feature spaces.
Surface albedo/vegetation coverage trapezoid feature space is shown in Fig. 2. The four points,asd,avd,avw, andasw, form a trapezoid. Among them, pointasdand pointaswrespectively indicate the largest and the smallest bare soil albedo with vegetation coverage that equals zero. Pointavdand pointavwrespectively indicate the largest and the smallest vegetation albedo whose vegetation coverage equals 100%.The upper boundary line, determined by pointasdand pointavd, is called the “theoretical dry edge” and indicates that the soil is extremely dry under a given vegetation coverage condition. However, in practical application, the “theoretical dry edge” cannot be obtained accurately and is usually replaced by the “actual dry edge”, which is formed by the maximum values of the actual surface albedo corresponding to vegetation coverage changes (in Fig. 2, “actual dry edge”was determined by pointai,maxand pointaj,max). The line of“theoretical wet edge”, determined by pointavwand pointasw,indicates that the SM is suf ficient. Similarly, the “actual wet edge” (in Fig. 2, it was determined by pointai,minand pointaj,min) is usually used in practical application.
Once the four points (asd,avd,avwandasw) of the trapezoid were determined, SM isolines, which lie between the“theoretical dry edge” and the “theoretical wet edge”, can be calculated by linear interpolation (Tianet al.2009). On the basis of SM isolines, bare soil albedo can be obtained easily.
3.3. Calculation of bare soil albedo
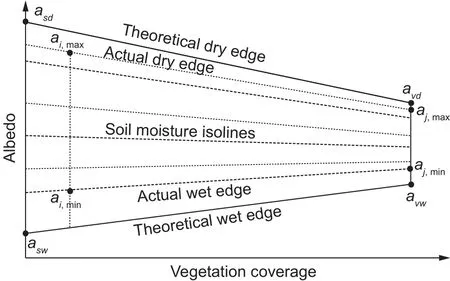
Fig. 2 A schematic of surface albedo/vegetation coverage trapezoid space, modi fied from Zhang et al. (2008), Tian et al.(2009), Pan and Li (2010).
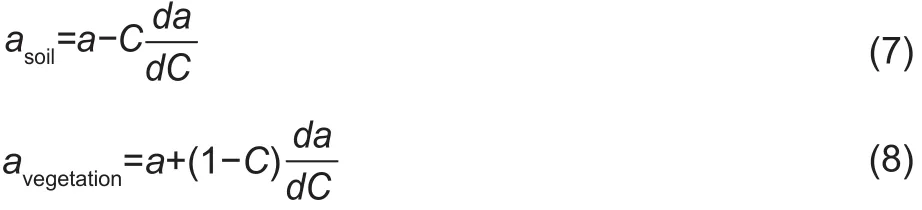
Land surface albedo, is mainly dependent on local vegetation and soil characteristics (Gascoinet al.2009),and pixels mainly contain information of energy re flected from soil and vegetation. Thus, it is a weighted sum of soil and vegetation albedo, and is defined as follows (Zhanget al.2008):

Where,Cis the vegetation coverage, andasoilandavegetationrespectively represent the albedo for fractions of soil and vegetation. TakingCas the independent variable, the derivative operation is performed on eq. (5), and a new eq.(6) was obtained:

Eqs. (7) and (8) were obtained from eqs. (5) and (6):
Where,aandCcan be computed from RS data. To calculateasoil, theda/dC, the slope of SM isolines, should be obtained. So,kis set asequal toda/dc,k=da/dC. By linear interpolation,ki(i=1, 2, 3…), was obtained, and is shown in eq. (9):
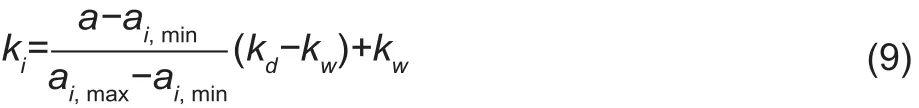
Where,kdandkwrespectively represent the slope of theoretical dry edge and theoretical wet edge. In practical application, they are typically replaced by the slope of the actual dry edge and the actual wet edge. The remaining parameters and their meanings are shown in Fig. 2.
From eqs. (7) and (9), the bare soil albedoasoilwas obtained:
Through eq. (10), we successfully achieved separation of the mixed pixels of surface albedo and obtained the bare soil albedoasoil, thus eliminating the vegetation effects.
3.4. Calculation of the main parameters a and C
MODIS broadband surface albedo,a, was calculated by the formula proposed by Liang (2001):

Where,ai(i=1, 2, 3, 4, 5 and 7) is MODIS’ bands (bands 1–5 and band 7).
The vegetation coverage,C, is calculated as follows(Gutman and Ignatov 1998):

Where, NDVIvegetationis the NDVI value of the fractional vegetation (full vegetation), and NDVIsoilis the NDVI value of fractional soil (bare soil, without vegetation). We calculated the frequency of all NDVI values and ultimately chose the 2% accumulated frequency of NDVI values as the NDVIsoiland chose the 98% accumulated frequency of the NDVI value as the NDVIvegetation(Nieet al.2008).
NDVI is calculated as follows:

Where, RED and NR are the albedo of the MODIS first band (red, with the central wavelength of 0.645 μm and width of 0.620–0.670 μm) and second band (near infrared,with the central wavelength of 0.859 μm and width of 0.841–0.876 μm).
3.5. Accuracy assessment
The correlation coef ficient (R2), root mean square error(RMSE), mean absolute percent error (MAPE), theil inequality coef ficient (TIC), absolute error (AE), and relative error (RE) were used to assess model accuracy, and are defined as follows:
Where,SMest,iandSMmeas,iare the estimated and measured values, andnis the number of measurements.
4. Results and discussion
4.1. Bare soil albedo
As discussed above, the extreme values (maximum,minimum) and other values of vegetation coverage and surface albedo should be obtained to draw the scatter plot of albedo/vegetation coverage. Because surface albedo is closely related to ground objects, we comprehensively considered the characters of vegetation coverage and typical ground objects such as desert and water bodies, and then selected the sampling regions on the MODIS false color composite image (bands 1, 2, and 3) (Fig. 3).
Desert can be regarded as a very dry surface, and its albedo is almost equal to the albedo of dry bare land(vegetation coverage is approximately equal to zero). Desert is widely distributed in the east of the experimental area, and two typical sampling regions were selected. Broad water bodies can be seen as a very wet surface, and its surface albedo is approximately equal to the albedo of extremely wet bare land (vegetation coverage is approximately equal to zero), and its alternative feasibility has been scientifically demonstrated (Carlson 2007). A typical sampling region was selected inside Qinghai Lake Basin. Considering the characteristic of surface albedo under different vegetation coverage conditions, vegetation coverage was divided into four classes (no coverage, less coverage,more coverage and basic full coverage) and sampling regions were delineated at different vegetation coverage classes.
These sampling regions were selected based on vegetation coverage levels and typical land use types such as water body and desert. In these sampling regions, the grid points (500 m×500 m) were generated according to the spatial resolution of MODIS data, and the corresponding surface albedoaand the vegetation coverageCwere obtained at these gird point locations.
Through the above operation programs, we obtained the grid points having surface albedo and vegetation coverage attributes, and the values of albedo and vegetation coverage, and deleted the grid points having outlier values.Outliers were caused by data quality of MODIS products and their vegetation coverage values ofC<0 orC>1. We deleted the special values of vegetation coverage (C<0, orC>1), and then usedaandCvalues of these grid points to draw the scatter plot of actual albedo/vegetation coverage trapezoid space (Fig. 4).
The four coordinate points of the trapezoid:amax(0.0321,0.3220), B (0.4833, 0.1575),C(0.4833, 0.1155) andamin(0.0321, 0.0735), were obtained. Accordingly, we easily obtained the slope of the actual dry edge,KAB=–0.3646 (KABequals tokdin eq. (10)) and “actual wet edge”,KDC=0.0931(KDCequals tokwin eq. (10)). With linear interpolation, we obtained the slope of any SM isolines,ki(eq. (19)) and the bare soil albedo,asoil(eq. (20)):
4.2. model of SM estimation
From eqs. (2) and (4), it was easy to find that the percentage of soil moisture P is linearly related to the natural logarithm of surface albedoaor bare soil albedoasoil, so we applied regression analysis of the actual measured SM anda(orasoil) to construct their corresponding estimation model and evaluated their simulation precision with the determination coef ficientR2(Fig. 5).
The surface albedo model:
P=–7.6668lna+6.172,R²=0.3254
The bare soil albedo model:
P=–9.9943lnasoil+2.8518,R2=0.8074
It is well known that the larger theR2, the higher the model accuracy. It is obvious that the accuracy of bare soil albedo is higher than that of the surface albedo model.
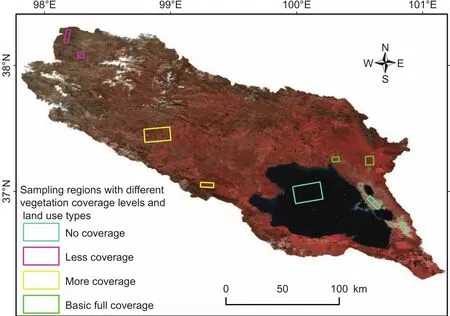
Fig. 3 Sampling regions for obtaining the values of surface albedo and vegetation coverage.
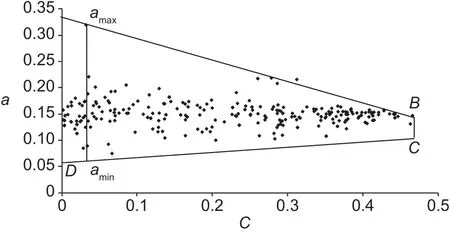
Fig. 4 The actual albedo/vegetation coverage trapezoid space formed by scatter plot between surface albedo and vegetation coverage. a and C represent the surface albedo and vegetation coverage, respectively.
4.3. Comparison of model accuracy
The errors between estimated SM from the two models and the actual measured SM data were analyzed (Table 1). For all samples except C04-1, D11-1, and A10-1, the AE and RE of the bare soil albedo model were smaller than those of the surface albedo model. The model errors increased rapidly when SM was less than 10.0%. In addition, the RMSE, MAPE and TIC of the bare soil albedo model were smaller than those of the surface albedo model.
The above analysis provided evidence that the bare soil albedo model, which eliminated the effect of vegetation on soil spectra, has greatly improved SM estimation accuracy.
4.4. SM mapping and spatial heterogeneity analysis
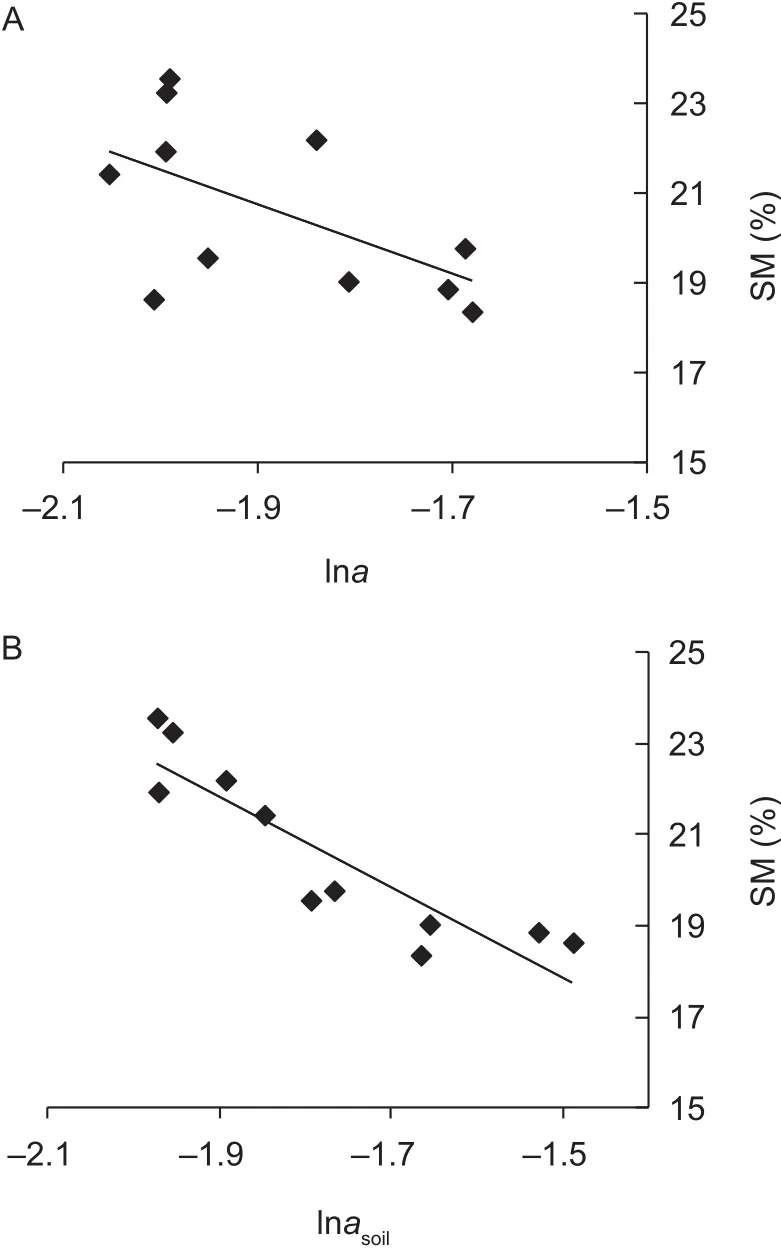
Fig. 5 The soil moisture (SM) estimation model. A, surface albedo model. B, bare soil model. lna and lnasoil represent the natural logarithm of surface albedo and bare soil albedo,respectively.
Based on the bare soil albedo model (P=–9.9943lnasoil+2.8518), we obtained the estimated SM value of each pixel with the raster calculation module of ArcGIS 10 software(ArcGIS Resources 2014). To display the SM spatial pattern,SM must be classi fied by grouping values. The smaller the number of classifications is, the more easily the law of SMmacroscopic spatial patterns and its main in fluence factor can be found, but some details of SM microscopic spatial patterns were lost and thus its local in fluence factors cannot be found easily. Taking the macroscopic spatial distribution law and its local details into account, in ArcGIS 10 software,we defined nine classes through the Jenks classification tool and mapped SM at pixel scales (Fig. 6). From the perspective of mathematics, the estimated result represents the SM values at certain depths (the middle of soil layer(0–10 cm)). But, from the perspective of SM products at regional scales (O’Neillet al.2010), the result of expression of RS for retrieving SM, and application requirements of agrometeorological monitoring, the estimated result provided SM values at a certain range of depths (0–10 cm).Specifically, the map in Fig. 6 represents the land surface(0–10 cm) SM.
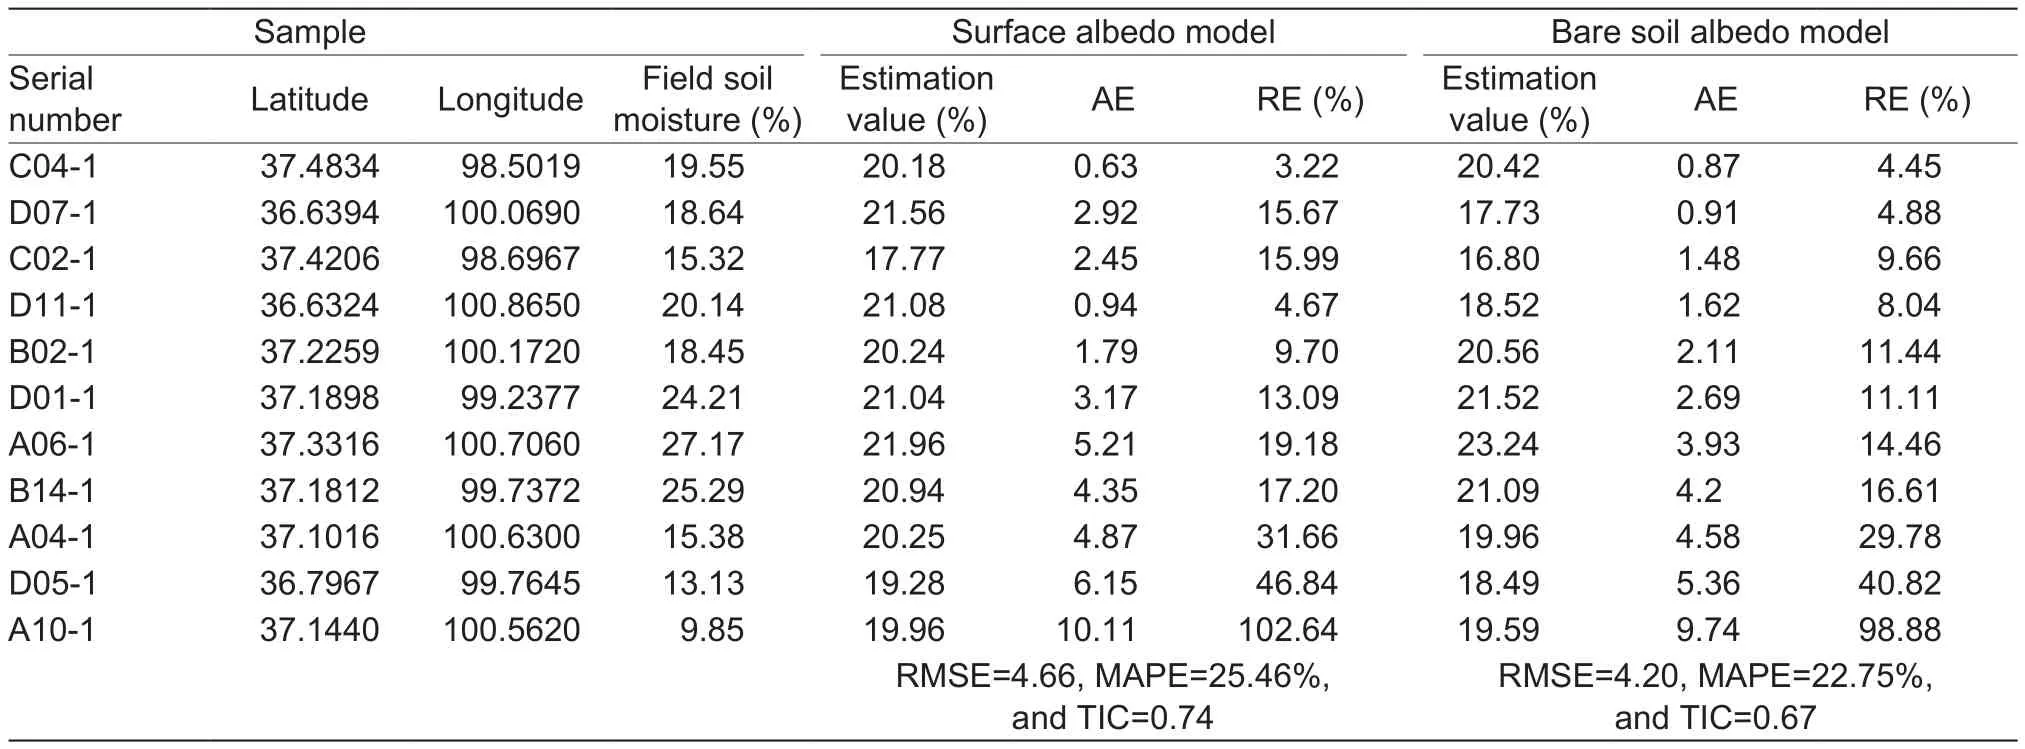
Table 1 Comparison of accuracy from two estimation models1)
SM was lower in the southeast and northwest of Qinghai Lake Basin. The southeast is widely covered by a desert which has low SM. In the mountainous northwest, the elevation is higher and the soil type is alpine, which has low SM.
Through spatial statistical analysis, it was found that the top-ranking values of SM were 19–21, 21–24, and 16–19%,which accounted for 36.29, 32.70, and 19.42% of all data,respectively. The values of SM less than 10% accounted for 0.22%, only a small portion of the total SM. Among these SM values, some negative values were caused by data quality of MODIS composite products.
Using the soil type map, the statistical characteristics of SM were obtained for different soil types through spatial statistical analysis (Table 2). Histosols soil is located in the low-lying belts of river sources, mountains, valleys and lake plains. Naturally, its SM is the highest, with an average value of 21.7%, minimum value of 12.9%, and maximum value of 75.8%. Inceptisols is mainly distributed in the relatively flat plateau-planation surface which is bene ficial to collect and preserve SM. Therefore, its SM is relatively high, with an average of 20.9%. Aridisols is located in the edge of small basin depressions. This terrain is also useful for stopping water from flowing away, but there is strong evaporation, causing soil salinity to gradually accumulate to land surface, leading to decreasing SM. So, taken together,the SM of Aridisols is relatively high. SM estimation results,at an average value of 21.1%, were reasonable. Mollisols is developed in semi-humid cold climatic region, and is mainly distributed in the lake terraces, with vegetation of alpine grassland. Therefore, its SM is relatively small, with an average value of 20.5% and a minimum value of 1.2%.Entisols is mainly distributed in mountain ridges, moraine terrace, and flowstone beach, and is filled with a large amount of gravel resulting in strong water permeability. Therefore, its SM is the minimum, with the average value of 19.4%. Overall,SM estimation results were consistent with the characteristics of soil types and terrain in Qinghai Lake Basin.
4.5. Factors in fluencing the estimation of SM
At regional scales, SM is in fluenced by many factors, such as topography, soil properties, vegetation type, and land use(Fuet al.2003; Korreset al.2015). These factors control SM spatial distribution. SM spatial pattern and its in fluence factors were analyzed using digital elevation model (DEM)data and high-resolution RS images derived from Google Earth.
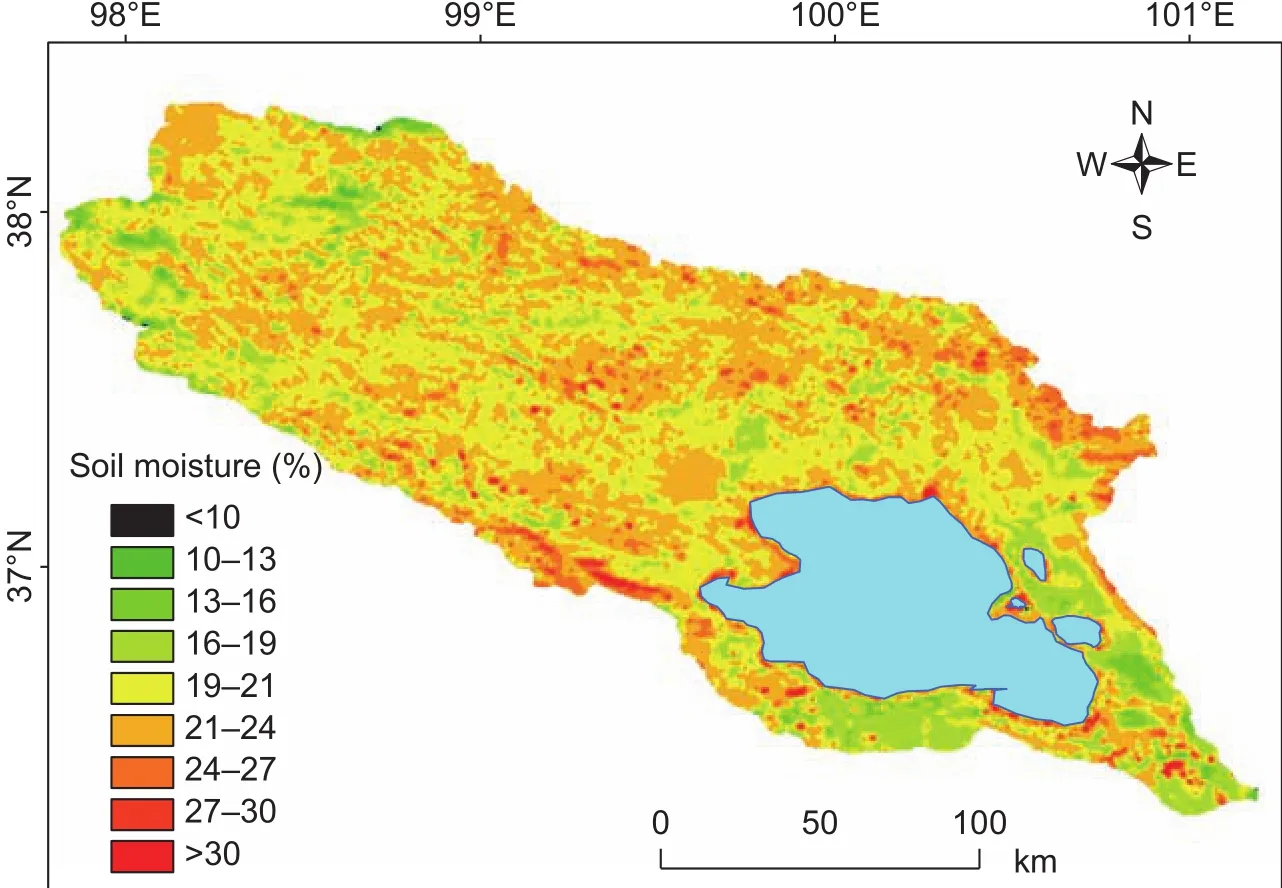
Fig. 6 Prediction map of soil moisture at Qinghai Lake Basin, China (early October 2016).

Table 2 Soil moisture of major soil types in Qinghai Lake Basin,China (early October 2016)
The estimation SM was high in the river valley, arable land, and the midfan of the alluvial fan (Fig. 7), as well as in regions adjacent to water bodies, for example, around the lake (Fig. 6) and river valley (Fig. 7-C). Tillage was found to change soil structure and improve soil water-holding capacity (Fig. 7-A). The midfan contains more siltstone and has poor water permeability, so its SM was high (Fig. 7-B).The SM at the ridge was low, probably due to the strong wind and high level of water vapor transport (Fig. 7-D). Thus, at regional scales, SM of Qinghai Lake Basin was affected by topography, soil type, land-use pattern, and geological structure, which was mostly consistent with findings by Zhaoet al.(2014) and Yeh and Eltahir (1998).
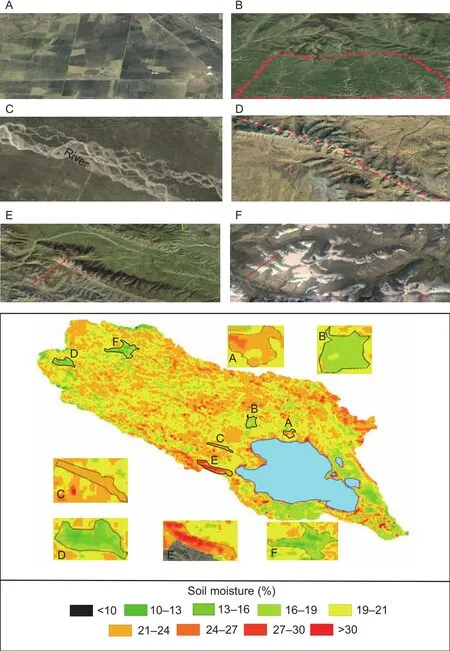
Fig. 7 Regional scale in fluence factors of remotely sensed estimation soil moisture. A, arable land. B, midfan. C, river valley.D, mountain ridge. E, terrain shadow. F, claciers and snow.
In terrain shadow, glacier and snow-covered regions,the estimated SM values were not in accordance with the real scenario. In the terrain shadow, SM values were high and were not so consistent with the actual data (Fig. 7-E).Terrain shadow is affected by terrain factors, e.g., slope and aspect, and therefore receives diffuse sky radiation, and re flected and diffuse radiation comes from adjacent ground objects, instead of direct solar radiation, so the pixel radiance value becomes correspondingly smaller than the true values(Songet al.2017). In Qinghai Lake Basin, SM values were negatively correlated with the natural logarithm of albedo computed from the pixel radiance value, which results in a high estimate of SM. The effect of terrain shadow can be reduced by topographic correction methods, e.g., Minnaert model (Smithet al.1980) or Cosine model (Teillet 1982). SM values were lower at the glacier and the land surface where the land was covered by snow (Fig. 7-F). This phenomenon is not surprising, and it is still challenging to account for the impact of snow cover in SM mapping (Kerret al.2010).
5. Conclusion
Since vegetation cover in fluences the visibility of surface soil to a remote sensing sensor, it is dif ficult to distinguish bare soil albedo from surface albedo, and vegetation cover greatly affects the accuracy of remote sensing estimates of SM. In this study, we extracted bare soil albedo through a surface albedo/vegetation coverage trapezoid feature space, for which we needed to select typical ground objects (e.g., water, desert and other objects with different vegetation cover) from the MODIS image to construct the model, thereby eliminating the in fluence of vegetation on soil re flectance. The feasibility and accuracy of our method were tested by empirically estimating and mapping SM in Qinghai Lake Basin, which has a variety of vegetation and soil types.This study reduced the limitations of some existing methods that can be only applied at certain land surface conditions.
(1) The bare soil albedo,asoil, was calculated by the MODIS broadband surface albedo,a, and vegetation coverage,C, the parametersaandCcan be computed from MODIS RS data. This study provides a reference that can be used to calculate the bare soil albedo of other satellite remote sensing data, such as ASTER, LandSat, HJ-1A/B,and others.
(2) The error (AE, RE, RMSE, MAPE and TIC) of the bare soil albedo model was smaller than that of the existing surface albedo model, which proved that the bare soil albedo model greatly improved the estimation accuracy of SM. The use of bare soil albedo provides a new way for remote sensing estimates of other soil properties such as soil organic matter and the content of N, P, and other elements.
(3) Overall, SM-estimated results of bare soil albedo model were consistent with the characteristics of soil waterholding capacity in Qinghai Lake Basin.
But in the terrain shadow, estimates of SM were a little bit higher. The reason for this is that the orographic effect makes the pixel values smaller than the true ones, resulting in higher estimations. The orographic effect could be eliminated or reduced by topographic correction.
Other water bodies such as rivers, ponds, and reservoirs can be used to determine the actual wet edge. Some ground objects with a lower water content, whose color is brighter on the surface albedo image, can be used to determine the actual dry edge, but it is necessary to make sure that the trapezoid is formed.
Soil re flectance decreases with increasing SM, but when the SM exceeds the maximum soil capillary water capacity,it is no longer reduced. In this case this method does not estimate SM.
In the future, more field SM data will be acquired at 5 cm depth intervals to further verify this method. Moreover,multi-temporal remote sensing will be used to verify this method at different stages of vegetation growth.
Acknowledgements
This work was supported by the National Philosophy and Social Science Foundation of China (14XMZ072), the Natural Science Foundation of Qinghai Province, China(2017-ZJ-901 and 2014-ZJ-723), the National Natural Science Foundation of China (40861022 and 41661023),and the Cooperative Scientific Research Project of “Chunhui Plan”, Ministry of Education of China (Z2012092 and S2016026).
杂志排行
Journal of Integrative Agriculture的其它文章
- Digital mapping in agriculture and environment
- Maize production under risk: The simultaneous adoption of off-farm income diversification and agricultural credit to manage risk
- miR-34c inhibits proliferation and enhances apoptosis in immature porcine Sertoli cells by targeting the SMAD7 gene
- lnhibition of KU70 and KU80 by CRlSPR interference, not NgAgo interference, increases the ef ficiency of homologous recombination in pig fetal fibroblasts
- Protective roles of trehalose in Pleurotus pulmonarius during heat stress response
- Kiwifruit (Actinidia chinensis) R1R2R3-MYB transcription factor AcMYB3R enhances drought and salinity tolerance in Arabidopsis thaliana