Failure load prediction of adhesive joints under different stressstates over the service temperature range of automobiles
2019-01-17QinGuofengNaJingxinMuWenlongTanWeiLiuHaoleiPuLeixin
Qin Guofeng Na Jingxin Mu Wenlong Tan Wei Liu Haolei Pu Leixin
(State Key Laboratory of Automotive Simulation and Control, Jilin University, Changchun 130021, China)
Abstract:To predict the failure loads of adhesive joints under different stress states over the service temperature range of automobiles, adhesively bonded carbon fiber reinforced plastic(CFRP)/aluminum alloy joints under shear stress state (thick-adherend shear joints, TSJ), normal stress state (butt joints, BJ) and combined shear and normal stress states (scarf joints with scarf angle 45°,SJ45°) were manufactured and tested at -40, -20, 0, 20, 40, 60 and 80 ℃, respectively. The glass transition temperature Tg of the adhesive and CFRP, failure loads and fracture surfaces were used to analyze the failure mechanism of CFRP/aluminum alloy joints at different temperatures. A response surface, describing the variations of quadratic stress criteria with temperature, was established and introduced into the cohesive zone model (CZM) to carry out a simulation analysis. Results show that the failure of CFRP/aluminum alloy joints was determined collectively by the mechanical performances of adhesive and CFRP. Besides, reducing temperature or increasing the proportion of normal stress of adhesive layer was more likely to cause fibre tear or delamination of CFRP, resulting in a more obvious effect of CFRP. The validity of the prediction method was verified by the test of scarf joints with the scarf angle of 30°(SJ30°) and 60°(SJ60°) at -10 and 50 ℃.
Key words:automobiles;adhesive joints; failure loads; temperature; cohesive zone model
One of the major challenges of automotive sector is the need for higher fuel efficiency to reduce energy consumption and environmental pollution. The significant method to achieve fuel economy is using all kinds of new materials to lower the weight of vehicle. However, building a reliable multi-material vehicle is not a trivial task due to the connecting problems between dissimilar materials, especially at the joint parts of composites and metals. Compared with the traditional fasteners (spot welding, bolt and rivet joints), bonded joints are more continuous, distribute loads uniformly, design flexibility, and they also have the advantages of strength-to-weight ratio[1-4].
Automobiles often service in different areas where the temperature changes dramatically. Thus, accurately predicting the failure loads of adhesive joints at different temperatures is of significance for the initial design of adhesive structures applied to cars. The adhesive has different stress and strain behaviors at different temperatures due to its polymeric nature andTgis the key parameter in determining its performance[5]. Generally speaking, the tensile strength of the adhesive decreases with the increase in temperature. Thermal stresses are often generated due to different thermal expansion properties of the adhesive and adherends[5-6]. As for the adhesively bonded metal joints, the adhesive properties and thermal stress are the main reasons that affect the failure loads at different temperatures. However, for the adhesively bonded FRP joints, the property of the matrix in composites also changes with temperature. Besides, various failure modes of FRP, including matrix crack, debonding, and delamination failure, increase the complexity of failure mode of FRP adhesive joints, which is a key factor that influences the failure loads at various test temperatures.
Much research has been conducted to investigate the temperature influence on the failure strength of adhesive joints according to different application fields. For example, Banea et al.[6]studied the failure strengths of single lap joints made from AV118 and Sikaflex-552 adhesive and tested at room temperature, -40 and 80 ℃ for the automotive industry. Zhang et al.[7]investigated the tensile behavior of adhesively-bonded double-lap joints made from glass FRP under the temperatures between -35 and 60 ℃ for civil infrastructure application. da Silva et al.[8]carried out a numerical analysis to study the stress distribution in a mixed adhesive double lap joints over the temperature range from -55 to 200 ℃ for supersonic aircraft. It can be concluded that the performance requirements of adhesive joints depend on their application fields. Several researchers investigated the changes of failure criteria with temperature. Grant et al.[9]found that the failure criterion proposed at room temperature is still valid at high and low temperatures, since the failure envelope can move up and down with the temperature changes. Adams et al.[10]concluded that it is not possible to identify one criterion for all the modes of failure at various temperatures by studying aluminum/CFRP joints. In summary, the failure criteria of adhesive joints at different temperatures are related to the properties of adhesive and adherend. Therefore, it is necessary to study the variation of failure criteria with temperature, which can accurately predict the failure loads of adhesive joints at different temperatures.
Various approaches have been employed to predict the failure of adhesive joints. For example, the continuum mechanics approach assumes that the adhesive is perfectly bonded to the adherents without considering the interface, but it is difficult to predict the failure accurately due to the stress singularity[3,11]. As for the fracture mechanics approach, an energy parameter (toughness) is used as the failure criterion to predict the crack path and calculate the strength, but it relies on the existence of a crack[12]. The CZM was developed in a continuum damage mechanics framework and made use of fracture mechanics concepts to improve its applicability. It has been widely applied to metal, polymers and composites since it can predict the damage initiation and propagation[3,12].
In this work, CFRP and aluminium alloy were selected to manufacture TSJ, SJ45° and BJ, which were subjected to three representative stress states. The adhesive and CFRP were analyzed by differential scanning calorimeter (DSC) to investigateTgand the adhesive joints were tested at -40, -20, 0, 20, 40, 60 and 80 ℃. The failure mechanism was analyzed through the failure surface, failure loads andTg. A surface describing the variations of quadratic stress criterion with temperature from -40 to 80 ℃ was built, and was introduced into the CZM to conduct a simulation analysis. Finally, the prediction method was verified.
1 Experimental Work
1.1 Material
Aluminum alloy rods, CFRP plates and a type of epoxy adhesive are used to manufacture adhesively bonded CFRP/ aluminum alloy joints. The aluminum alloy rods are made of 6005A and the material properties are shown in Tab.1. The CFRP laminates are manufactured by using twill weave prepreg of fiber(HFW200T) and epoxy resin (EM116) with 0.25 mm thickness plies and [0]16lay-up. The respective ply mechanical properties are presented in Tab.2. Adhesive Araldite®2015, provided by Huntsman Advanced Materials, Basel, Switzerland, is selected in the current study. It is a two-component epoxy paste adhesive with excellent performance and has been used by many researchers. The mechanical properties of Araldite®2015 are shown in Tab.3[13].

Tab.2 Mechanical properties of CFRP
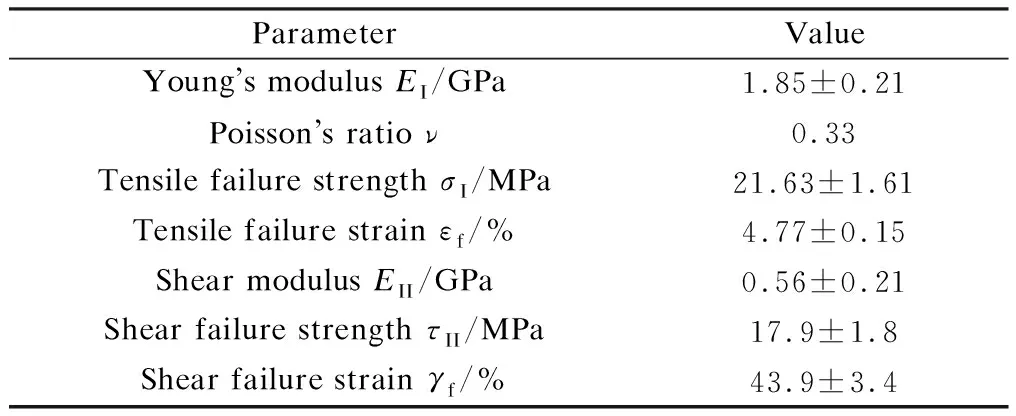
Tab.3 Properties of the adhesive Araldite® 2015
1.2 Specimens manufacture of adhesive joints
TSJ, SJ45°and BJ are selected to investigate the failure loads of adhesive joints under different stress states and build a failure criterion. The TSJ and BJ are assumed to represent the pure shear and pure normal stress, respectively, and the stress is also assumed to be uniform and equal to the average values[14-15]. As shown in Fig.1, the SJ45° is subjected to the combined stress of normalσand shearτ, which are calculated by
σ=Fsinα/S
(1)
τ=Fcosα/S
(2)
whereFis the uniaxial failure load;Sdenotes the bonding area;αis the scarf angle. According to Eqs.(1) and (2), the ratio of normalσand shearτstress components of SJ45° is 1.
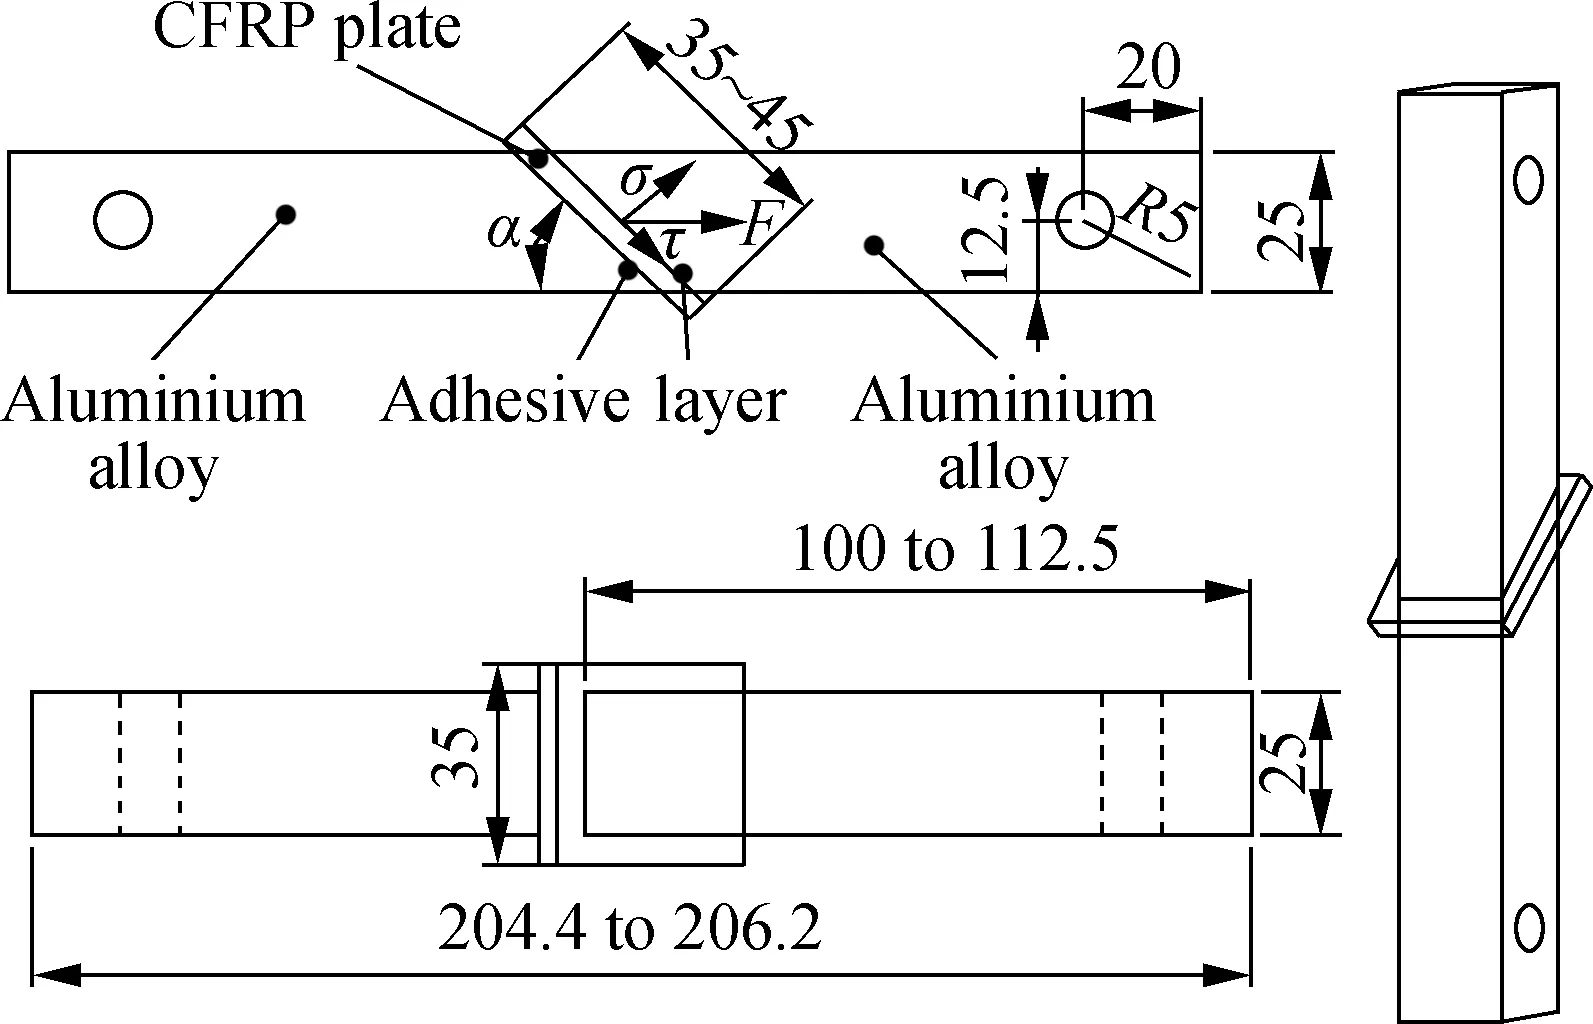
Fig.1 Geometries and dimensions of adhesive joints
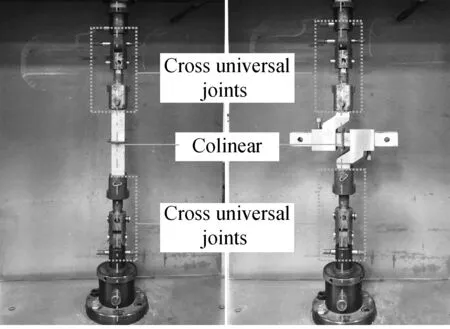
Fig.1 also shows the geometries and dimensions of adhesive joints. Whenαis set to be 90°, it is BJ. The overall dimensions of BJ are 204.4 mm×35 mm×35 mm and the bonding area is 25 mm×25 mm. In general, the bond line thickness in the adhesive joints is set to be about 0.2 mm[13]. The dimensions of CFRP plates is larger than that of the bonding area to avoid fiber tear from the edges and reduce the edge effect. The experimental schematic diagram of BJ under normal stress is shown in Fig.2(a). To improve the utilization of adhesive joints and work fixture and reduce the complexity of the fabrication process of adhesive joints, BJ is also used to test the adhesive joints under shear stress with an auxiliary testing equipment made from steel (see Fig.2(b)). The BJ and the auxiliary testing equipment are fitted together with screws to form an assembly structure, which is called TSJ. To put TSJ in a shear stress state, the adhesive layer of TSJ and axial load are required to be colinear as much as possible. The overall dimension of SJ45° is 206.22 mm×31.82 mm×35 mm and the bondline thickness is 0.2 mm. As the BJ and SJ45° have similar geometries and dimensions, they can use the same bonding fixture made from aluminium alloy, which is shown in Fig.3. The manufacturing process of the adhesive joints is as follows: First, the substrate surface of aluminum alloy joints are polished with 80# sandpaper, and the aluminum alloy joints and CFRP plate are cleaned with acetone. Then, adhesive Araldite®2015 is applied to the substrate surface, and the specimens are bonded by the bonding fixtures.After that, almost all the spew fillet of adhesive is cleared. Finally, the adhesive joints are disassembled from the bonding fixture after 24 h and cured at 80 ℃ for 2 h in an environmental chamber. The environmental chamber (provided by Ke Xin Co., Changchun, China) can raise the temperature by resistance heating, and decrease the temperature by spraying liquid nitrogen.
(a) (b)
1.3 Experimental tests
1.3.1 Differential scanning calorimetry (DSC) analysis
Thermal properties of adhesive Araldite®2015 and CFRP are measured using a differential scanning calorimetry machine. The DSC measurements are performed with standard aluminum pans and lids under a nitrogen atmosphere from -80 ℃ up to 200 ℃ with a 5 ℃/min heating/cooling rate. In this case, the sample’s weights are approximately (20 ± 0.2) mg. The first heating run is carried out to remove the thermal history of the samples.Tgis obtained from the second heating run.
1.3.2 Tensile tests of adhesive joints
The TSJ, BJ and SJ45° are tested at -40, -20, 0, 20, 40, 60 and 80 ℃, using an electronic universal testing machine (WDW series, Ke Xin Co., Changchun, China) at a constant speed of 2 mm/min. The required temperature is provided by the environmental chamber. To ensure that the inner temperature of specimens reached the required test temperature, the specimens needed to be placed in the environmental chamber for at least 2 h at testing temperature before the tensile tests. To eliminate the non-axial forces, both ends of the specimens are connected to the testing machine through the cross universal joints, shown in Fig.2. Each test is repeated at least four times and the failure loads are averaged.
2 Experimental Results and Discussion
2.1 DSC results
The DSC thermograms of adhesive Araldite®2015 and CFRP are given in Fig.4. DSC curves exhibit an endothermic heat flow nearTg[16]. To determineTg, straight lines are extended along the left-hand and right-hand branches of the heat flow curve.Tgis obtained from the intersection point of the bisecting line of the angle with the measured curve[17]. It can be seen that the glass transition process of adhesive Araldite®2015 starts from about 45.7 ℃ to about 85.9 ℃, andTgis about 65.8 ℃. Compared with the adhesive Araldite®2015, CFRP has a much higherTgat about 142.5 ℃, which suggests that the mechanical properties of adhesive Araldite®2015 are more sensitive to the temperature changing from -40 to 80 ℃ than that of CFRP.
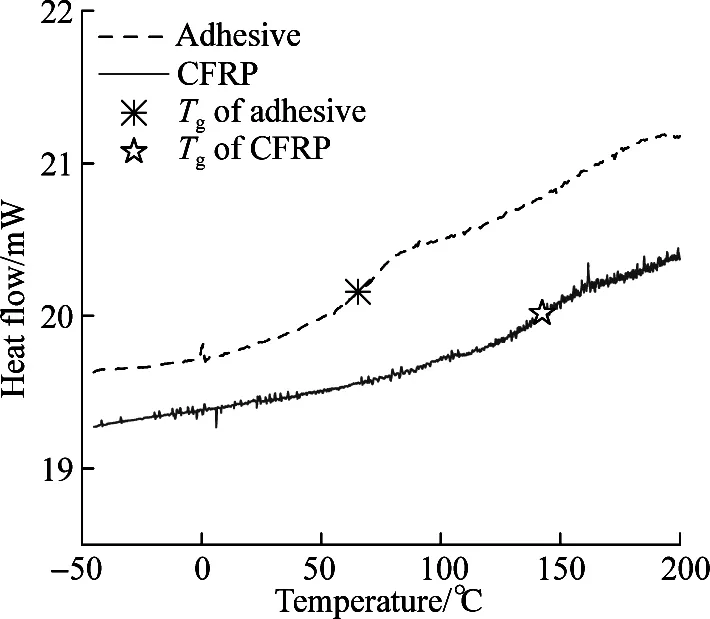
Fig.4 DSC thermograms of adhesive Araldite® 2015 and CFRP
2.2 Failure loads of adhesive joints
The peak load from the load-displacement curve is defined as the failure load and the failure loads of TSJ, SJ45° and BJ at -40, -20, 0, 20, 40, 60 and 80 ℃ are shown in Fig.5. It is easy to see that the failure loads of all the adhesive joints decrease with the increase in temperature, but the variation of failure loads with temperature is nonlinear. For example, compared with the failure loads of TSJ at 20 ℃, the failure loads at 0 and -20 ℃ increase by 13.1% and 17.3%, respectively. When the test temperature falls to -40 ℃, it increases by about 26.5%. In addition, the effect of low temperatures on the failure loads depends on the types of adhesive joints. Compared with the failure loads of SJ45° and BJ at 20 ℃, they only improve by 8.0% and 5.7% at -40 ℃, respectively, which are much less than those of TSJ. As the proportion of normal stress in the adhesive layer of TSJ, SJ45° and BJ are 0, 0.5 and 1, it is found that the growth of failure loads at low temperature decreases with the increase in the proportion of normal stress.
When the temperature exceeds 20 ℃, the descending rate of failure loads of three types of adhesive joints is nearly the same. At 40 ℃, the failure loads fall by about 10% compared with that at 20 ℃. There is a rapid decline of failure loads by around 25% and 65% at 60 and 80 ℃, respectively. It is obvious that the descending rate of failure loads increases rapidly with the elevated temperature. The failure loads at 40 ℃ decline the least, which is due to the fact that the glass transition process of adhesive started at about 45.7 ℃. However, when the test temperature goes up to 60 ℃, the glass transition of adhesive is nearly half completed; thus the decrease of failure loads is much higher than that at 40 ℃. The adhesive has almost translated from the glassy state to the rubbery state at 80 ℃, resulting in the lowest failure loads.
In summary,at low temperature, the improvement of failure loads declines with the increase in the proportion of normal stress, while at high temperature, the descending rate of failure loads of all types of adhesive joints is nearly the same. Besides, the high temperature has much
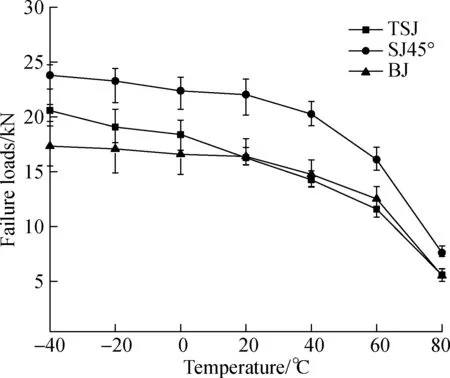
Fig.5 Failure loads of adhesive joints at different temperatures
more obvious effect on the failure loads than low temperature.
2.3 Failure models of adhesive joints
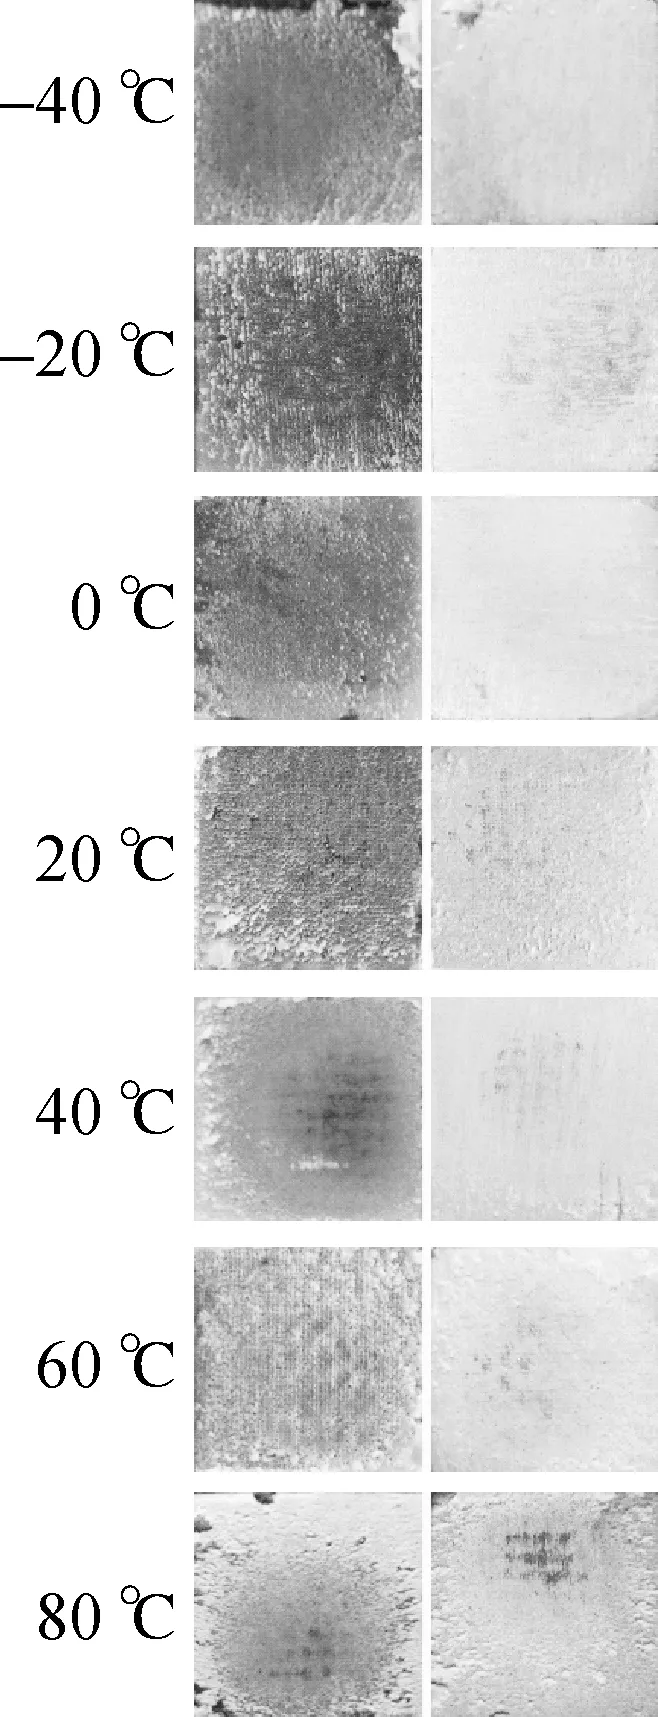
The representative fracture surfaces of TSJ, SJ45° and BJ tested at -40, -20, 0, 20, 40, 60 and 80 ℃ are shown in Fig.6. For TSJ, all the fracture surfaces are cohesive failure, which indicates that the failure loads of TSJ at different testing temperatures are mainly determined by the performance of adhesive.


(a) (b) (c)
Fig.6Representative fracture surfaces at seven testing temperatures.
(a) TSJ; (b) SJ45; (c) BJ
For SJ45° tested at 20 ℃, the failure mode is the mixed failure of fiber tear and cohesive. As SJ45° is in a combined stress state of normal and shear, it is concluded that the fiber tear is caused by the normal stress of the adhesive layer. When the temperature is reduced to 0 ℃, the area of fiber tear increases a little, but it reaches 80% of the fracture surface at -20 ℃. The failure mode is CFRP delamination at -40 ℃. The mechanical properties of adhesive and CFRP improve with the decrease in temperature, but the growth rate of adhesive is higher than CFRP since adhesive has a lowerTg. Therefore, the proportion of fiber tear increases with the decrease in temperature. However, only around 20% of the fracture surface is fiber tear when the temperature rises to 40 ℃, and higher testing temperatures cause no fiber tear. This is due to the fact that the mechanical properties of adhesive drop much more sharply than CFRP when the testing temperature approaches and exceedsTgof adhesive, leading to the cohesive failure at 60 and 80 ℃.
The failure modes of BJ have the similar failure mechanism to SJ45°, but the proportion of fiber tear from -20 to -40 ℃ is larger than that of SJ45°, since the BJ has a higher proportion of normal stress than SJ45°. It has to be pointed out that the CFRP delamination of BJ at -20 and -40 ℃ indicates that the failure loads of BJ at -20 and -40 ℃ are the interlaminar tensile strength of CFRP in essence. In other words, the load capacity of BJ at -20 and -40 ℃ is determined by the interlaminar tensile strength of CFRP. AsTgof CFRP is much higher than the testing temperatures, the interlaminar tensile strength only improves a little when temperature is lowered. Therefore, the failure loads of BJ at low temperature have the lowest improvement.
It is concluded that the failure modes of adhesive are determined collectively by adhesive and CFRP. Generally speaking, fiber tear or CFRP delamination is more likely to appear when lowering temperatures or increasing the proportion of the normal stress of the adhesive layer, resulting in the effect of CFRP on the failure of adhesive joints becoming more obvious.
3 Simulation Analysis
3.1 Modelling conditions
The simulation analysis is carried out in the FEM software ABAQUS®with CZM module to predict the failure loads of TSJ, SJ45°and BJ over the service temperature of automobiles. The geometrical nonlinear effects are taken into consideration and the increments need to be small enough to accurately obtain the peak loads. The three-dimensional FEM model of adhesive joints are established and Fig.7 shows the representative meshes of SJ45°. To simplify the simulation model, only one layer of adhesive is constructed on one side of the CFRP, while the other side of CFRP is connected directly to the aluminum alloy by shared mesh nodes. This is due to the same stress states of the two layers of adhesive. Mesh seeds are distributed manually, and then meshes are generated. Besides, meshes are refined to about 0.2 mm near the adhesive layer. In the numerical model, CFRP and aluminium alloy are modelled with a continuum shell element (SC8R) and 3D stress element (C3D8R), respectively. The adhesive layer is modelled by the cohesive element (COH3D8) with the thickness of 0.2 mm[18]. The joints are fully restrained at one of the edges to simulate real clamping conditions in the machine grips, and the other edge is subjected to a tensile displacement concurrently with transverse restraining shown in Fig.7. To reduce the number of elements and improve the computational efficiency, only half of the model is built and symmetric restraint is built in the symmetrical plane.
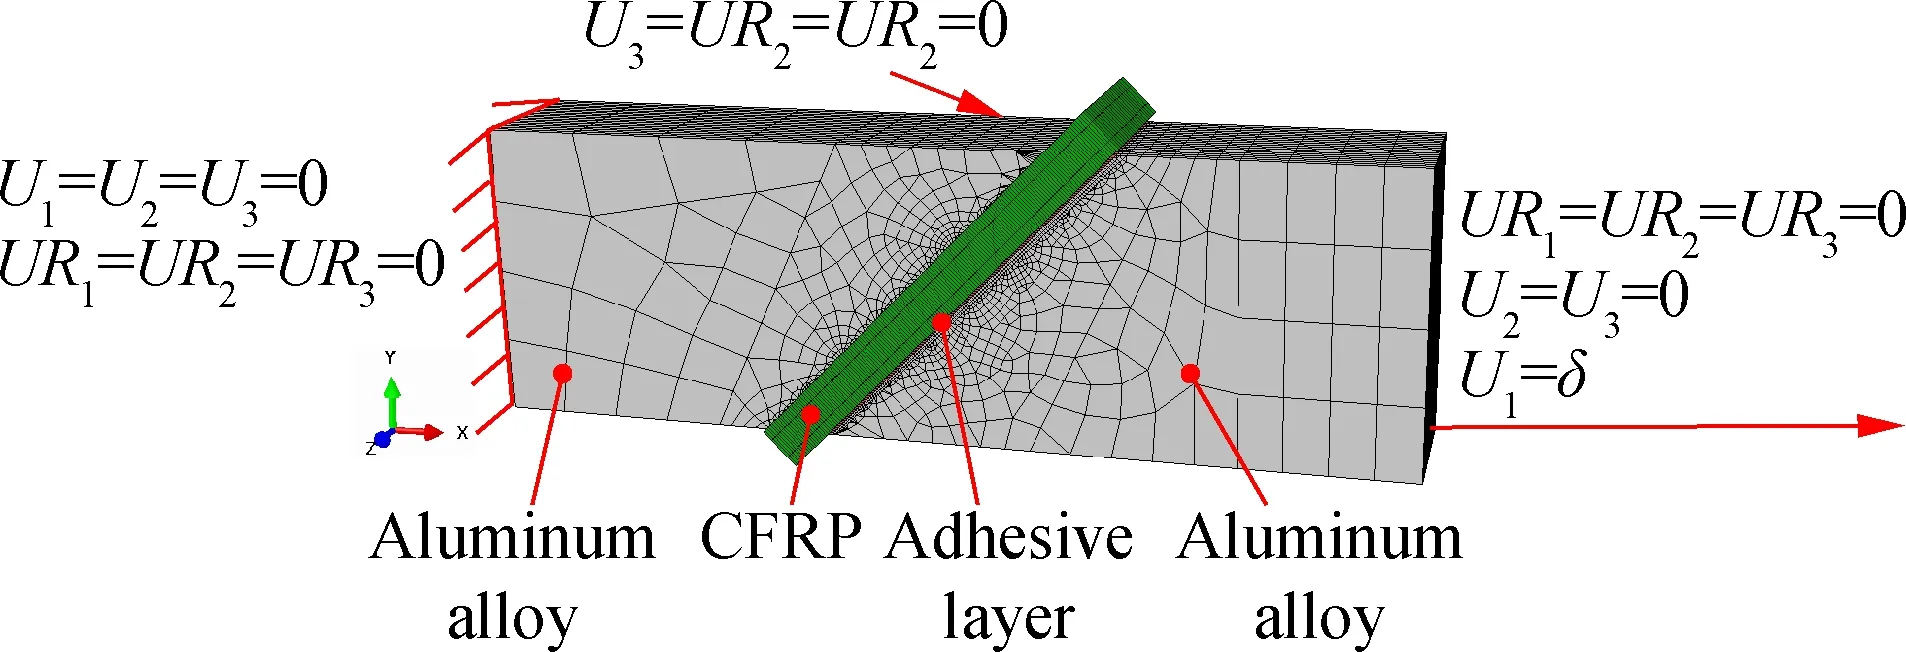
Fig.7 Representative numerical model of SJ45°
3.2 Cohesive zone modelling
3.2.1 The triangular traction-separation law
The triangular traction-separation law is selected in this simulation analysis according to the mechanical properties of adhesive Araldite®2015[13]. The constitutive response of the triangular traction-separation law under mixed mode loading is shown in Fig.8.Tris the traction, andδⅠandδⅡare the corresponding opening displacements of pure modes Ⅰ and Ⅱ, respectively, caused by the traction. The subscripts Ⅰ and Ⅱ represent the normal and shear components, respectively. The representative mixed mode is between the two pure modes. In this paper, the mixed mode is taken as an example to explain the triangular traction-separation law and its constitutive response, which is given as[18]
(3)


Fig.8 Constitutive response of the triangular traction-separation law under mixed mode loading
3.2.2 Damage initiation and evolution
Campilho et al.[13,19]found that the criterion of damage initiation plays an important role in predicting the failure loads of adhesive joints. Thus, the criterion of damage initiation is established based on the experimental tests in this study. The quadratic stress criterion is typically chosen to determine the damage initiation stress of adhesive joints for cohesive elements under the mixed mode loading as follows[14,20]:
(4)
whereσIandτIIrepresent the pure modes Ⅰ and Ⅱ tractions at the time of loading;σIcandτIIcare the failure strengths of mode Ⅰ and mode Ⅱ, respectively. Although the quadratic stress criterion can be theoretically built based on TSJ and BJ, SJ45° is also added to establish the quadratic stress criterion, aiming at improving its accuracy.
The failure strength of mode Ⅰ and mode Ⅱ are calculated via Eqs.(1) and (2). An envelope of quadratic stress criterion is established by fitting the normal stress and shear stress of adhesive joints under different stress states. The quadratic stress criteria of CFRP/ aluminum alloy joints at seven temperatures is shown in Fig.9.

Fig.9 Quadratic stress criteria at seven temperatures
To establish the failure criterion at any temperature between -40 and 80 ℃ for automotive applications, a response surface describing the variations of quadratic stress criteria with temperature is built based on the quadratic stress criteria at seven temperatures. By the Matlab software, the equation of the response surface is obtained as
(5)
whereTrepresents the test temperature ranging from -40 to 80 ℃, and when given aT, the quadratic stress criteria can be calculated by Eq.(5). The corresponding response surface contour is shown in Fig.10. It is observed that the envelope curve of quadratic stress criteria narrows with the increase in temperature.
When the cohesive element satisfies the quadratic stress criterion, the material stiffness softens and the complete separation is evaluated by a linear power law criterion considering the energy release rates (GI,GII) and the fracture toughness (GIc,GIIc), given as[13]
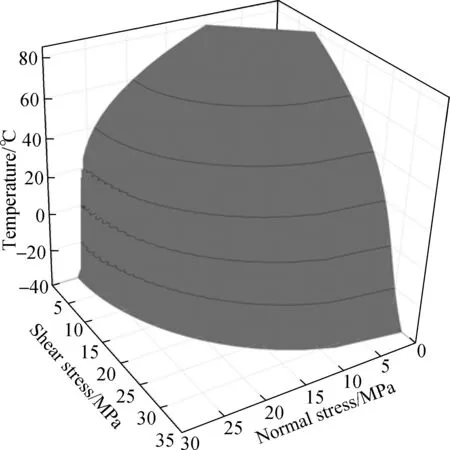
Fig.10 The response surface contour of quadratic stress criteria ranging from -40 to 80 ℃
(6)
3.2.3 Parameters of CZM model
To conduct the simulation analysis,simulation parameters are required to be introduced into the mode. The material properties of aluminium alloy and CFRP are depicted in Tab.1 and Tab.2, respectively. The parameters of a mixed-mode traction-separation response of cohesive element include the initial stiffness (EI,EII), failure strength (σIc,τIIc), and the fracture energies (GIc,GIIc).Tab.4 shows the material properties introduced into simulation analysis for the adhesive layers at 20 ℃. The values of failure strength (σIc,τIIc) for adhesive are obtained from the response surface shown in Eq.(5), and the values of initial stiffness and fracture toughness are found in Ref.[13].
To predict the failure loads of adhesive joints at the temperature ranging from -40 to 80 ℃, temperature influence factor (Tem)Iand (Tem)IIof modes Ⅰ and Ⅱ are defined as
(7)
The values of Young’s modulus, shear modulus and fracture toughness (modes Ⅰ and Ⅱ) at any temperature are calculated by
(8)
where (Ei)Tand (Gic)Trepresents the initial stiffness and
Tab.4Properties of the adhesive Araldite1®2015 for CZM at 20 ℃

ParamterValueYoungs modulus EI/GPa1.85Shear modulus EII/GPa0.56Mode Ⅰ failure strength σIc/MPa25.32Mode Ⅱ failure strength τIIc /MPa25.90Mode Ⅰ fracture toughness GIc/(N·mm-1)0.43Mode Ⅱ fracture toughness GIIc/(N·mm-1)4.70
fracture energies of modes Ⅰ and Ⅱ at temperatureT. It is assumed that the values of initial stiffness and fracture toughness (modes Ⅰ and Ⅱ) changes equally with temperature influence factor (Tem)Iand (Tem)IIof modes Ⅰ and Ⅱ, respectively.
3.3 Stress analysis
To analyze the stress distributions of adhesive joints under different stress states, the plots of normalσand shearτstresses are extracted on the central line of the adhesive layer before the initial damage, as shown in Figs.11(a) to (c). The normalσand shearτof TSJ and SJ45° are normalized by the average value of absolute shear stressτavgalong the line that extract stress distribution. While the normalσand shearτof BJ are normalized by the average value of absolute normal stressσavg. From Figs.11(a) to (c), it is easy to see that the normal and shear stresses distribute uniformly except the ends of the adhesive layer due to the stress singularities caused by the dramatic geometrical change at the boundary region. For TSJ, the normalized shear stress distributed around 1 and the normalized normal stress was almost 0 except for the stress concentrations, shown in Fig.11(a), indicating that the main stresses of TSJ is shear stress. The normalized normal and shear stress of BJ are 1 and 0, respectively, as shown in Fig.11(c), illustrating that the shear stress is too small when compared to the normal stress. From Fig.11(b), the ratio of normalized normal and shear stress of SJ45° is approximately 1. The stress analysis of normal and shear stress of TSJ, SJ45° and BJ proves that the assumptions of stress of the adhesive layer in Section 1.2 are reasonable.
3.4 Simulation results
The relative errors of failure loads of TSJ, SJ45° and BJ between experimental tests and simulation analysis at seven testing temperatures are calculated to evaluate the prediction precision, shown in Fig.12. As can be seen, the relative errors decrease with the increase in temperature, which is due to the high accuracy of quadratic stress criteria at high temperatures. Compared with TSJ and SJ45°, the relative error of BJ is the highest, as a result of larger area of fiber tear or CFRP delamination caused by normal stress. The maximum relative error between experimental tests and simulation analysis is 9.53% and the average relative error is 4.21%, illustrating that the
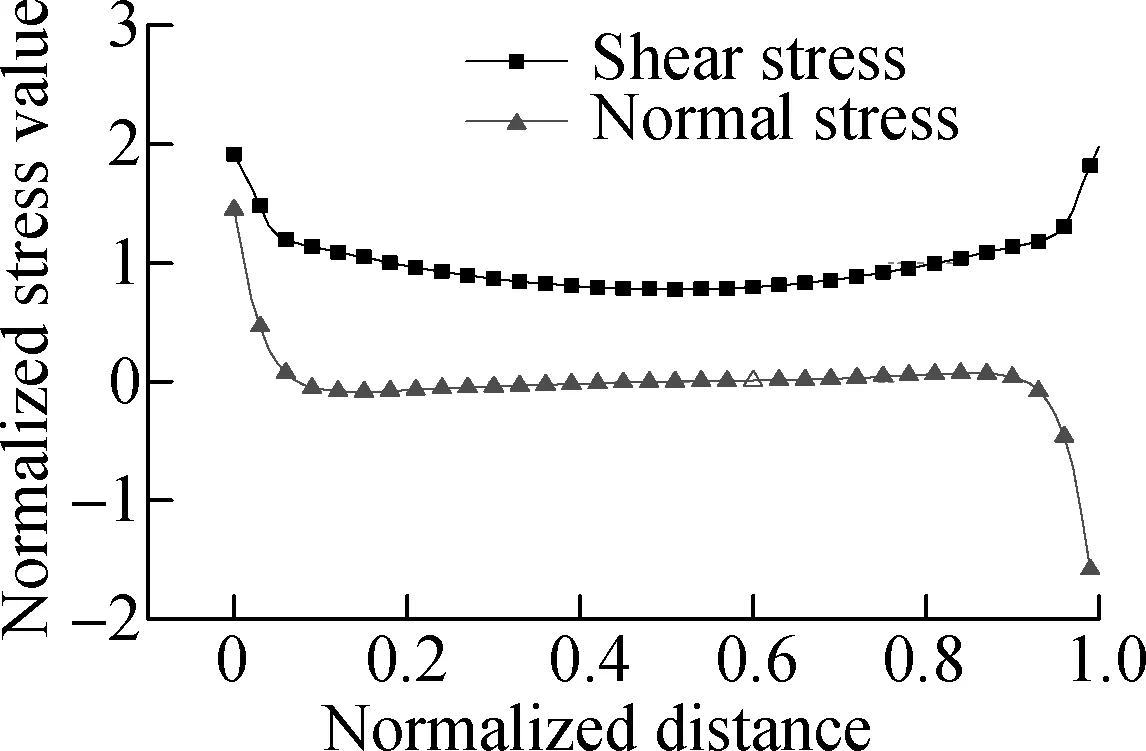
(a)

(b)
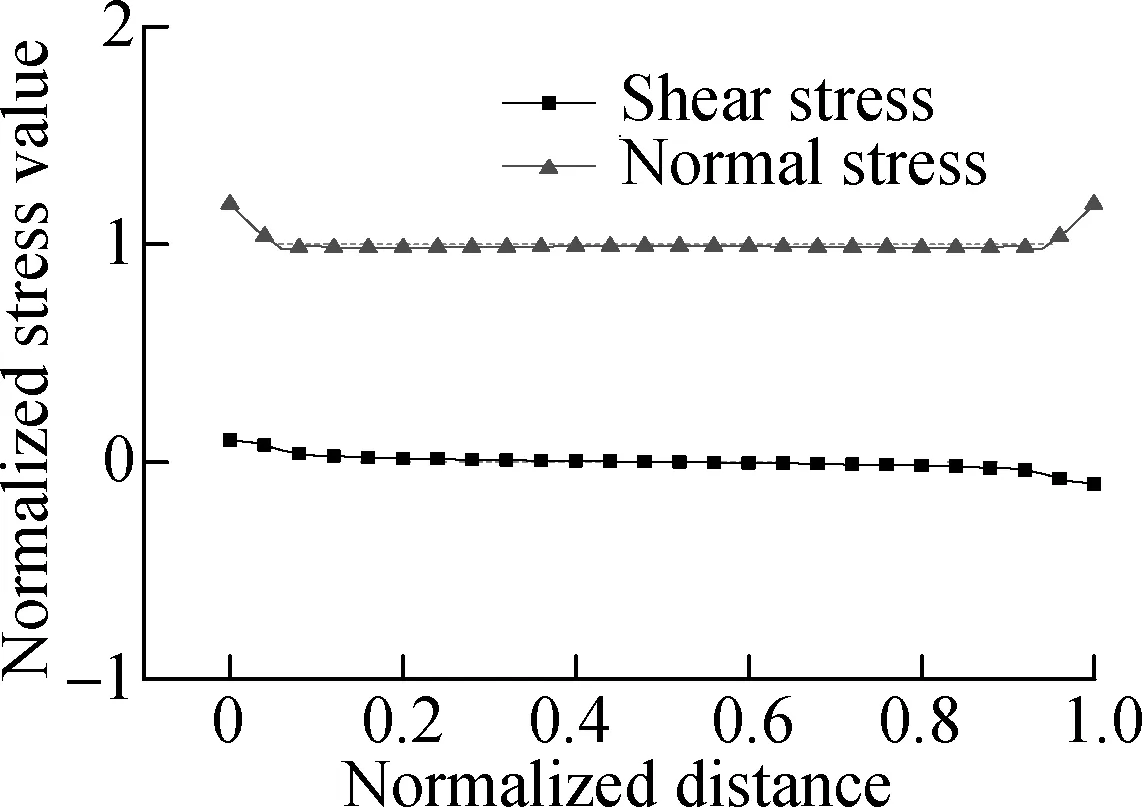
(c)
Fig.11Normalized normalσand shearτstress distributions.
(a) TSJ; (b) SJ45°; (c) BJ

Fig.12 Relative error of failure loads between experimental tests and simulation analysis
assumption in Eq.(8) is reasonable. It also proves that the response surface of the quadratic stress criteria is appropriate for the failure prediction of adhesive joints over the service temperature of automobiles.
4 Verification
To verify the prediction method of the failure loads proposed in this paper, SJ30°and SJ60°were manufactured and tested at -10 and 50 ℃. From Fig.13, it can be seen that the area of fiber tear of SJ30° and SJ60° at -10 ℃ is about 70% and 100% fracture surface, respectively. When the temperature is 50 ℃, the failure modes of SJ30° and SJ60° show cohesive failure. A simulation analysis is also conducted to obtain the failure loads of SJ30° and SJ60° at -10 and 50 ℃. Quadratic stress criteria are built via Eq.(5) and other CZM parameters are calculated by Eqs.(7) and (8). The failure loads of SJ30° and SJ60° from experimental tests and simulation analysis are shown in Fig.14. The relative errors of the failure loads between experimental tests and simulation analysis range from 3.56% to 5.83%, illustrating the feasibility and accuracy of the prediction method.
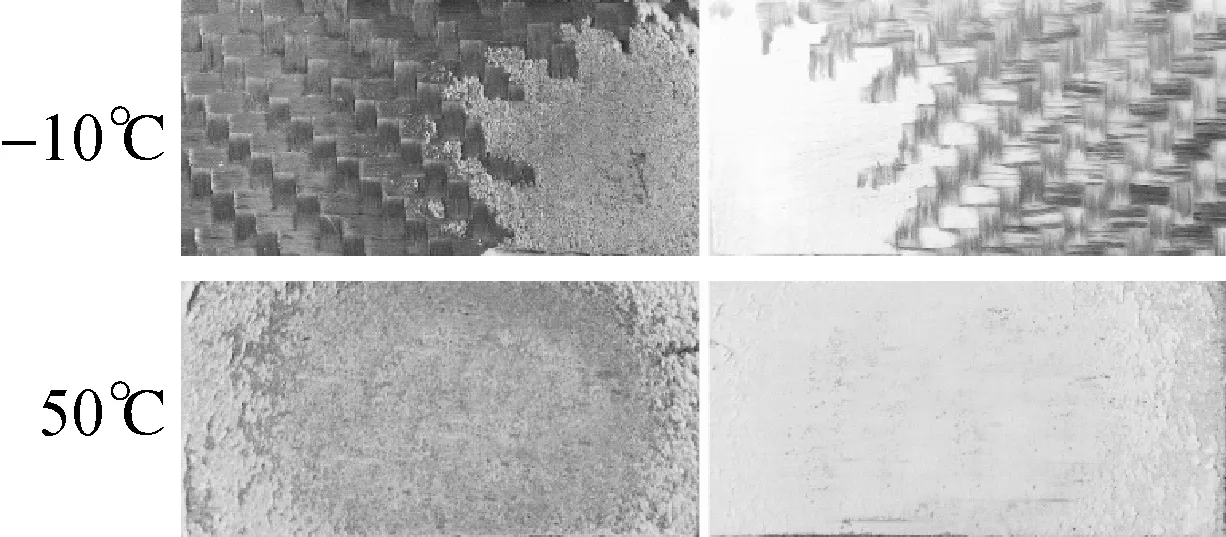
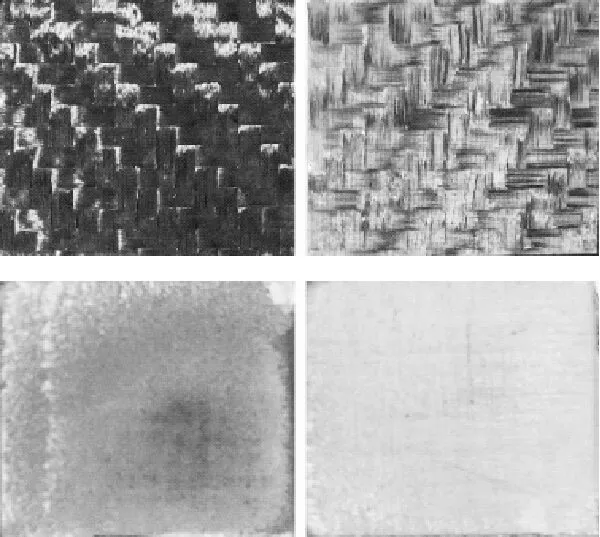
(a) (b)
Fig.13Representative fracture surfaces at -10 and 50 ℃.
(a) SJ30°; (b) SJ60°
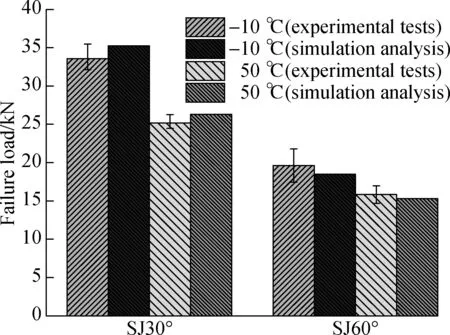
Fig.14 Failure load of SJ30° and SJ60° from experimental tests and simulation analysis
5 Conclusions
1) TheTgof adhesive Araldite®2015 and CFRP is 65.8 and 142.5 ℃, respectively, indicating that the mechanical performance of adhesive is more sensitive to the service temperature of automobiles.
2) The failure loads and failure modes of adhesively bonded CFRP/aluminium alloy joints are determined collectively by the mechanical performance of adhesive and CFRP. When lowering temperatures or increasing the proportion of normal stress of the adhesive layer, fiber tear or CFRP delamination is more likely to appear, resulting in a more obvious effect of CFRP.
3) The stress analysis finds that the main stress of TSJ and BJ are shear and normal, respectively, and the shear and normal stress of SJ45° are nearly equal.
4) The average relative error of failure load from the simulation analysis is 4.21%, with the maximum relative error of 9.53%, which illustrates that the response surface of quadratic stress criteria and the calculation method of CZM parameters are reasonable.
杂志排行
Journal of Southeast University(English Edition)的其它文章
- Effect of fiber type on the bending and uniaxial tensile properties of high-strength high-ductility cementitious composites
- A game-theory approach against Byzantine attack in cooperative spectrum sensing
- Dependent task assignment algorithm based on particle swarm optimization and simulated annealing in ad-hoc mobile cloud
- A cooperative spectrum sensing results transmission scheme with LT code based on energy efficiency priority
- An indoor positioning system for mobile target tracking based on VLC and IMU fusion
- Investigation of radiation influences on electrical parameters of 4H-SiC VDMOS
