A Facile Surface Passivation of Hematite Photoanodes with Molybdate Overlayers for Efficient PEC Water Oxidation
2019-01-10QiZhngQunpingWuYueZhngJitongYnSongXueHongynWng
Qi Zhng,Qun-ping Wu,Yue Zhng,Ji-tong Yn,Song Xue,Hong-yn Wng*
a.Tianjin Key Laboratory of the Design and Intelligent Control of the Advanced Mechanical System,School of Mechanical Engineering,Tianjin University of Technology,Tianjin 300384,China
b.Tianjin Key Laboratory of Organic Solar Cells and Photochemical Conversion,School of Chemistry&Chemical Engineering,Tianjin University of Technology,Tianjin 300384,China
α-Fe2O3thin films have been synthesized and used as photoanodes for photo-electrochemical(PEC)water oxidation.Molybdate was introduced to mediate hematite thin films via two synthesis routes(namely in situ mediation and ex situ modification).Through the in situ mediation process,the morphology and film thickness could be changed significantly due to the addition of MoO4 2−,while for the ex situ modification,the PEC performance of the hematite has been greatly improved without changing the nanorod morphology.Various characterizations such as UV-Vis absorption,transmission electronic microscopy,scanning electronic microscopy,Mott-Schottky,electrochemical impedance spectroscopy were conducted and the PEC performances were investigated.
Key words:Hematite film,Molybdate,Passivation,Water splitting,Photocurrent
I.INTRODUCTION
Photo-electrochemical(PEC)water splitting is generally believed to be one of the most promising and green approaches to solve the energy crisis issues[1−4].Hematite(α-Fe2O3)has been extensively studied as a promising photoanonde materials for water splitting due to its low toxicity,ample abundance,broad visible light adsorption,appropriate band edge position,and high chemical stability[5,6].Theoretically,the solarto-hydrogen efficiency(STH)of α-Fe2O3is estimated to be 16.8%under AM 1.5G irradiation[7].However,it is difficult to achieve this value due to several intrinsic deficiencies of α-Fe2O3[5,6].For instance,the photocurrent onset potential(Vonset)may shift positively by about 0.5 V due to the sluggish water oxidation kinetics[8].Moreover,poor electrical conductivity and short carrier diflusion length(2−4 nm)lead to a short electron-hole pair lifetime and high recombination rate[9−11].In this regard,nano engineering is a useful strategy to overcome these issues by shortening the hole diflusion path[12].Nanostructured hematite thin films,such as nanowires,nanotubes,nanorods,nanocubes and mesoporous structure,have been developed to shorten the charge-transport pathway and increase the accessible surface.Numerous techniques including plasma enhanced-chemical vapor deposition(PE-CVD)[13,14],atomic layer deposition(ALD)[15,16],hydrothermal synthesis[17−21],spray pyrolysis[22,23],and atmospheric-pressure chemical vapor deposition(APCVD)[24,25],have been adopted for fabricating nanostructured hematite thin films to shorten the pathway that the photoexcited carriers have to travel.
In addition,elemental doping is another eflective strategy to improve the performance of hematite photoanodes.Some metal ions,such as Ti[8,26],Sn[27,28],Pt[29],Zr[30],Si[27],Cr[31],Zn[32],and Mn[33]have been doped into hematite to increase the electric conductivity and facilitate charge transfer in the bulk.For instance,indium and tin elements were codoped into α-Fe2O3by temperature-driven ionic diflusion from the ultrathin ITO layer which was sputtered on the FTO substrate.It was found that a 32 nm thick ITO underlayer exhibited 3-fold photocurrent enhancement over pristine hematite at 1.23 V vs.RHE[34].
Other successful approaches to improve hematite properties involve developing heterocomposite electrode,which may cause various eflects(catalytic,plasmonic,passivation).For instance,some high-efficiency co-catalysts like cobalt-phosphate(Co-Pi)[35,36]or iridium oxide(IrO2)[37]could facilitate the complex four-electron transfer process and speed up the reaction kinetics. Pt-functionalized Fe2O3photoanodes were prepared by plasma-enhanced chemical vapor deposition(PECVD)followed by sputtering of platinum and annealing in air.It was found that the PEC performances of the hematite photoanodes were eflectively enhanced due to the improved nano-organization of he-matite and the redox eflect of platinum[38].In addition,an overlayer of TiO2through ALD technique gave an ten-fold photoactivity enhancement with respect to bare Fe2O3[39,40].The significant improvement in the PEC performance was mainly attributed to the benefi cial role of Fe2O3-TiO2heterojunctions,which led to increased charge separation and less recombination rate.
Besides,some undesirable surface states,mainly Fe3+/Fe2+redox couples and dangling bonds[41,42],exist on the surface of α-Fe2O3crystallites[43−45],which will act as recombination centers,trapping holes or electrons.Several types of passivation layers,including Ga2O3[46],Al2O3[47],SiOx[48]ultrathin layers,have been applied on the surface of Fe2O3to enhance PEC performance by reducing the charges trapped in the interface between hematite and electrolyte.
Based on the above observations,it can be inferred that the interface between the hematite and electrolyte is of great importance.There are a few studies focusing on the molybdenum eflect on the morphology,structure and PEC properties of hematite thin films.In an earlier study[31],Mo doped hematite was prepared by soaking FeOOH nanorods into varied dopant precursor solutions,followed by 800◦C annealing treatment.Mo was found to have a negative eflect on the PEC performance of hematite.The Mo modified hematite photoanode exhibited low photocurrent density,which was attributed to the lower bulk charge transport resistance and higher charge resistance in the interface between the hematite and electrolyte.Herein,we report a comparison study of Mo modified hematite thinfilms via two synthesis routes(namely in situ and ex situ process)to investigate the influences on the activity of PEC water oxidation in detail.To our best knowledge,sodium molybdate was used as the mediating agent for the first time.
II.EXPERIMENTS
A.Materials preparation
FeCl3·6H2O(Sigma-Aldrich,99%),NaNO3,and Na2MoO4were used without further purification.A piece of FTO(F:SnO2,14 Ω/sq)was cleaned by sonication in acetone and ethanol for 30 min,respectively.
1.Synthesis of bare hematite films
Pristine α-Fe2O3films on conductive glass(FTO)substrate were fabricated based on a facile hydrothermal method.Typically,a clean FTO glass was placed into a 10-mL beaker,which contained 4 mL of solution of 0.0972 g FeCl3·6H2O(0.09 mol/L)and 0.034 g NaNO3(0.1 mol/L)at pH=1,adjusted by HCl.Next,the above beaker was carefully placed into the 100-mL Teflon-lined autoclave and kept in an oven at 95◦C for 4 h.After cooling to room temperature,a homogeneous yellowish FeOOH layer was formed on the FTO.The resultant samples were washed with distilled water for several times and blow-dried with nitrogen.Then,the FeOOH films were heated up from room temperature to 550◦C with a ramp rate of 5◦C/min and held for 2 h then annealed at 750◦C for 15 min in air.After cooling to room temperature naturally,a uniform bare hematite film in bright orange color was obtained.
2.Synthesis of in situ molybdate mediated hematite films
The in situ sodium molybdate mediated hematitefilms were synthesized through the same method.All the steps were identical with those of bare hematite,except the precursor solution(FeCl3).To prepare the molybdate mediated hematite films,a certain amount of NaMoO4was added to the FeCl3solutions to give different concentrations of NaMoO4mixed solutions:0.3,0.45,1.5,and 3 mmol/L.The above Mo in situ mediated samples were further characterized by SEM-EDXS to measure Mo/Fe ratios,and were named according to the actual Mo/Fe ratios.For instance,sample Fe2O3/in situ Mo 0.01 stands for the atomic ratio of Mo/Fe=0.01.
3.Preparation of ex situ molybdate modified hematite films
To prepare the ex situ molybdate modified hematitefilms,a series of bare hematite films were preparedfirst for further modification. Those as-synthesized bare hematite films were immersed into solutions of 0.3 mmol/L Na2MoO4,1.2 mmol/L Na2MoO4,6 mmol/L Na2MoO4,30 mmol/L Na2MoO4solutions for 15 min,respectively,then washed with distilled water and dried in air at 300◦C for 2 h. The assynthesized samples were referred to as Fe2O3/ex situ Mo 0.3,Fe2O3/ex situ Mo 1.2,Fe2O3/ex situ Mo 6,Fe2O3/ex situ Mo 30 respectively.To observe the influence of annealing temperature,diflerent annealing temperatures were attempted including 25,100,200,300,400,750◦C.
B.Materials characterization
X-ray powder diflractometer(Rigaku D/MAX-2500)using Cu Kα radiation(λ=0.15418 nm)was used to characterize the crystal structure.Scanning electron microscope(SEM,JEOL/JSM7500)was employed to characterize the surface morphology of the samples and SEM-EDXS were used to measure the atomic concentration of diflerent elements.The high resolution transmission electron microscope(TEM,JOEL/2100F)was used to examine the microstructure of the samples bare Fe2O3and Fe2O3/ex situ Mo 0.3.X-ray photoelectron spectroscopy(XPS)was carried out on an ESCALAB-250XI spectrometer(Thermo Fisher Scientif,USA)with monochromated Al Kα(150 W)as the X-ray source for excitation.The binding energies obtained from the XPS analysis were corrected by referencing C 1s to 284.6 eV.The UV-Vis absorption spectra were collected in transmission mode at normal incidence by a UV-visible spectrophotometer(Shimadzu,UV-2600),with bare FTO as a reference.The photocurrent generated in hematite film is estimated using the following equation:
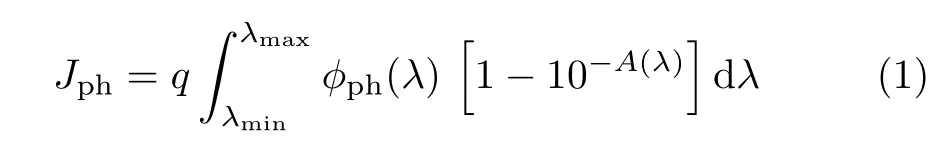
where ϕphis the characteristic solar radiation spectrum,A is absorbance,λ is wavelength,and q is the elementary charge.
C.Photoelectrochemical measurements
The photoelectrochemical experiments were conducted using a Zennium electrochemical workstation(ZAHNER,Germany)in a three-electrode system with the as-prepared sample as the working electrode,Ag/AgCl electrode as the reference electrode and coiled platinum wire(1 cm2in area)as the counter electrode in a 1.0 mol/L NaOH solution.A 300-W xenon lamp solar simulator was used as the light source.The light power density at test point was adjusted to be 100 mW/cm2with a power meter.The electrochemical impedance spectroscopy(EIS)was carried out in the dark with a 0.05 V bias against a reference electrode of Ag/AgCl in an aqueous solution containing 0.5 mol/L KCl,0.01 mol/L K3[Fe(CN)6],and 0.01 mol/L K4[Fe(CN)6]using the same three-electrode system.Mott-Schottky(M-S)measurements were performed with a potential frequency of 1 kHz under dark condition.According to the Nernst equation VRHE=VAg/AgCl+0.1976 V+pH(0.059 V),all potentials were converted to the reversible hydrogen electrode(RHE)scale.
III.RESULTS AND DISCUSSION
A.Na2MoO4 in situ mediated hematite photoanodes
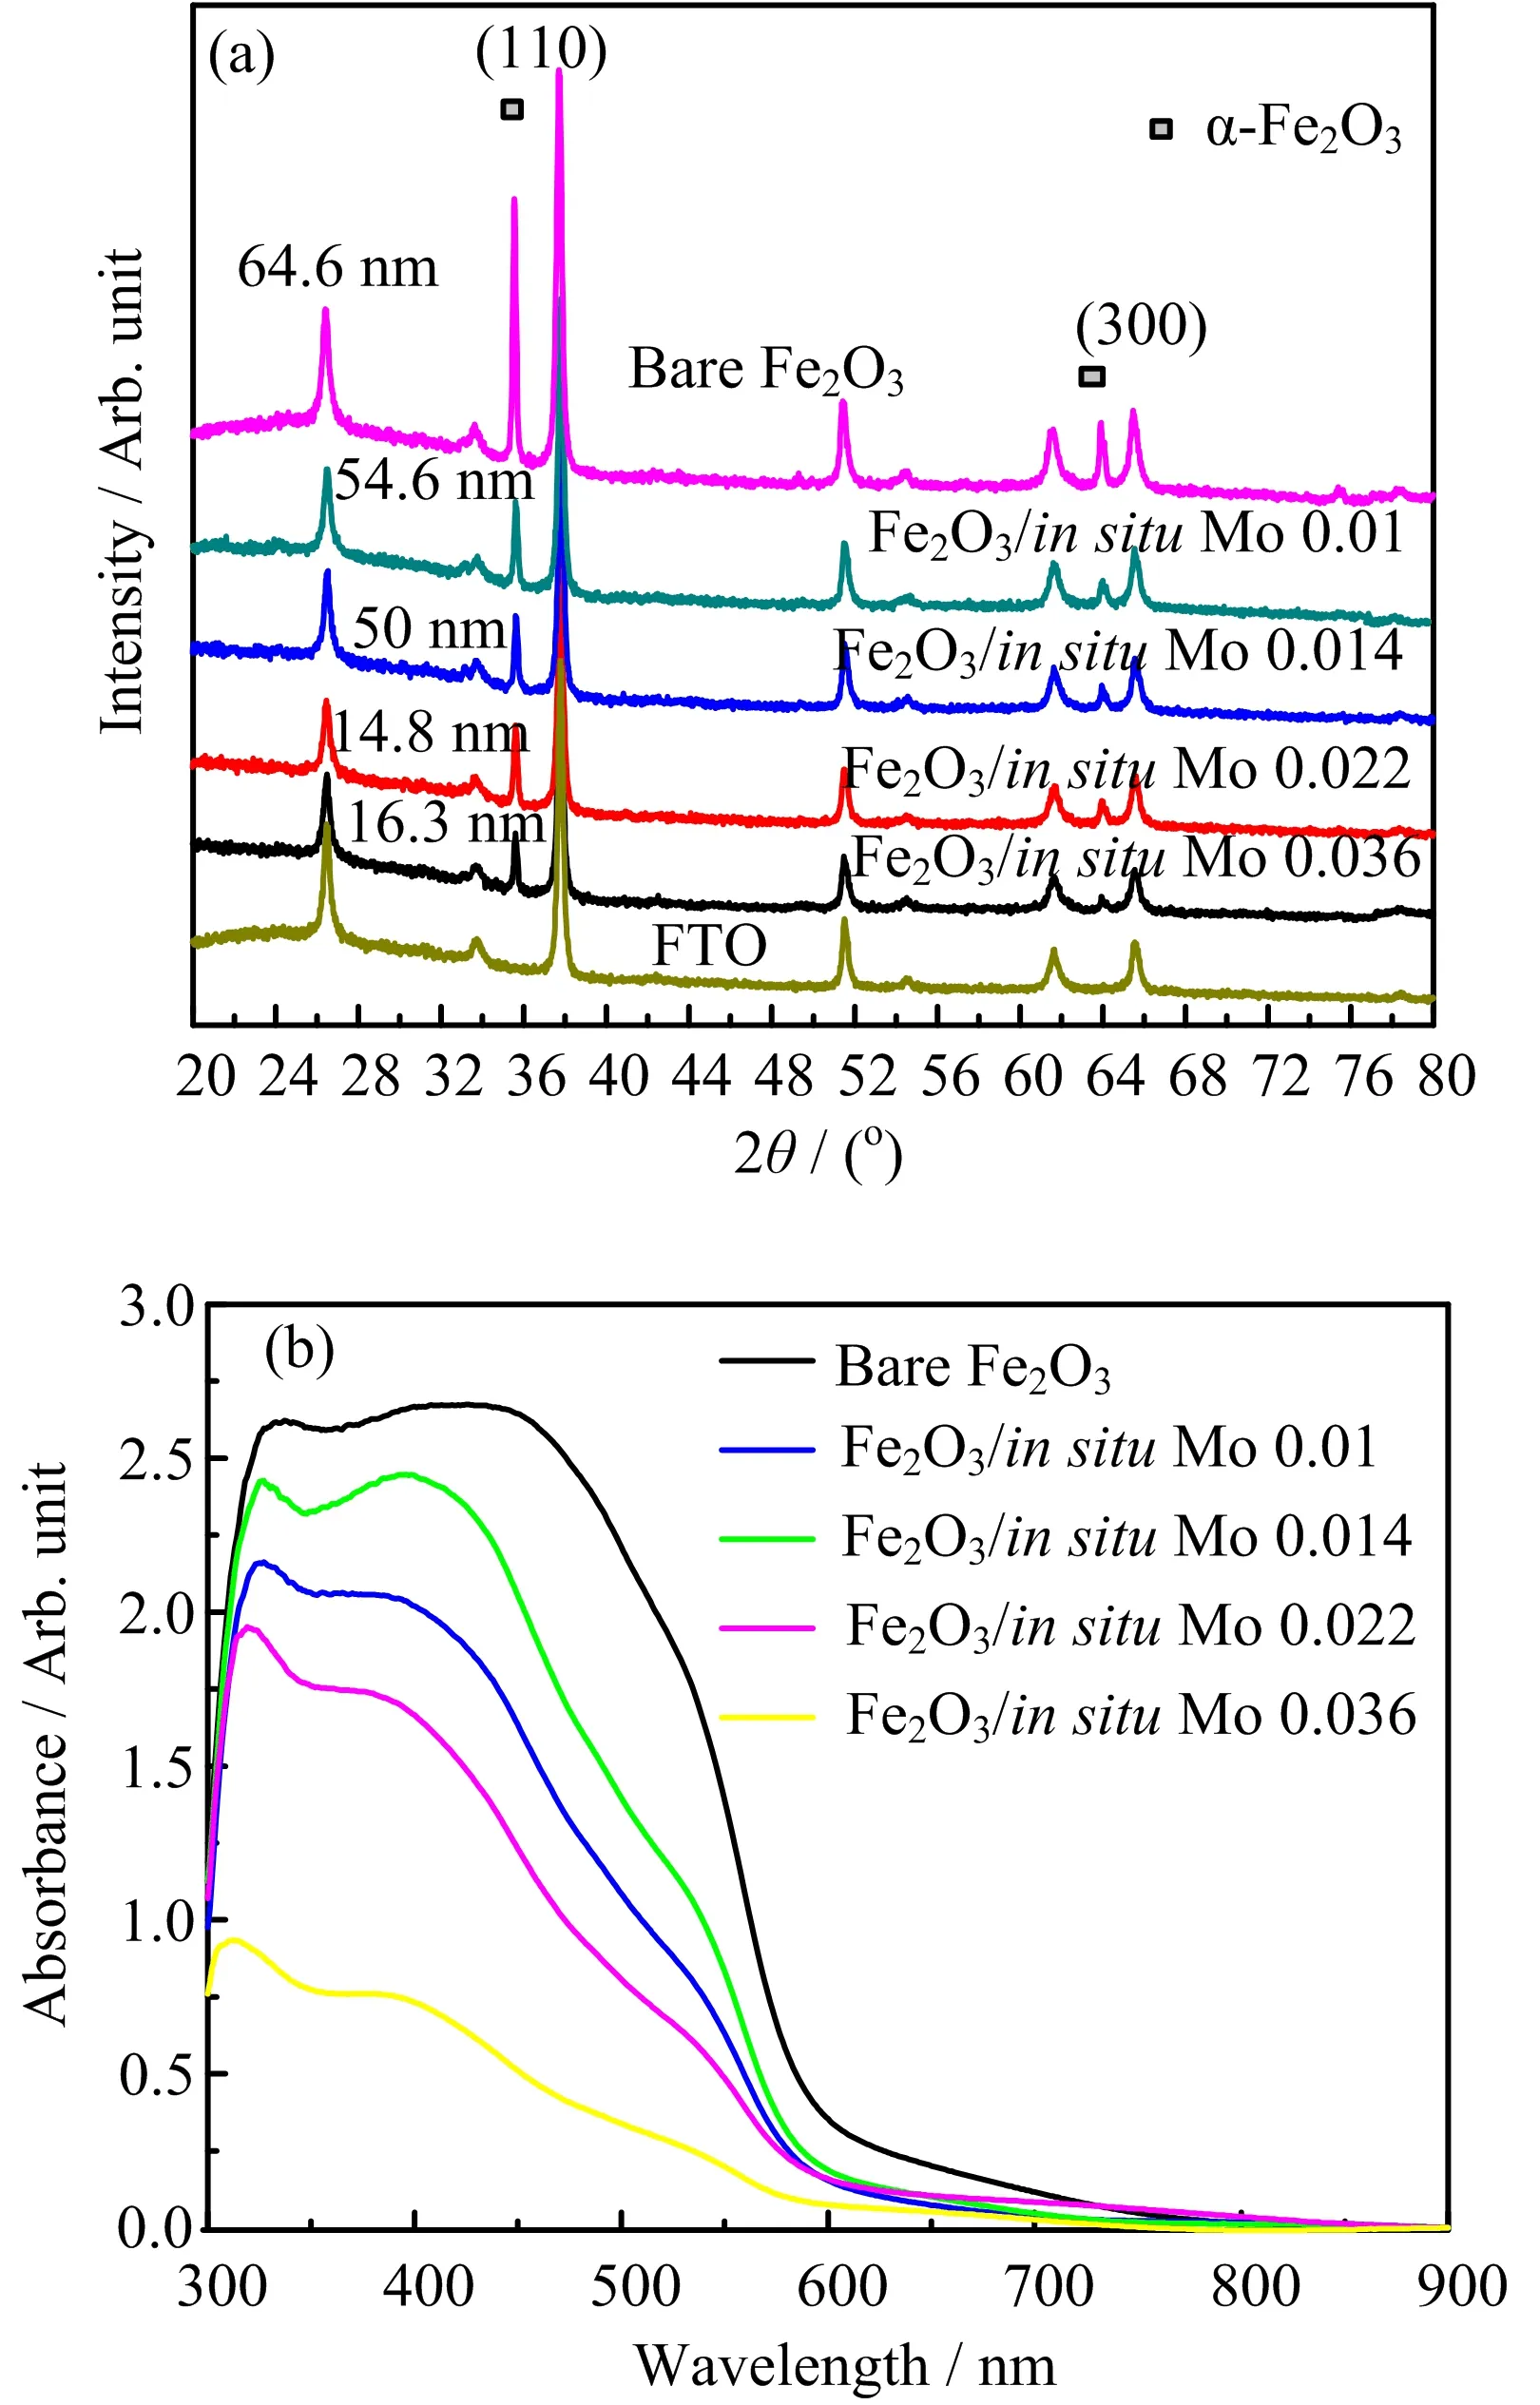
FIG.1 X-ray diflraction patterns(a)and UV-Vis absorbance spectra(b)of pristine and Na2MoO4 in situ mediated hematite photoanodes.
The molybdate in situ mediated hematite films were further characterized by SEM-EDXS to measure Mo/Fe ratios,and were named according to the actual Mo/Fe ratios.Samples mediated with varied concentrations of NaMoO4of 0.3,0.45,1.5,3 mmol/L were referred to as Fe2O3/in situ Mo 0.01,Fe2O3/in situ Mo 0.014,Fe2O3/in situ Mo 0.022,Fe2O3/in situ Mo 0.036 respectively.The X-ray diflraction(XRD)patterns for the pristine and Mo-mediated hematite films are shown in FIG.1(a).In comparison with the spectra of FTO substrate,two additional diflraction peaks at 35.6◦and 64.5◦appeared in all the synthesized samples,which could be assigned to the(110)and(300)planes of α-Fe2O3(JCPDS No.33-0664),respectively.The grain sizes of diflerent hematite films were deduced from the broadening of the(110)diflraction peak.With the increasing concentration of Na2MoO4,the crystallite size of hematite was decreased from∼64 nm to 14 nm.This was probably due to the absorption of MoO42−to the FeOOH[49],which would aflect the crystallization of FeOOH.In our earlier study[50],the adsorption of phosphate groups(PO43+)on the certain planes of FeOOH nuclei was also found to aflect the growth of FeOOH,leading to the formation of an ultrathin nanocube-structured FeOOH film.FIG.1(b)shows optical absorbance spectra of the bare and Mo mediated hematite films.The hematite films show an absorption edge at around 600 nm,which is compatible with its band gap energy(2.2 eV).Since hematite has an indirect band gap,the indirect/direct optical band gap energies were estimated by tauc plot as shown in FIG.S1(supplementary materials).Direct and indirect transition band gaps of the bare hematite were found to be 2.15 eV and 2.11 eV respectively,which is consistent with the band gap of hematite in Ref.[51].However,the in situ mediated samples showed a little larger band gap due to the introduction of Mo element(maximum:2.17 eV for direct band gap and 2.13 eV for indirect gap).Besides,the spectra profi les of the Na2MoO4mediated photoanodes were significantly changed.With increasing the concentration of the Na2MoO4(0.3−3 mmol/L),the absorbance decreased due to the introduction of Na2MoO4,indicating the reduced thickness of the hematite films as shown in FIG.2[52].
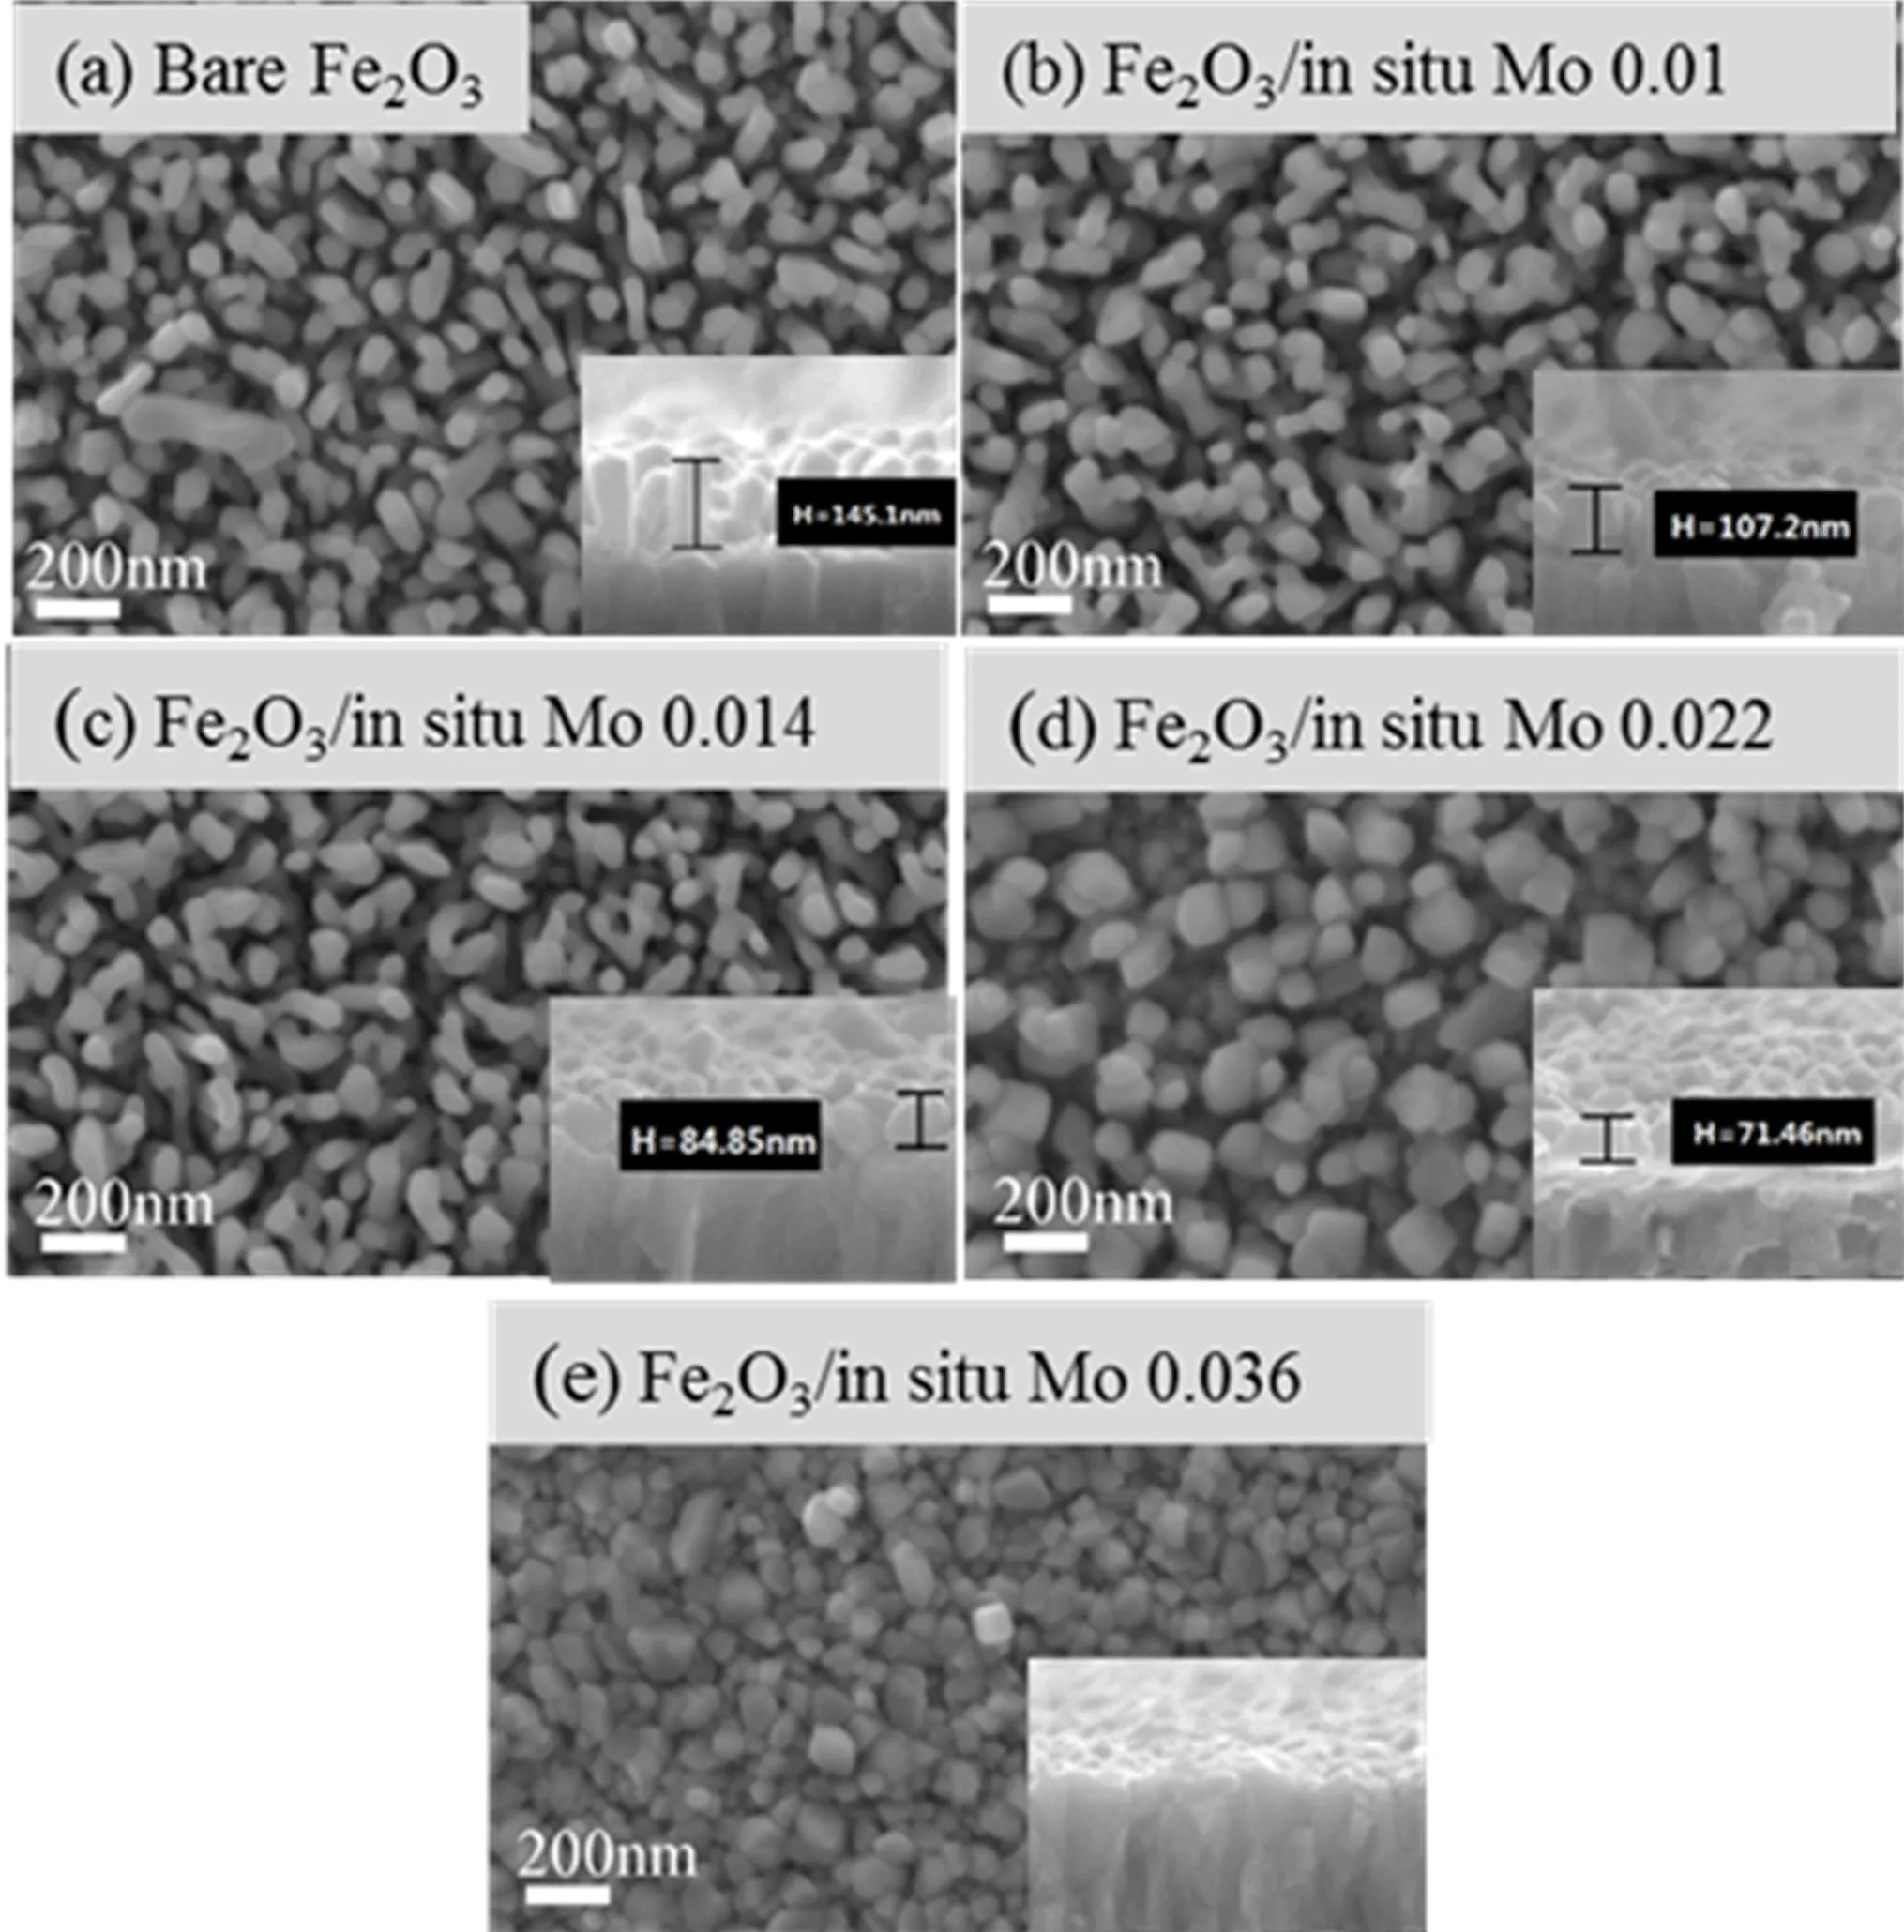
FIG.2 SEM micrographs of bare and Na2MoO4 in situ mediated hematite of the photoanodes.
The surface morphology of the as-synthesized samples was examined by SEM.FIG.2 gives the topview and cross section SEM images(inset)of the bare Fe2O3and Mo mediated α-Fe2O3.As shown in FIG.2,nanorod arrays grow evenly on the FTO substrate in the vertical direction for bare hematite and low-level Mo mediated samples.However,further increasing to 1.5 mmol/L,surface morphology and particle sizes began to change.Larger nanoparticles with enlarged feature size were observed for sample Fe2O3/in situ Mo 0.022.Combining with the XRD analysis results,it can be inferred that the larger particles are polycrystalline and composed of many coalesced crystalline grains.Very small nanoparticles were randomly dispersed on the FTO surface if excessively high concentration of Na2MoO4(3 mmol/L)was introduced.This is consistent with the results of the XRD and absorbance spectra.In general,introduction of Na2MoO4can severely influence the growth of FeOOH grains.Increasing the concentration of the Na2MoO4(0.3−1.5 mmol/L)led to the film thickness decreasing from 145 nm to 71 nm.

FIG.3 J-V characteristics curves of Mo in situ mediated hematite films recorded in 1.0 mol/L NaOH in the dark(dashed lines)and under light illumination.
The J-V curves of the as-synthesized samples were recorded in the dark and light illumination and the results are shown in FIG.3.Compared with the bare hematite,the photocurrents of the Mo in situ mediated samples were greatly improved.A photocurrent of 0.45 mA/cm2was obtained for the pristine Fe2O3at+1.23 VRHE.The photocurrent increased to 0.98 mA/cm2@1.23 VRHEfor the Fe2O3/in situ Mo 0.01.However,further increasing the concentration of Mo deteriorated the PEC performance,such as sample Fe2O3/in situ Mo 0.022 and Fe2O3/in situ Mo 0.036.The dark current onset potential for water oxidation of all photoanodes was also measured.A positive shift of about 100 mV in the dark current onset potential was observed for all Mo mediated hematite samples,which suggested that the Mo mediated samples made the water oxidation kinetics slow down.In this case,the surface catalysis eflects can be excluded[36].
In order to elucidate reasons behind the enhancement,the J-V characteristic curves were recorded in the presence of H2O2,which was a strong hole scavenger[53,54].
J-V curves of Mo in situ modified hematite electrodes were recorded in 1.0 mol/L NaOH containing 0.5 mol/L H2O2.The total photocurrent generated(JH2O)by a photoanode in 1 mol/L NaOH can be expressed as Eq.(1)[53].

Jabsorbedis the photocurrent calculated based on the corresponding UV-Vis absorption spectra.The total photocurrent generated(JH2O)depends on the charge separation efficiency(ηchargeseparation)in the bulk of hematite and charge injection efficiency(ηchargeinjection)in the interface between the hematite and electrolyte.As an strong hole scavenger,the charge transfer from the hematite to H2O2is very fast,so ηchargeinjectionis assumed to be 100%.Then,

Therefore,

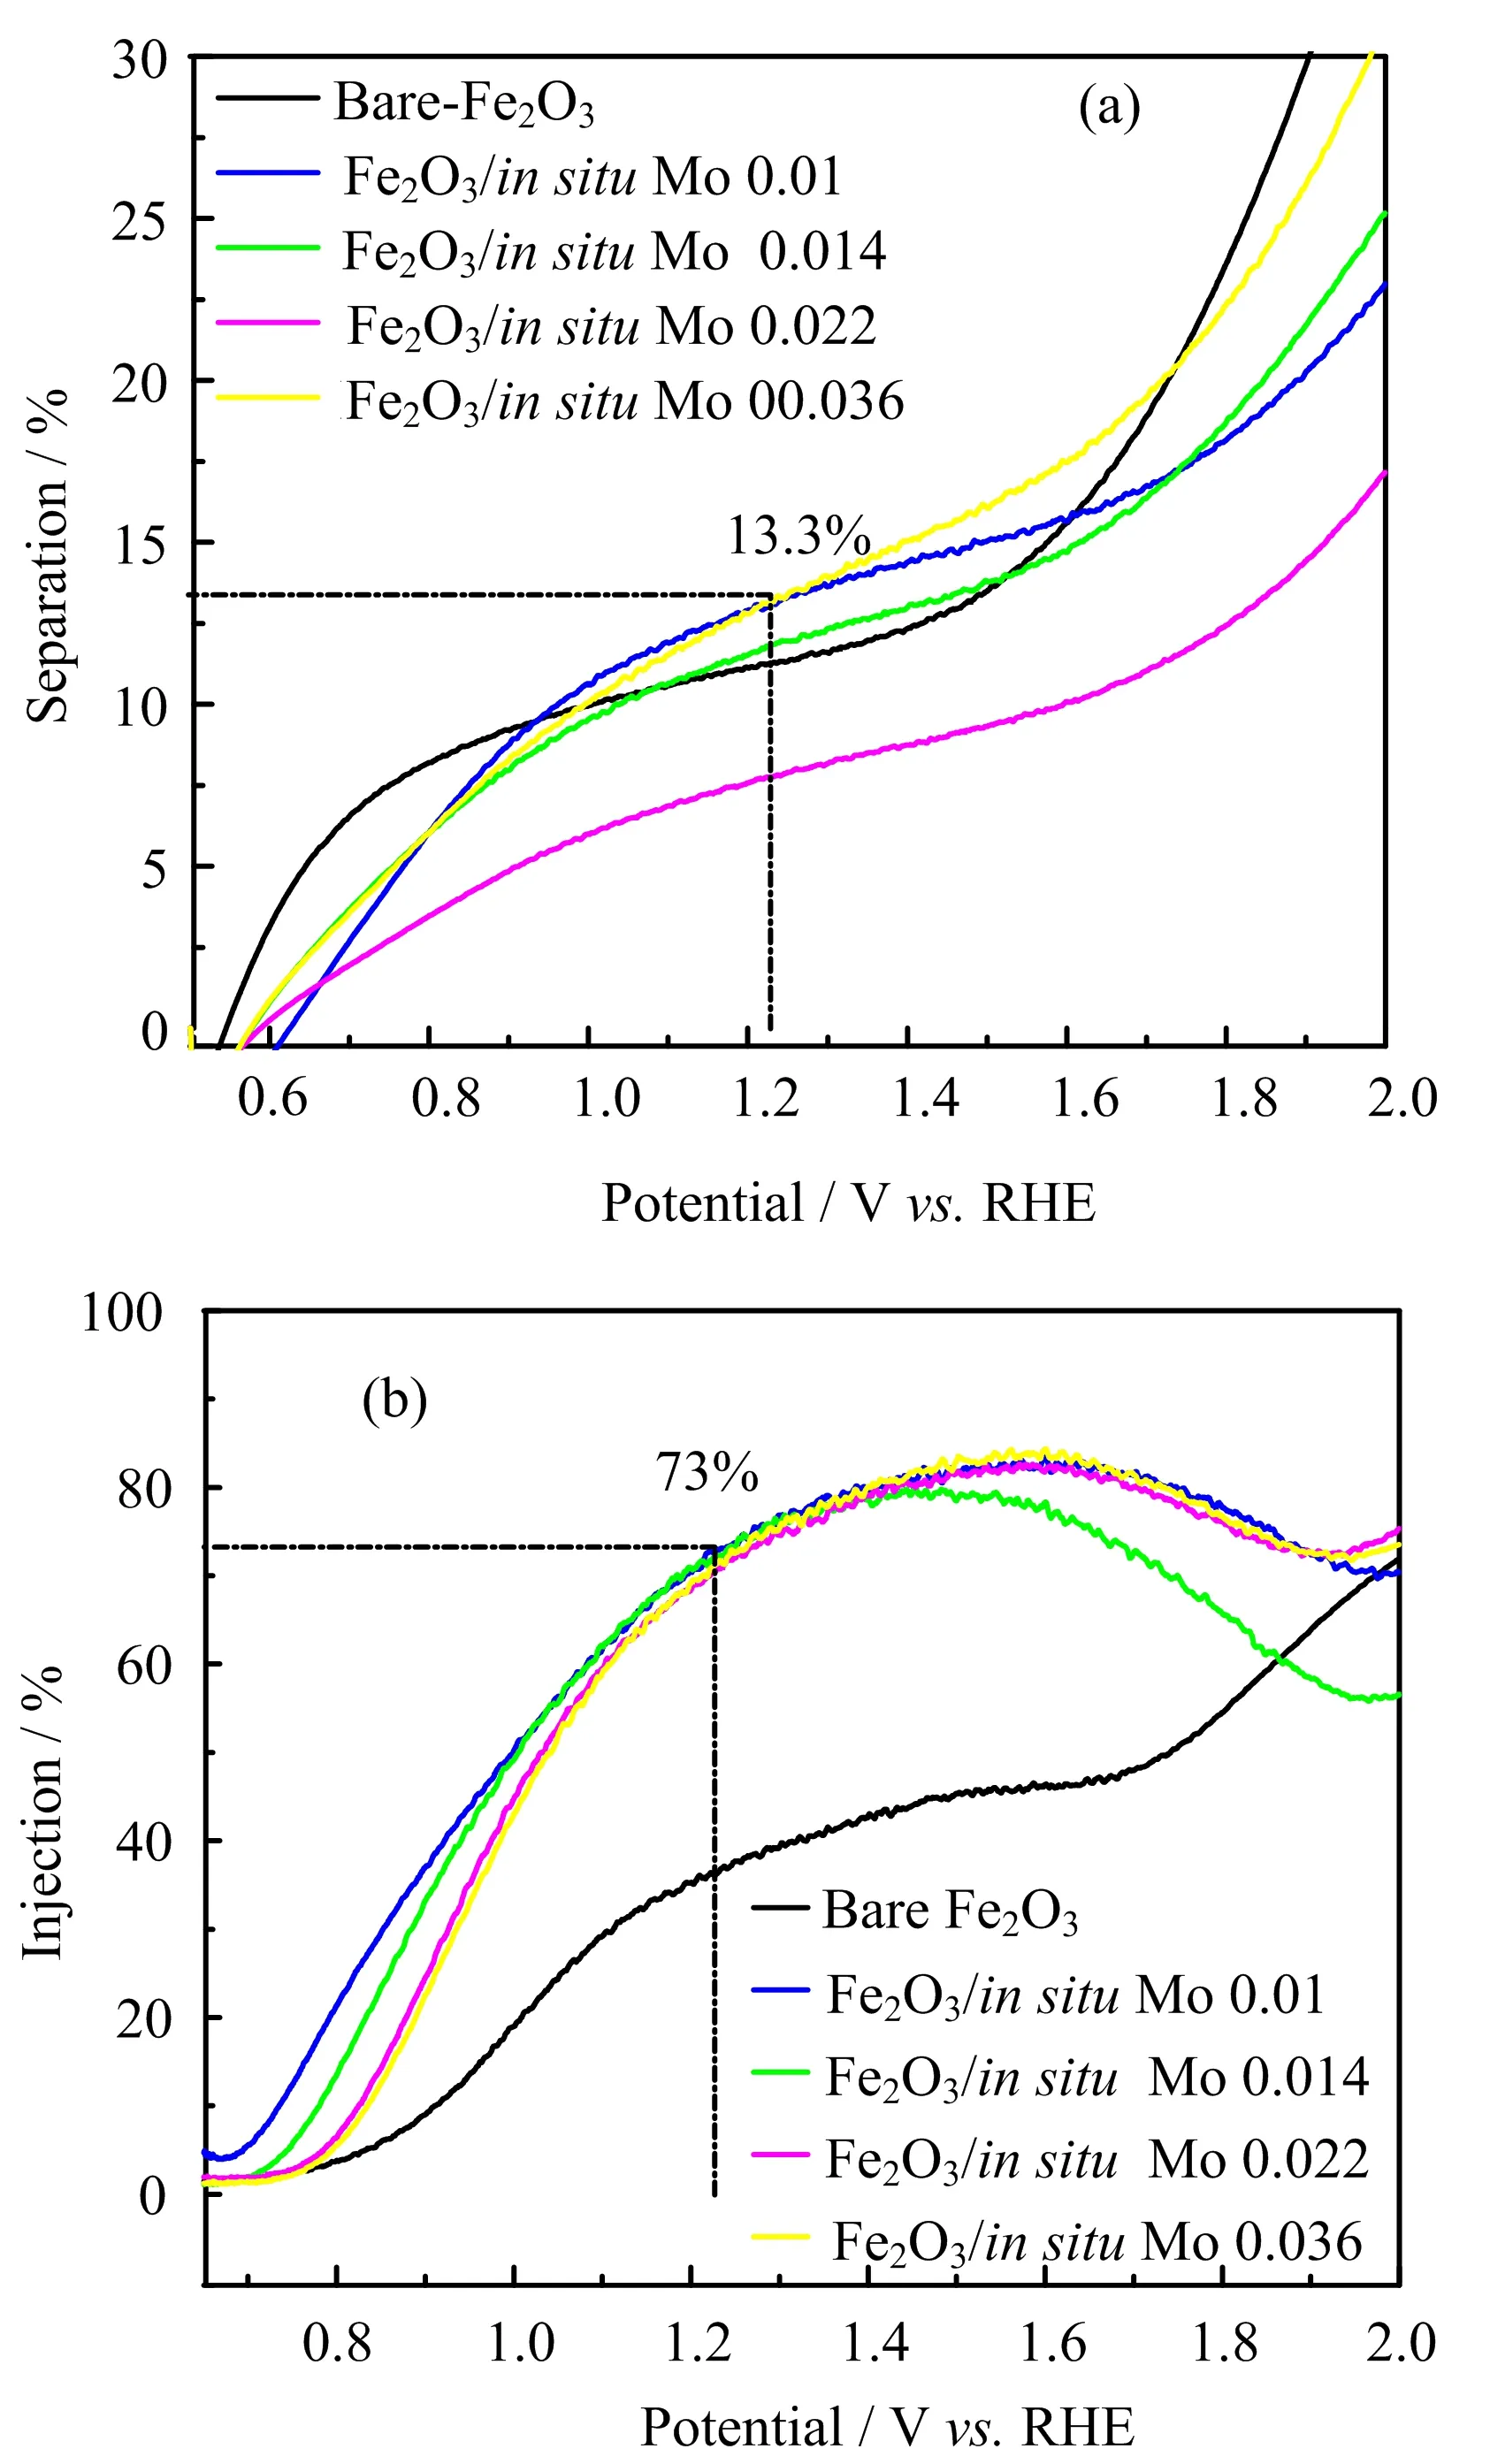
FIG.4(a)Yields of charge separation and(b)yields of charge injection for bare and Mo in situ α-Fe2O3films.
Combining Eq.(2)and Eq.(3),ηchargeinjectioncan be obtained:

Combining Eq.(4)and Eq.(5),the values of the ηchargeseparationcan be calculated according to the values of JH2O,JH2O2,and Jabsorbed.The charge separation and injection efficiency values versus applied potential are plotted in FIG.4(a)and(b),respectively.
Compared with the bare hematite film(11.4%),the charge separation yields for the Mo mediated samples increased a little bit to 13.6%for the best trial.On the other hand,the ηchargeinjectionfor Mo mediated samples electrodes are almost the same(∼73%at 1.23 V vs.RHE).Compared with the bare Fe2O3(36%at 1.23 V vs.RHE),it is a rise of two fold,indicating that the severe surface recombination was greatly alleviated.
To better analyze the diflerences in the electrochemical properties,Mott-Schottky measurement and electrochemical impedance spectroscopy were conducted in the dark.As shown in FIG.5(a),the Mott-Schottky(M-S)plots for all the samples show positive slopes,which indicates both bare and Mo-mediated hematite are n-type semiconductors.The slopes fitted from the M-S plots can be used to estimate the carrier densities according to the following equation[55]:
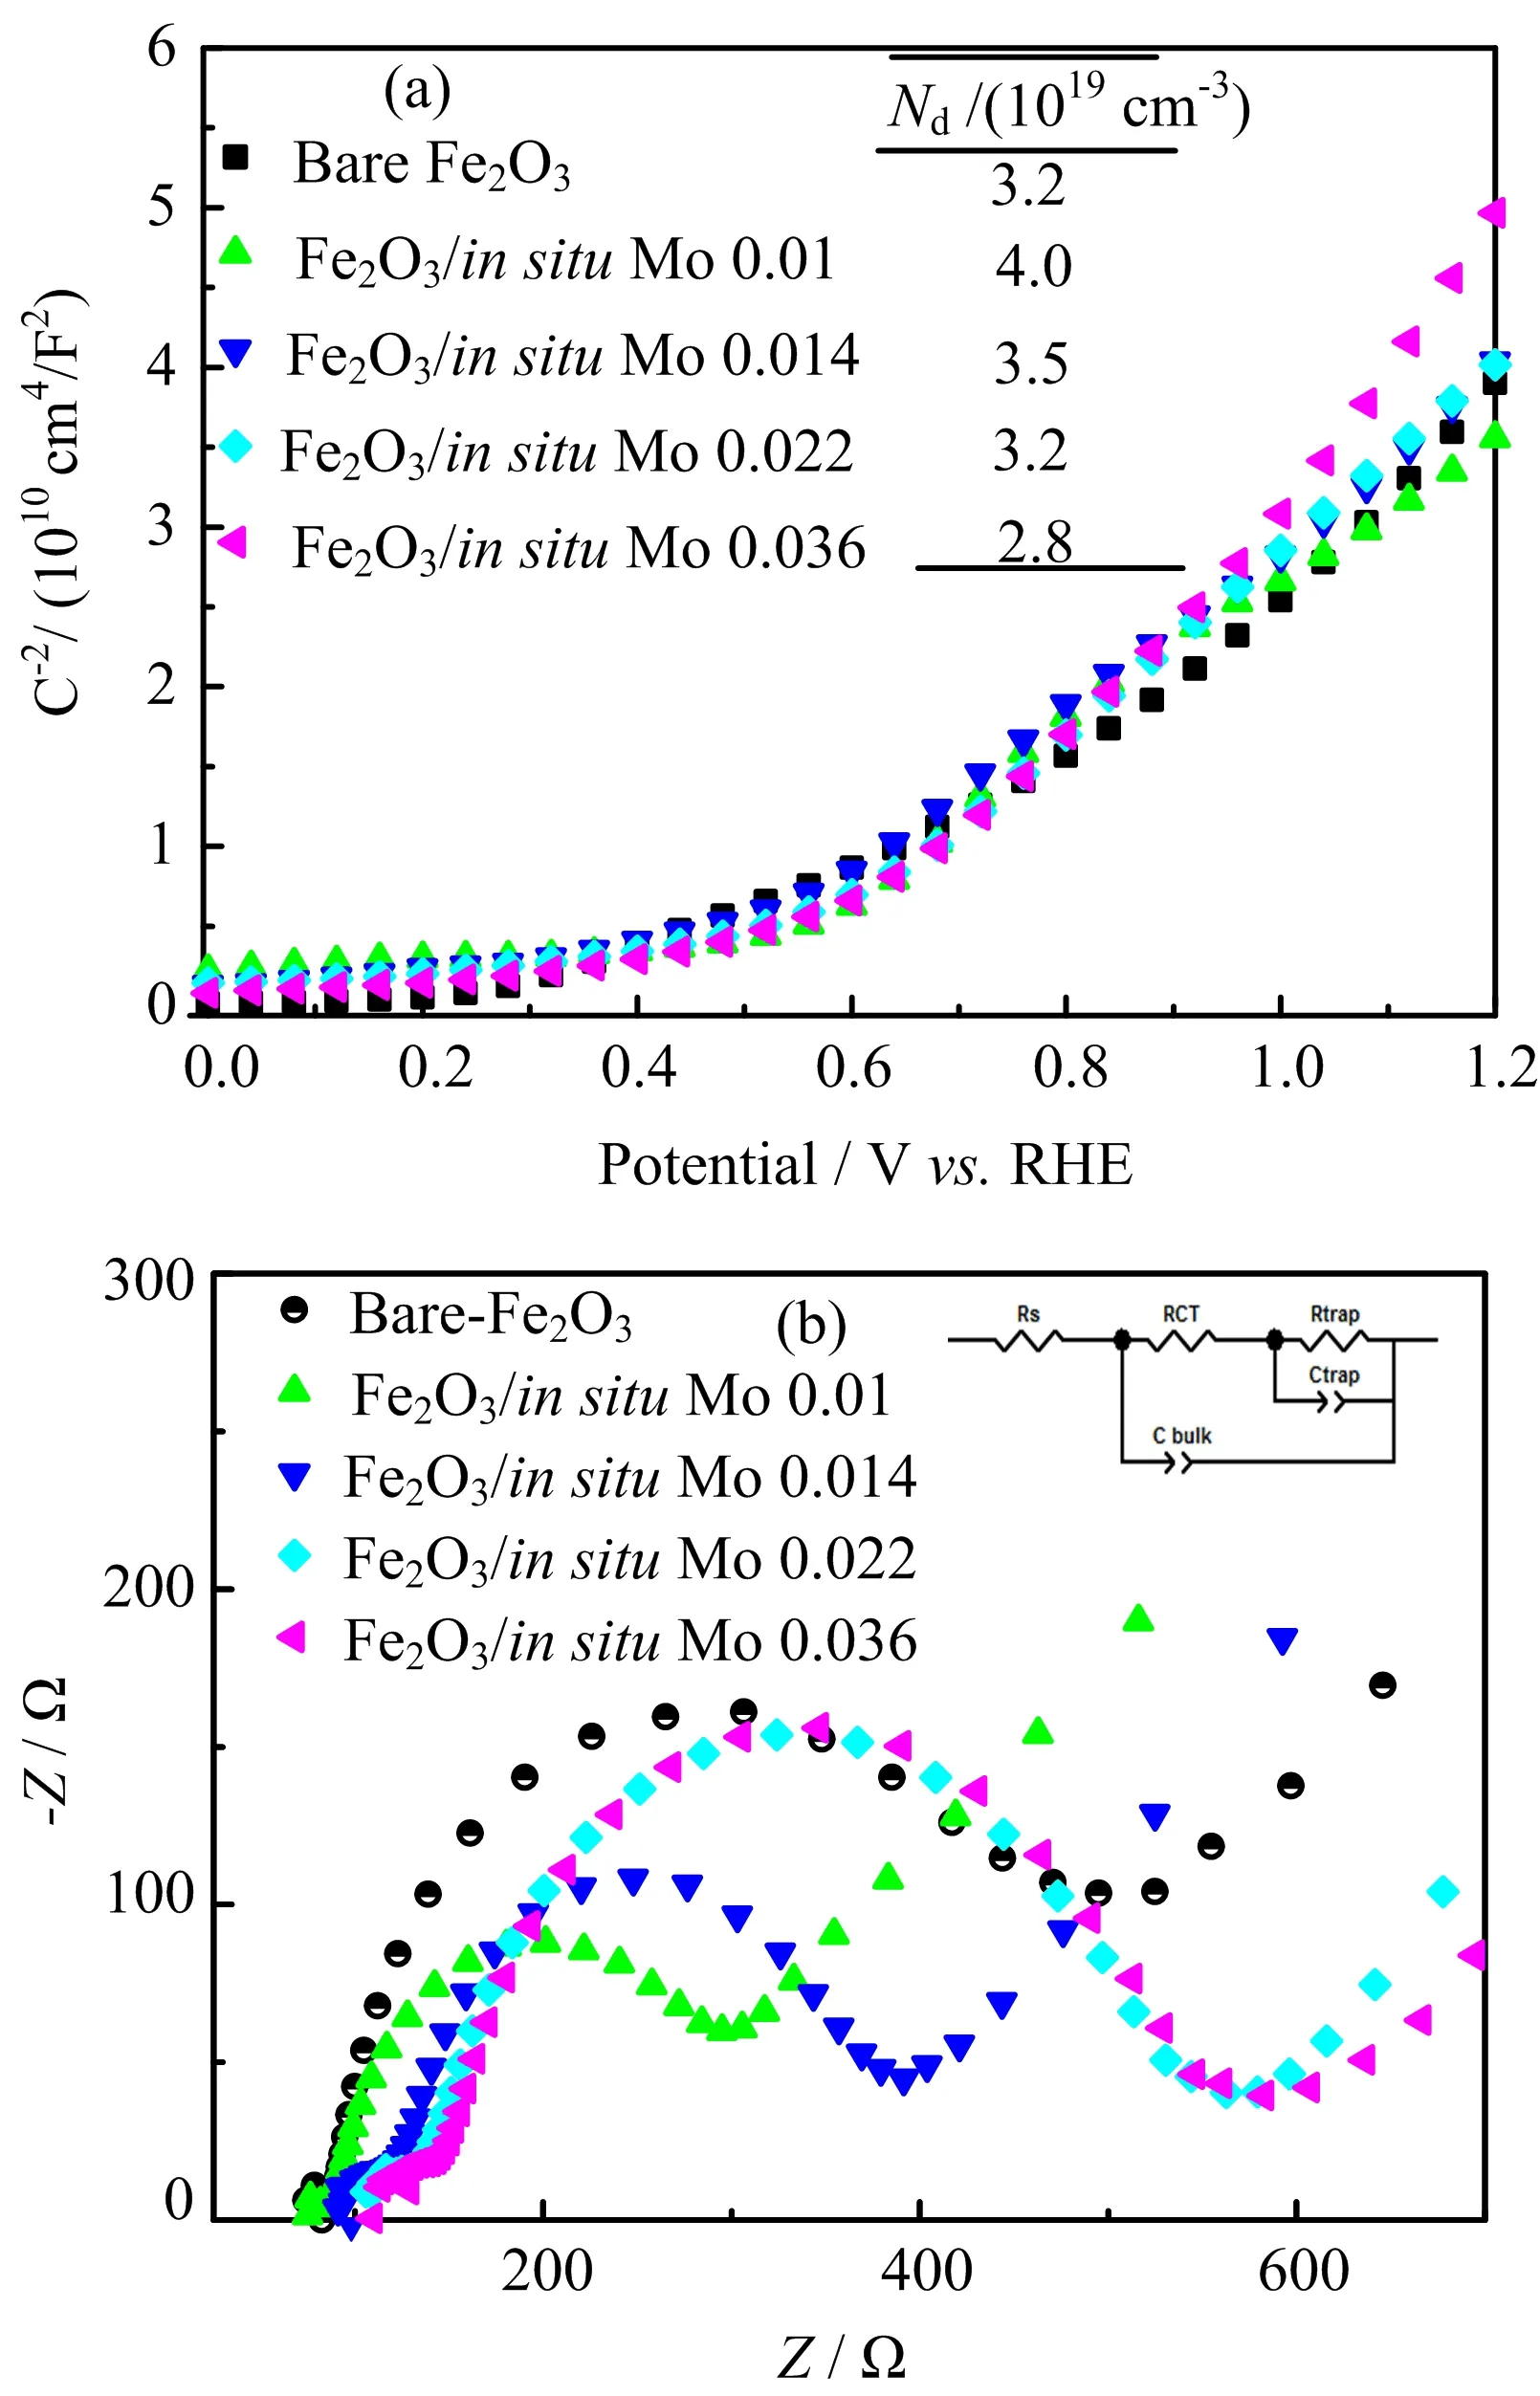
FIG.5(a)Mott-Schottky(M-S)plots and(b)EIS Nyquist plots of bare Fe2O3and Mo in situ mediated samples.
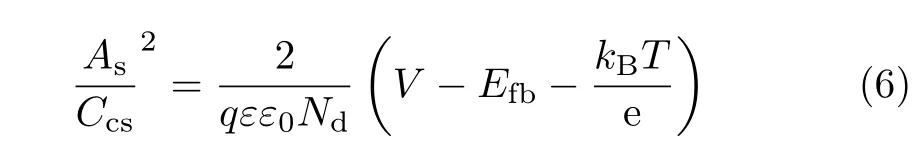
where Asrefers to the real surface area of the electrode,Ccsrefers to the space charge capacitance,q is the elementary charge,ε is the dielectric constant of hematite,ε0is the permittivity of vacuum(8.854×10⁻¹⁴C·V−1·cm−1),V refers to the applied potential,kBis Boltzmann’s constant,Efbrepresents theflat-band potential,T is the absolute temperature and Ndis the carrier density in the photo-electrode.As shown in FIG.5(a),the carrier densities of Mo mediated samples ranged from 2.8×1019cm−3to 4.0×1019cm−3,which is comparable to that of the bare Fe2O3films,suggesting that the doping eflect is not pronounced for the Mo mediated samples.Then,we sought to further examine those Mo mediated samples by taking electrochemical impedance spectroscopy(EIS)in dark.The Nyquist plots of all the samples are shown in FIG.5(b).The spectra consisted of two overlapping semicircles.To better interpret the results,an equivalent circuit model was built to fit the EIS data(inset,FIG.5(b)),where Rsrefers to all the series resistances in the system,Rctrefers to the charge transfer resistance in bulk of Fe2O3,Rtrapis associated with the interfacialhole transfer from the surface states.The fitting results in Table I show that in comparison to bare Fe2O3,samples Fe2O3/in situ Mo 0.01 and Fe2O3/in situ Mo 0.014 show relatively lower Rtrap,indicating a decreased charge transfer resistance of the Fe2O3/electrolyte interface.However,higher concentration of Mo led to fairly high Rtrap,which is more likely due to the more defective surface of samples Fe2O3/in situ Mo 0.022 and 0.036.As shown in FIG.1(a)and FIG.2,those samples with high level of Mo are composed of agglomerates of smaller crystallites(14−16 nm),possessing more surface area and defects,which led to more severe charge recombination.
B.Na2MoO4 ex situ mediated hematite photoanodes
Generally,there are several factors aflecting the PEC performances,such as morphology,conductivity,surface characteristics etc.In order to avoid being influenced by morphology change or doping eflect,Na2MoO4was introduced in the third stage:bare Fe2O3films were soaked in Na2MoO4solution,followed by diflerent temperature heat treatment.FIG.S2 in supplementary materials shows the morphology of the Na2MoO4modified hematite samples under diflerent temperatures. It can be seen that,at lower temperatures such as 300◦C,the hematite nanorods were covered with layered Na2MoO4crystallites.However,at higher temperatures(400−750◦C),a smoother surface was observed due to the migration and decomposition of Na2MoO4.As can be seen in FIG.S3 in supplementary materials,varied temperature heat treatments led to diflerent PEC responses,the photocurrent density increased slightly with increasing the heating temperatures and then decreased when excessively high temperatures(400−750◦C)were used.Then 300◦C were selected for further study.The eflects of diflerent concentrations of Na2MoO4were investigated as well.
As can be seen in FIG.6(a),similar absorbance spectra with band gap around 2.15−2.17 eV(FIG.S4 in supplementary materials)were observed for all Mo ex situ modified samples,indicating that the film thickness and light absorbance were not aflected by the surface modification.However,the photocurrent was substantially improved due to the surface modification with Na2MoO4.A photocurrent of 1.1 mA/cm2was obtained for the Fe2O3/ex situ Mo 1.2 at+1.23 VRHE.However,further increasing the concentration of Mo deteriorated the PEC performance,such as sample Fe2O3/ex situ Mo 30.Diflerent from the Fe2O3/in situ Mo samples,the morphology and doping eflect can be excluded in this case.The enhanced performance could be attributed to the surface catalysis or passivation of the surface state.Normally,the surface decoration of electro-catalysts(e.g.,IrOx,Co-Pi[56,57],CoOx)or deposition with passivation layers(e.g.,Al2O3[47],Ga2O3[46],SiOx[48])often highly enhance the PEC performances of Fe2O3.It has been found that the former played a role mainly through promoting the hole transfer in the interface[57,58],while the latter could decrease the recombination center in the interface works through passivating the surface trap states[47].In our case,the obvious anodic shift of the dark current onset potential was observed for all the Mo mediated or surface modified samples(FIG.3 and FIG.6(b)),indicating that those Mo based surface layer do not have good catalytic properties for water oxidation[47,48].
Then how does those surface molybdate aflect the PEC performance?Actually,the surface polymerization of Mo(VI)on hematite has been well studied by in situ infrared spectroscopy and DFT+U theoretical analysis[49].Molybdate on the surface of Fe2O3was observed in high concentration(∼1 mmol/L)whose growth starts from two dimensions,then in threedimension upon increasing its concentration.While,in the low concentration ranges(∼0.01 mmol/L),monodentate surface complexation mainly exists in the surface of hematite.It is reported that the oxygen distance(2.6−3.0 ˚A)on the hematite(0001)face is close to that in the molybdate(2.6−3.6 ˚A)[49],which facilitates the formation of polyoxomolybdate on the hematite surface.In our case,the concentration of molybdate ranges from 0.3 mmol/L to 30 mmol/L and it is believed that the surface polyoxomolybdate existed among most of the samples.Those polymers may serve as passivation layers to reduce the surface state and saturate the dangling bonds in the surface.As shown in FIG.6(b),the photocurrent onset potential(Vonset)of the bare Fe2O3is 0.75 V vs.RHE,then its photocurrent density increases slowly and reaches a saturated value of 0.69 mA/cm2at 1.7 V vs.RHE.For the samples with passivation layers,its photocurrent onset potential shifts slightly more negative,and its photocurrent density increases much faster and reaches 1.74 mA/cm2at 1.7 V vs.RHE for the best one.Yet,all the dark current onset potential of the Mo modified samples shifts more positive,further indicating that the role of surface molybdate complex is passivation eflect.
The efficiency of charge separation and injection were also calculated as shown in FIG.S5 in supplementary materials.Similar to the in situ method,charge separation yield was not improved much,but the charge injection yield was greatly enhanced due to the passivation eflect.The concentration of the modifying agent influences the PEC performance significantly.For instance,thin polyoxomolybdate layers may passivate appropriate amount of defect states without inhibiting hole transfer.But an excessively thick layers of polyoxomolybdate in sample Fe2O3/ex situ Mo 30 will block the hole transfer,thus leading to a lower photocurrent density(FIG.6(b)).
The suppression of surface states by the polyoxomolybdate layers was then further investigated by Mott-Schottky and EIS measurement[46−48],and the results are shown in FIG.7.It is interesting to find that the carrier densities(FIG.7(a))for the Mo surface modified samples have nearly doubled compared with bare hematite.Moreover,compared with the bare hematite,Mott-Schottky curves of the Mo modified samples tend to increase linearly with potential,indicating the surface states have been partly suppressed[42].The passivation eflect of polyoxomolybdate is expected to influence the recombination pathways of the photo-excited holes at the hematite-electrolyte interface.FIG.7(b)shows Nyquist plots of EIS data for all samples.The spectra consist of two overlapping semicircles and arefitted with the equivalent circuit as shown in the inset of FIG.7(b),which is mainly considered as charge transfer resistance through the bulk film and interfacial hole transfer resistance from the surface states.Fittingresults are listed in Table II.Compared with the bare hematite,the Rtrapfor all the samples have been greatly decreased,indicating a decreased charge transfer resistance and less recombination due to the passivation of surface states.This is consistent with the results in FIG.6(b).
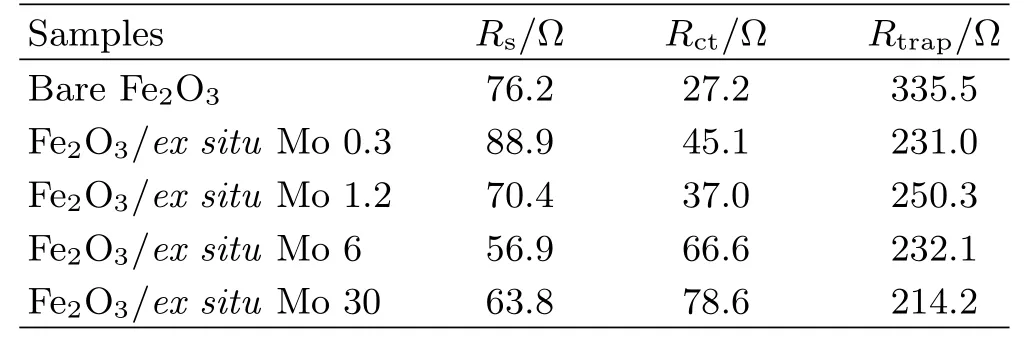
TABLE II Fitting results for EIS plots of bare and Mo ex situ mediated hematite films.
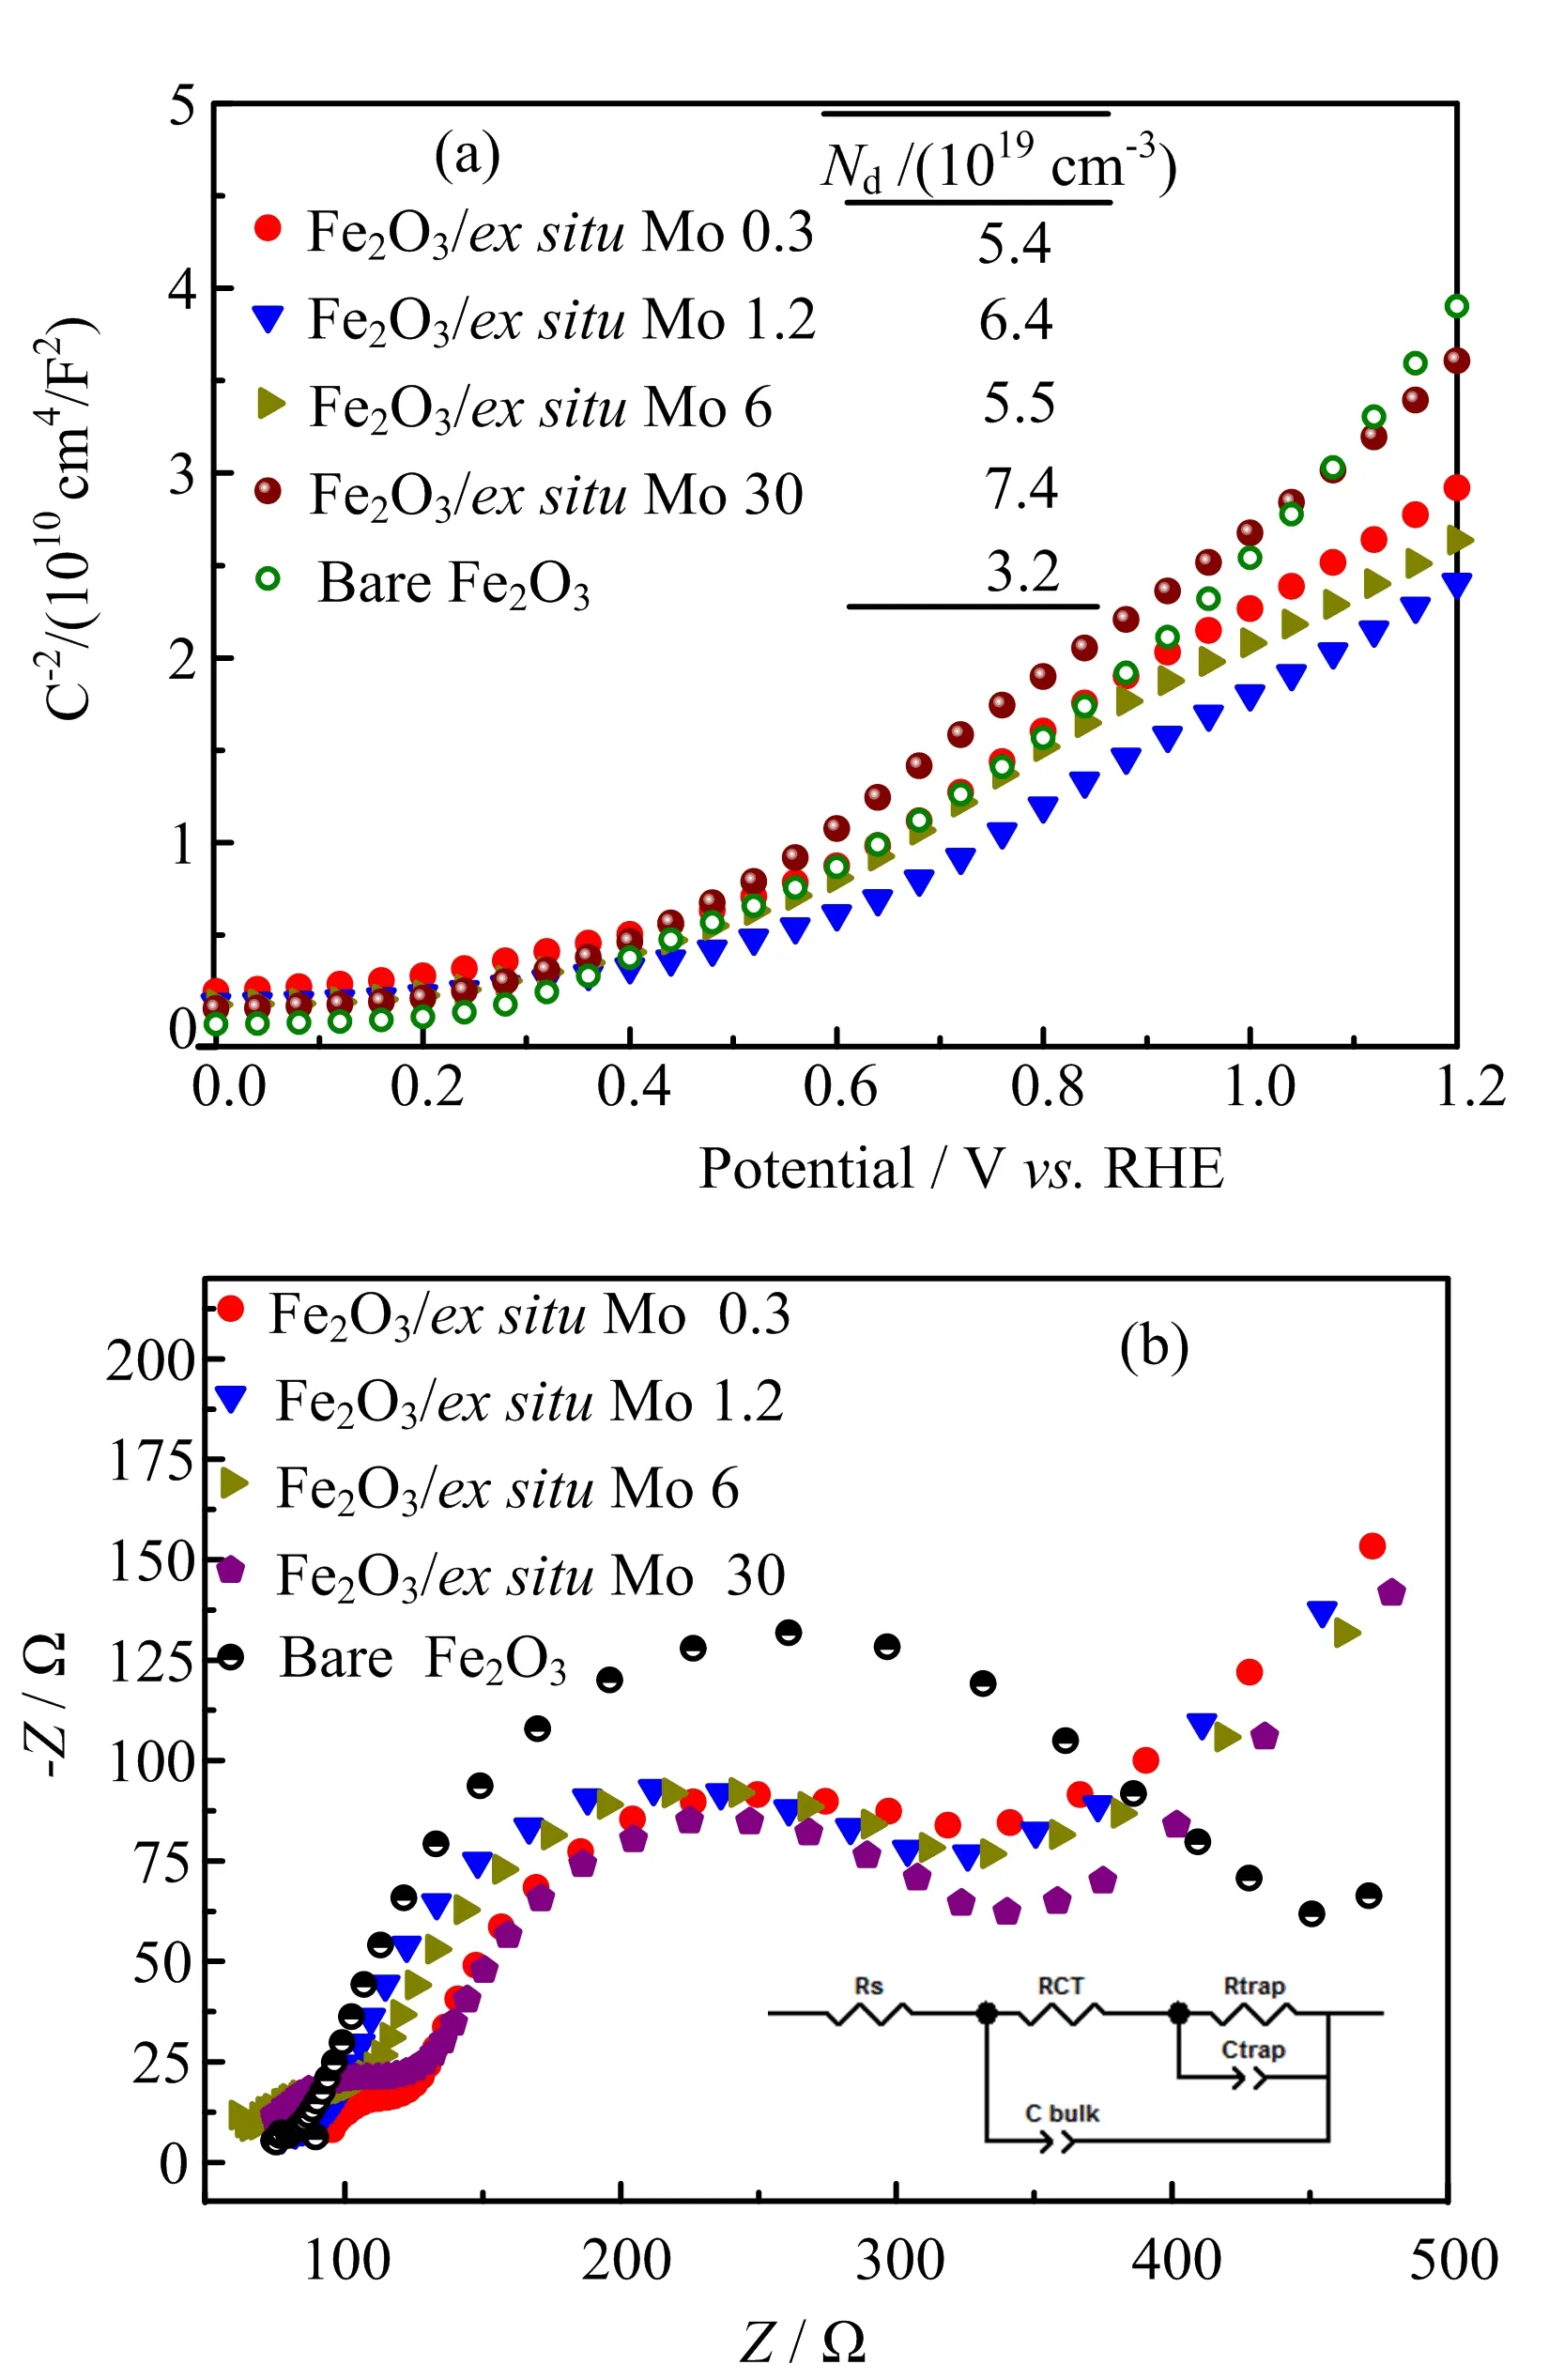
FIG.7(a)M-S plots and(b)EIS Nyquist plots of bare Fe2O3and Mo ex situ modified samples.

FIG.8 Survey scan XPS spectra of bare and Mo modified samples(a),fine XPS spectra of O1s spectra(b,d,f),Fe 2p spectra(c)and Mo 3d spectra(e)for bare and Mo mediated hematite films.
Then the surface electronic structure of the bare and Mo mediated hematite films were further characterized by XPS.As expected the XPS survey spectra collected from all the samples in FIG.8(a)show Fe,O,Sn(Sn:FTO glass)peaks.Additional Mo 3d peaks were observed for both Mo modified samples.The fine XPS spectra of Fe 2p and Mo 3d are shown in FIG.8(c)and(e),respectively.The Fe 2p spectra for bare and Mo-mediated hematite confirmed the existence of Fe3+in both samples[59,60].However,for the Mo-modifiedfilms,the Fe2+shakeup satellite peak appears at 716 eV[59].The Mo 3d peaks for all the samples are centered at 232.8 eV with a very narrow FWHM of 0.9 eV which can be assigned to Mo6+[61,62].No Mo5+was found in samples by XPS[60].The binding energy of O 1s shows a broad peak which can be fitted into three contributions for all the samples(FIG.8(b,d,f)).For the bare hematite,the main peak centering at 528.9 eV originates from the α-Fe2O3lattice oxygen[63];the peaks at 530.64 and 531.69 eV are generally ascribed to the contribution of surface adsorbed oxygen species(e.g Oads,OH−)[13].Diflerently,a small peak with a higher binding energy of 532 eV was observed for the Mo modified samples(in situ and ex situ)as shown in FIG.8(d,f),which can be ascribed to the contribution of O in the MoOx[64].
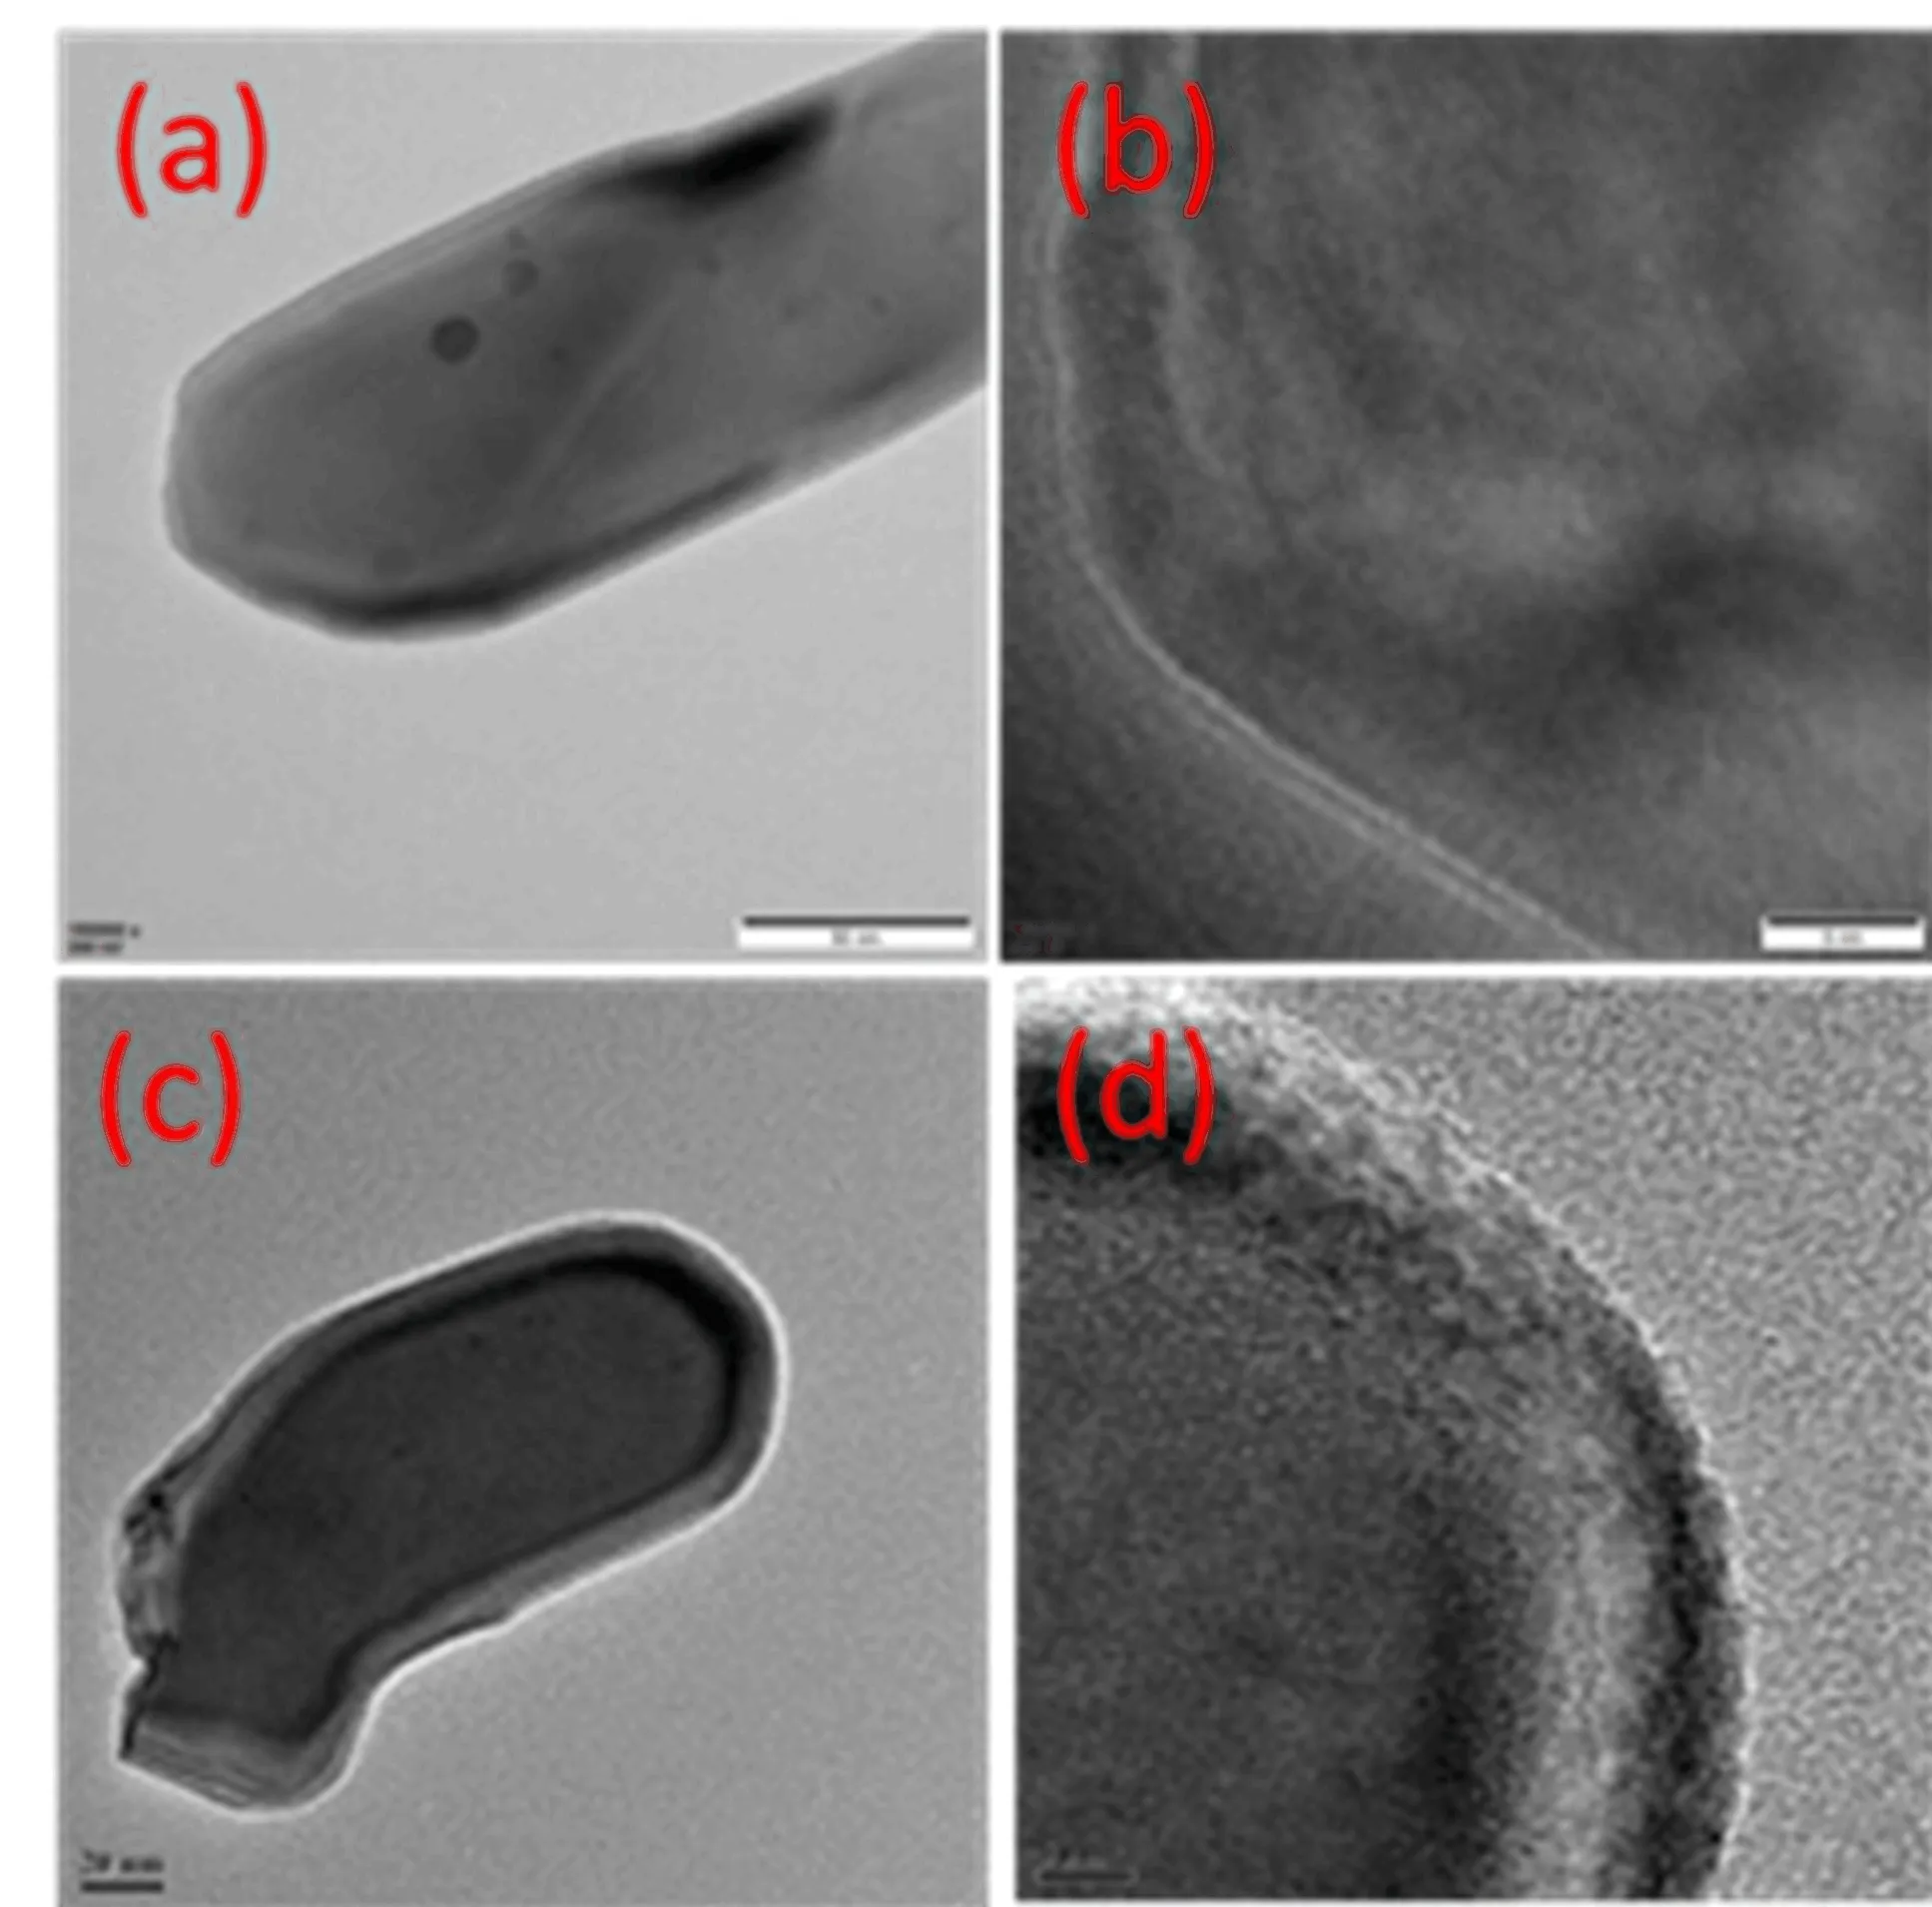
FIG.9 High resolution transmission electron microscopy(TEM)images of sample the bare hematite(a,b)and Fe2O3/ex situ Mo 0.3(c,d).
In order to further examine the surface of the Mo modified samples,the high resolution transmission electron microscopy(TEM)and high-angle annular dark field scanning transmission electron microscopy(HAADF-STEM)were conducted for the bare and Fe2O3/ex situ Mo 0.3 as shown in FIG.9 and FIG.S6 in supplementary materials.TEM image in FIG.9(a)confirmed the nanorod structure of the hematite.Lattice fringes can be clearly observed in the HRTEM of bare hematite(FIG.9(b)).However,for the sample Fe2O3/ex situ Mo 0.3(FIG.9(d)),the surface of nanorod has been covered by amorphous polyoxomolybdate layers as shown in FIG.9(d).Furthermore,it can be clearly seen from the HAADF-STEM images(FIG.S6 in supplementary materials)that,Mo,O,and Fe elements were uniformly distributed over the sample Fe2O3/ex situ Mo 0.3 nanorods.To further examine the thickness of the polyoxomolybdate layer,elemental compositions of sample Fe2O3/ex situ Mo 0.3 were characterized by XPS after diflerent etching time.The corresponding XPS survey spectra,Fe 2p and Mo 3dfine spectra are shown in FIG.S7(supplementary materials).The Mo/Fe atomic ratios were calculated and the relative XPS depth profile was plotted as shown in FIG.S8(supplementary materials).It can be seen that the Mo/Fe exhibited the highest value of 0.06 in the outmost layer of Fe2O3/ex situ Mo 0.3.Then the Mo/Fe ratio decreased gradually with increasing the etching time.Mo/Fe ratio was found to be 0.01 when the etching time reached 60 s,which is estimated to be about 16 nm in thickness.This is consistent with the observation in the HRTEM(FIG.9(d)).
The incident photon-to-current efficiency(IPCE)was also measured for the bare and Mo ex situ modifi ed hematite samples at 1.23 VRHE.As displayed in FIG.S9 in supplementary materials,the Mo modified hematite films exhibited much higher IPCE values than that of bare Fe2O3at each wavelength.The IPCE values of 2.1%were obtained at 400 nm for the bare hematite at 1.23 VRHE,which is similar to the values from other reports[8,65].A higher 7.5%IPCE values were achieved for Fe2O3/ex situ Mo 1.2,which is consistent with the trend in J-V curves(FIG.6).As moving to long wavelengths,the IPCE decreased gradually and dropped to zero above 600 nm,which is consistent with the results of UV-Vis absorption spectra.
IV.CONCLUSION
In this study,MoO42−was introduced to hematite via two synthesis routes:in situ mediation and ex situ modification.Through in situ mediation process,it was found the morphology and film thickness could be changed significantly due to the addition of MoO42−,while for the ex situ modification,the PEC performance of the hematite has been greatly improved by simply soaking in Na2MoO4.It was found that the molybdates could enhance the charge injection efficiency more significantly because of the sensitivity of surface recombination kinetics to the surface sites,which will be suppressed by the adsorbed molybdates.Amorphous polyoxomolybdate layer with a thickness of∼16 nm was observed by TEM and confirmed by XPS.This work presents a facile and eflective surface passivation method for hematite via in situ and ex situ mediation with molybdates,which oflers an alternative strategy for improving the PEC properties of hematite.
Supplementary materials:The SEM micrographs and J-V characteristics curves of Mo ex situ hematitefilms,HAASF-STEM images are given.
V.ACKNOWLEDGMENTS
This work was supported by the National Natural Science Foundation of China(No.21671148,No.21576215,and No.21503147)and Research Project of Tianjin Municipal Education Committee(2017KJ261).
[1]T.Hisatomi,J.Kubota,and K.Domen,Chem.Soc.Rev.43,7520(2014).
[2]C.R.Jiang,S.J.A.Moniz,A.Q.Wang,T.Zhang,and J.W.Tang,Chem.Soc.Rev.46,4645(2017).
[3]S.Kment,F.Riboni,S.Pausova,L.Wang,L.Y.Wang,H.Han,Z.Hubicka,J.Krysa,P.Schmuki,and R.Zboril,Chem.Soc.Rev.46,3716(2017).
[4]D.A.Wheeler,G.M.Wang,Y.C.Ling,Y.Li,and J.Z.Zhang,Energy Environ.Sci.5,6682(2012).
[5]W.M.de Carvalho and F.L.Souza,J.Mater.Res.29,16(2014).
[6]K.Sivula,F.Le Formal,and M.Graetzel,Chem-SusChem 4,432(2011).
[7]Z.D.Chen,H.N.Miller,and E.Miller,Photoelectrochemical Water Splitting:Standards,Experimental Methods,and Protocols,Berlin:Springer,(2013).
[8]G.M.Wang,Y.C.Ling,D.A.Wheeler,K.E.N.George,K.Horsley,C.Heske,J.Z.Zhang,and Y.Li,Nano Lett.11,3503(2011).
[9]K.Sivula,F.Le Formal,and M.Gr¨aetzel,Chem.Mater.21,2862(2009).
[10]M.Barroso,S.R.Pendlebury,A.J.Cowan,and J.R.Durrant,Chem.Sci.4,2724(2013).
[11]Y.J.Lin,G.B.Yuan,S.Sheehan,S.Zhou,and D.W.Wang,Energy Environ.Sci.4,4862(2011).
[12]M.Mishra and D.M.Chun,Appl.Catal.A 498,126(2015).
[13]M.Pyeon,T.P.Ruoko,J.Leduc,Y.G¨on¨ull¨u,M.Deo,N.V.Tkachenko,and S.Mathur,J.Mater.Res.33,455(2018).
[14]M.E.A.Warwick,G.Carraro,A.Gasparotto,C.Maccato,D.Barreca,C.Sada,E.Bontempi,Y.G¨on¨ull¨u,and S.Mathur,Phys.Status Solidi A 212,1501(2015).
[15]K.M.H.Young and T.W.Hamann,Chem.Commun.50,8727(2014).
[16]O.Zandi,B.M.Klahr,and T.W.Hamann,Energy Environ.Sci.6,634(2013).
[17]Y.C.Ling,G.M.Wang,H.Y.Wang,Y.Yang,and Y.Li,ChemSusChem 7,848(2014).
[18]Gurudayal,S.Y.Chiam,M.H.Kumar,P.S.Bassi,H.L.Seng,J.Barber,and L.H.Wong,ACS Appl.Mater.Interfaces 6,5852(2014).
[19]T.Lindgren,H.L.Wang,N.Beermann,L.Vayssieres,A.Hagfeldt,and S.E.Lindquist,Solar Energy Mater.Solar Cells 71,231(2002).
[20]L.Vayssieres,N.Beermann,S.E.Lindquist,and A.Hagfeldt,Chem.Mater.13,233(2001).
[21]N.Beermann,L.Vayssieres,S.E.Lindquist,and A.Hagfeldt,J.Electrochem.Soc.147,2456(2000).
[22]K.Itoh and J.O’M.Bockris,J.Electrochem.Soc.131,1266(1984).
[23]A.Duret and M.Gr¨atzel,J.Phys.Chem.B 109,17184(2005).
[24]Y.J.Lin,Y.Xu,M.T.Mayer,Z.I.Simpson,G.McMahon,S.Zhou,and D.W.Wang,J.Am.Chem.Soc.134,5508(2012).
[25]A.Kay,I.Cesar,and M.Gr¨atzel,J.Am.Chem.Soc.128,15714(2006).
[26]A.W.Pu,J.J.Deng,M.Li,J.Gao,H.Zhang,Y.Y.Hao,J.Zhong,and X.H.Sun,J.Mater.Chem.A 2,2491(2014).
[27]A.Subramanian,A.Annamalai,H.H.Lee,S.H.Choi,J.Ryu,J.H.Park,and J.S.Jang,ACS Appl.Mater.Interfaces 8,19428(2016).
[28]H.K.Dunn,J.M.Feckl,A.Mller,D.Fattakhova-Rohlfing,S.G.Morehead,J.Roos,L.M.Peter,C.Scheu,and T.Bein,Phys.Chem.Chem.Phys.16,24610(2014).
[29]Y.S.Hu,A.Kleiman-Shwarsctein,A.J.Forman,D.Hazen,J.N.Park,and E.W.McFarland,Chem.Mater.20,3803(2008).
[30]H.J.Pan,X.Y.Meng,D.Y.Liu,S.Li,and G.W.Qin,Phys.Chem.Chem.Phys.17,22179(2015).
[31]J.Z.Su,J.Wang,C.Liu,B.Feng,Y.B.Chen,and L.J.Guo,RSC Adv.6,101745(2016).
[32]A.P.Singh,N.Saini,B.R.Mehta,G.Carraro,and D.Barreca,J.Nanosci.Nanotechnol.17,8959(2017).
[33]J.Liu,C.H.Liang,H.M.Zhang,Z.F.Tian,and S.Y.Zhang,J.Phys.Chem.C 116,4986(2012).
[34]A.Kaouk,T.P.Ruoko,M.Pyeon,Y.G¨on¨ull¨u,K.Kaunisto,H.Lemmetyinen,and S.Mathur,J.Phys.Chem.C 120,28345(2016).
[35]D.K.Zhong and D.R.Gamelin,J.Am.Chem.Soc.132,4202(2010).
[36]D.K.Zhong,M.Cornuz,K.Sivula,M.Gr¨aetzel,and D.R.Gamelin,Energy Environ.Sci.4,1759(2011).
[37]Y.Lee,J.Suntivich,K.J.May,E.E.Perry,and Y.Shao-Horn,J.Phys.Chem.Lett.3,399(2012).
[38]M.E.A.Warwick,D.Barreca,E.Bontempi,G.Carraro,A.Gasparotto,C.Maccato,K.Kaunisto,T.P.Ruoko,H.Lemmetyinen,C.Sada,Y.G¨on¨ull¨u,and S.Mathur,Phys.Chem.Chem.Phys.17,12899(2015).
[39]D.Barreca,G.Carraro,A.Gasparotto,C.Maccato,M.E.A.Warwick,K.Kaunisto,C.Sada,S.Turner,Y.G¨on¨ull¨u,T.P.Ruoko,L.Borgese,E.Bontempi,G.Van Tendeloo,H.Lemmetyinen,and S.Mathur,Adv.Mater.Interfaces 2,1500313(2015).
[40]A.Mettenb¨oerger,Y.G¨on¨ull¨u,T.Fischer,T.Heisig,A.Sasinska,C.Maccato,G.Carraro,C.Sada,D.Barreca,L.Mayrhofer,M.Moseler,A.Held,and S.Mathur,Nano Energy 19,415(2016).
[41]K.J.McDonald and K.S.Choi,Chem.Mater.23,4863(2011).
[42]Z.F.Hu,Z.R.Shen,and J.C.Yu,Chem.Mater.28,564(2016).
[43]B.Klahr,S.Gimenez,F.Fabregat-Santiago,T.Hamann,and J.Bisquert,J.Am.Chem.Soc.134,4294(2012).
[44]B.Iandolo and A.Hellman,Angew.Chem.Int.Ed.Engl.53,13404(2014).
[45]J.L.Xie,J.Chen,and C.M.Li,Int.J.Hydrogen Energy 42,7158(2017).
[46]K.Ulman,M.N.Nguyen,N.Seriani,and R.Gebauer,J.Chem.Phys.144,094701(2016).
[47]F.Le Formal,N.T´etreault,M.Cornuz,T.Moehl,M.Gr¨atzel,and K.Sivula,Chem.Sci.2,737(2011).
[48]H.J.Ahn,K.Y.Yoon,M.J.Kwak,and J.H.Jang,Angew.Chem.Int.Ed.Engl.55,9922(2016).
[49]A.Davants,D.Costa,B.Sallman,S.Rakshitt,G.Lefvre,J.Phys.Chem.C 121,324(2017).
[50]K.Liu,H.Y.Wang,Q.P.Wu,J.Zhao,Z.Sun,and S.Xue,J.Power Sources 283,381(2015).
[51]Z.H.Zhang,M.F.Hossain,and T.Takahashi,Appl.Catal.B:Environ.95,423(2010).
[52]O.Zandi,J.A.Beardslee,and T.Hamann,J.Phys.Chem.C 118,16494(2014).
[53]H.Dotan,K.Sivula,M.Gr¨atzel,A.Rothschild,and S.C.Warren,Energy Environ.Sci.4,958(2011).
[54]A.G.Tamirat,W.N.Su,A.A.Dubale,C.J.Pan,H.M.Chen,D.W.Ayele,J.F.Lee,and B.J.Hwang,J.Power Sources 287,119(2015).
[55]Z.B.Luo,C.C.Li,S.S.Liu,T.Wang,and J.L.Gong,Chem.Sci.8,91(2017).
[56]G.M.Carroll and D.R.Gamelin,J.Mater.Chem.A 4,2986(2016).
[57]B.Klahr,S.Gimenez,F.Fabregat-Santiago,J.Bisquert,and T.W.Hamann,J.Am.Chem.Soc.134,16693(2012).
[58]B.Klahr,S.Gimenez,F.Fabregat-Santiago,J.Bisquert,and T.W.Hamann,Energy Environ.Sci.5,7626(2012).
[59]S.Gota,E.Guiot,M.Henriot,and M.Gautier-Soyer,Phys.Rev.B 60,14387(1999).
[60]A.Kleiman-Shwarsctein,Y.S.Hu,A.J.Forman,G.D.Stucky,and E.W.McFarland,J.Phys.Chem.C 112,15900(2008).
[61]M.Anwar,C.A.Hogarth,and R.Bulpett,J.Mater.Sci.24,3087(1989).
[62]B.V.R.Chowdari,K.L.Tan,W.T.Chia,and R.Gopalakrishnan,J.Non-Cryst.Solids 119,95(1990).
[63]X.L.Guo,L.L.Wang,and Y.W.Tan,Nano Energy 16,320(2015).
[64]J.G.Choi and L.T.Thompson,Appl.Surf.Sci.93,143(1996).
[65]I.S.Cho,H.S.Han,M.Logar,J.Park,and X.L.Zheng,Adv.Energy Mater.6,1501840(2016).
杂志排行
CHINESE JOURNAL OF CHEMICAL PHYSICS的其它文章
- Imaging HNCO Photodissociation at 201 nm:State-to-State Correlations between CO(X1Σ+)and NH(a1∆)
- Energy-Transfer Processes of Xe(6p[1/2]0,6p[3/2]2,and 6p[5/2]2)Atoms under the Condition of Ultrahigh Pumped Power
- Ultrafast Investigation of Excited-State Dynamics in Trans-4-methoxyazobenzene Studied by Femtosecond Transient Absorption Spectroscopy
- Strong Current-Polarization and Negative Diflerential Resistance in FeN3-Embedded Armchair Graphene Nanoribbons
- Unexpected Chemistry from the Homogeneous Thermal Decomposition of Acetylene:An ab initio Study
- Direct Observation of Transition Metal Dichalcogenides in Liquid with Scanning Tunneling Microscopy