Critical velocities for local scour around twin piers in tandem *
2019-01-05QuanshuaiLiu刘全帅HongwuTang唐洪武HaoWang王浩JianfengXiao肖建峰
Quan-shuai Liu (刘全帅), Hong-wu Tang (唐洪武), Hao Wang (王浩), Jian-feng Xiao , (肖建峰)
1. State Key Laboratory of Hydrology-Water Resources and Hydraulic Engineering, Hohai University, Nanjing 210098, China
2. Huaihe River Commission of the Ministry of Water Resource, Bengbu 233001, China
Abstract: Experiments of the local scour around twin piers are carried out under steady clear-water conditions, including 95 tests to observe the influence of the pier spacing and the flow velocity on the local scour characteristics of the twin piers. It is shown that the start of the transition region is synchronous with the sediment transport from the upstream scour hole to the downstream one. The equations for the critical velocities are derived to quantify the velocity range of each of four different scour regions. Finally, a prediction formula of the downstream pier scour depth in the radical-deviation region is established.
Key words: Local scour, clear-water scour, twin piers, critical velocity, experiment
Introduction
With the increase of the traffic volume due to the economic development in many countries, more and more bridges were built across rivers and canals,which resulted in noticeable interactions among the water and the structures[1]. The scour mechanisms around bridges become much more complex because of the interactions, which can potentially cause damages to bridges. Therefore, the influence of the interactions among the bridges is an important issue for the river management.
Although the scour characteristics around a single pier were extensively studied experimentally and theoretically[2-11], the scour around a group of piers is still scarcely touched. A small number of studies provided some valuable information on the scour depth for different arrangements of a pier group[12-19]. However, two aspects deserve a further attention. First, the data on the scour depth are not comprehensive, as most experiments were carried out with a limited range of flow velocity. Second, the data available in these studies mainly focused on the relationship between the scour depth and the arrangement of piers, while the relationship between the scour depth and velocity for a specific pier arrangement was neglected. Furthermore, most of the studies did not include a systematic analysis of the scour characteristics of an individual pier in a pier group.Wang et al.[12]investigated the local scour around twin piers for different pier spacings using the cohesionless sediment. It was found that, the scour depth around the upstream pier was independent of the pier spacing and almost the same as that of a single pier. For the downstream pier, the development of the scour depth along with time could be divided into two stages. The first stage was similar to the early stage of the single pier scour under clear-water conditions, during which the scour depth increased rapidly. The second stage was similar to the live-bed scour of a single pier. The typical scour duration of the first stage was 5 h. As was observed in their experiments, with time progressing, the sediment from around the upstream pier formed a sand dune and moved towards the downstream pier scour hole and the scour depth evolution turned into the second stage. They also investigated the effect of the approach velocity on the scour depth with a fixed scour duration of 5 h for each pier spacing. The curve of the scour depth around the downstream pier versus the approach velocity was divided into four regions: the flat-bedform, the synchronous-scouring, the transition, and the radical-deviation regions (Fig. 8 in Wang et al.[12]).
Obviously, the mechanism of the local scour around the downstream pier is much more complex than that of the upstream pier, with the major features of the cumulative effect of twin piers on the local scour. The complexity of the local scour development is a reflection of the complexity of the flow characteristics, which provides the driving force for the scouring process. Therefore, it is necessary to investigate the scour and the flow characteristics synchronously during the scouring process instead of focusing traditionally only on the equilibrium state.
This study further investigates the local scour depth around the downstream pier during the first stage, based on the previous paper by Wang et al.[12].The data in this study are obtained with the following specific objectives: (1) to identify the characteristics of the four regions, (2) to quantify the critical velocities between contiguous regions to obtain the range of each region, and (3) to predict the scour depth in the radical-deviation region.
1. Experimental procedure
Laboratory experiments are carried out in a tilting, rectangular flume of 12.00 m long, 0.42 m wide, and 0.70 m deep, with glass sidewalls and a marble bottom (Fig. 1). Cylindrical piers with a diameter= 0.03m made of Perspex tubes are used in the experiments. 0.30 m long scale plates with 1 mm increment are attached to the piers to measure the scour depthsd. The sediment bed is 6 m long and 0.15 m thick, with the upstream pier located in the middle of the zone to ensure that the flow is fully developed in the working section, as shown in Fig. 1.The two piers are both vertically mounted in the sediment along the centerline of the flume. The spacing d between the piers is in the range from 0-15 times of the diameter of a single pier (Table 1).The tests are performed using the white quartz sand with a sediment density ρs=2 640 kg/m3. The sediment bed is uniform in the gradation and the geometric standard deviation of the sediment size is less than 1.2. The sand has a median diametergd of 0.70 mm, with the same features as in Wang et al.[12].
A total of 95 tests are conducted for the flow depth, h = 0.12 m , as shown in Table 1. Each test lasts for 5 h, the typical duration for the first stage in Wang et al.[12], so that the characteristics of the scour around the twin piers for different pier spacings are all in the first stage and comparable. At the end of each test, i.e., t = 5 h , the maximum scour depth dsis measured at the upstream of each pier with the attached scale plate, the same as that in Wang et al.[12],as shown in Table 1. The mean velocity U of the approach flow in front of the upstream pier is obtained by integral averaging of the vertical distribution law of the flow velocity, to be fitted with the measured velocity data. The experimental flow velocity distribution is measured using a three-dimensional acoustic Doppler velocimeter (ADV) with 200 Hz sampling frequency, at the location 1 m upstream of the upstream pier. A propeller current meter is applied to carry out the velocity measurement as the ADV has a measuring blind area about 0.05 m below the water surface.
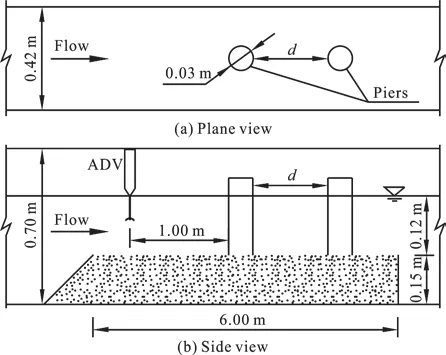
Fig. 1 Experiment flume and twin piers
The relation between the characteristics of the local scour around the downstream pier and the bed load transport is investigated. Four types of sediment transport intensities are defined: (1) the sediment trembling, without movement, (2) the movement of isolated particles, (3) the movement of some particles,and (4) the general surface movement[20]. The threshold selected for the inception of the sediment transport is between the types 2, 3[20], as described above. The flow discharge and the mean velocity are measured corresponding to the net sediment transport from upstream to downstream scour holes at =5 ht .
Although the duration of 5 h is not enough to obtain the scour equilibrium, the local scour characteristics around the twin piers are already shown to be more complicated than that of a single pier. On the other hand, it is found from the experimental results that the scour characteristics during the early stage could be described by some law.In view of the fact that the pier scour is a memorial process, i.e., the current state is affected by the prior state, the study of the scouring mechanism during the early stage is necessary for understanding the whole picture. Hence the primary objective of the study is not to obtain the maximum scour depth under the equilibrium conditions for the different spacings. Ins-tead, the main aim is to investigate the critical characteristics of the scouring process, specifically of the first stage, similar to the clear-water scour within 5 h,as proposed in Wang et al.[12]. Therefore, the test duration is set to 5 h.
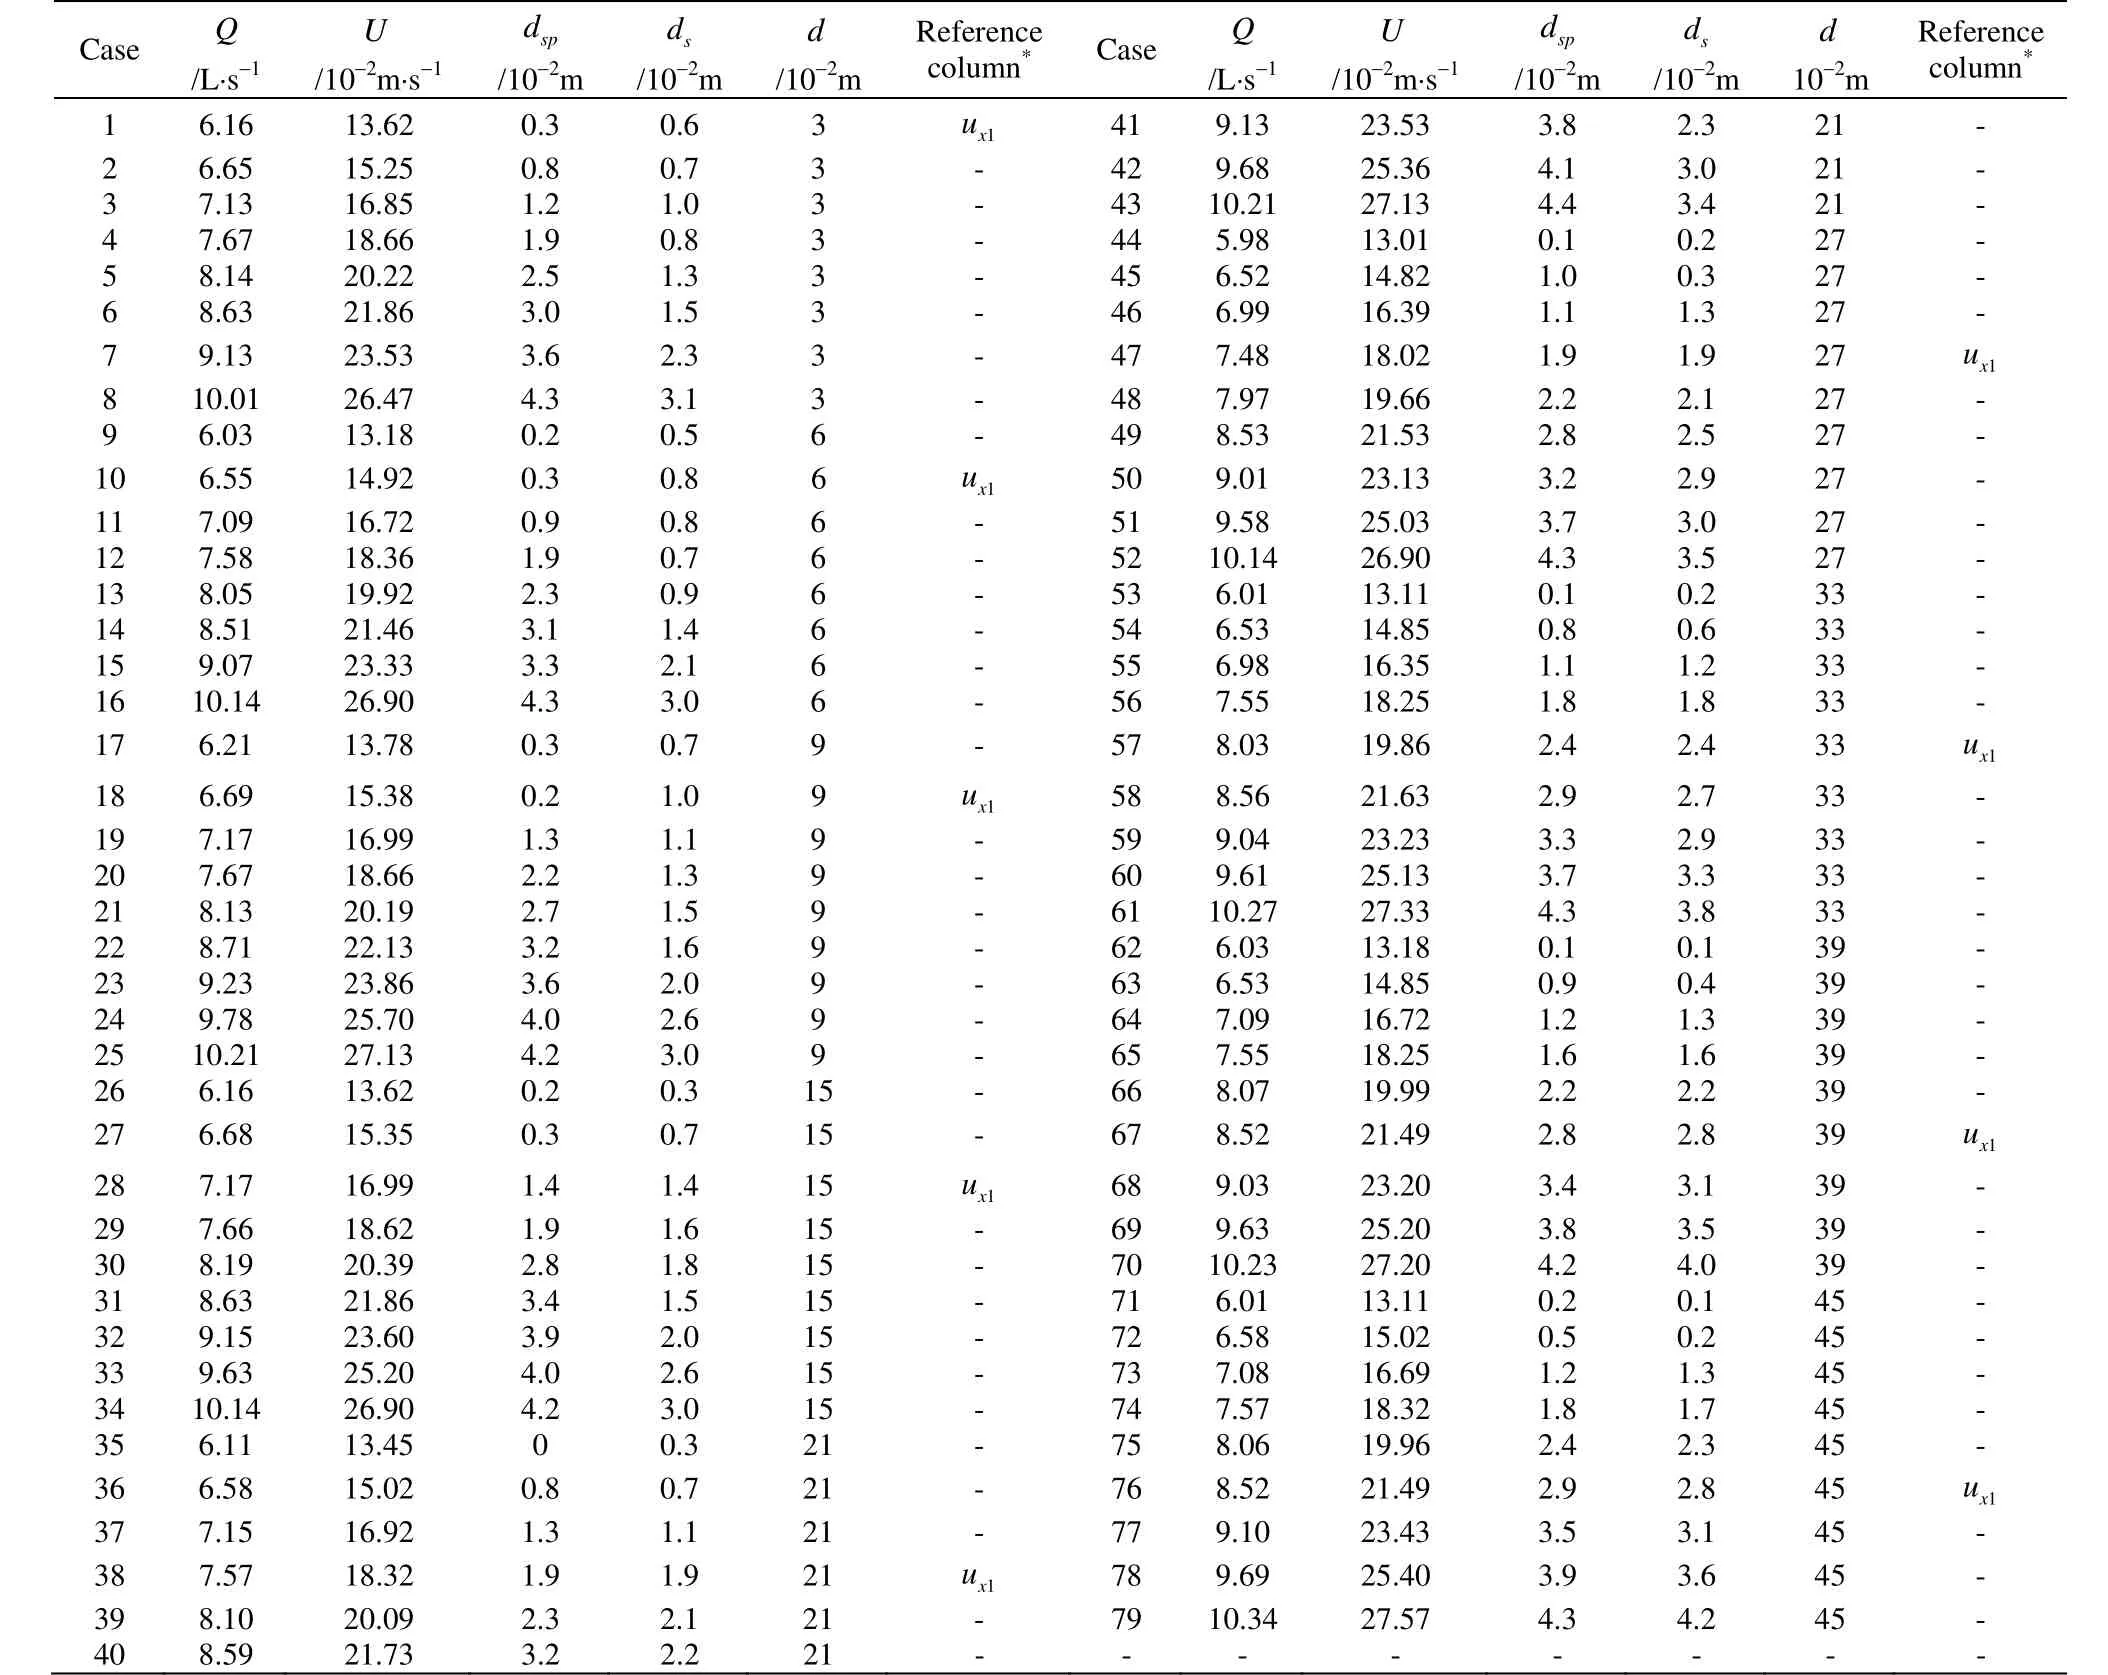
Table 1 Summary of experimental conditions
2. Results and discussions
2.1 Local scour characteristics of twin piers
Figure 2 shows that the scour characteristics, i.e.,the relationship between the 5 h scour dep th and the relative velocityaround the upstream pier, is primarily similar to those of a single pier and could be expressed as[12].
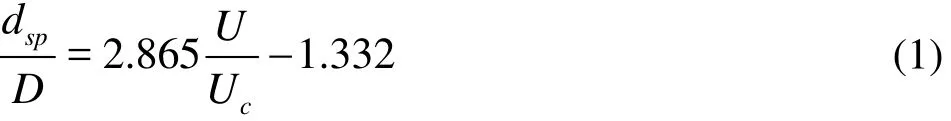
wherespd is the the scour depth around a single pier as well as the upstream pier since they are almost the same,cU is the the incipient motion velocity of the sediment calculated by the equation of Schamovis,which is suitable for the cohesionless sediment[21]
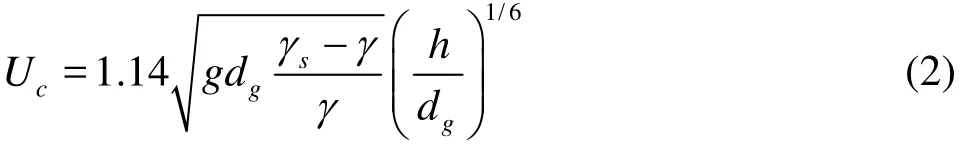
wheresγ is the specific gravity of the sediment, γ is the specific gravity of the water, and g is the acceleration of gravity.
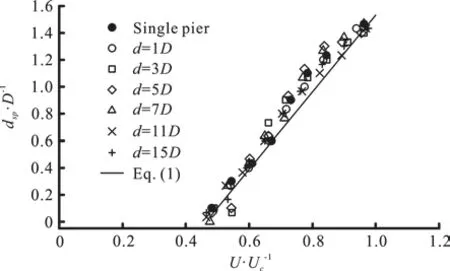
Fig. 2 Scour depths around the upstream pier for different pier spacings compared to that of a single pier
For the downstream pier, with the increase of the flow velocity, the scour depthfollows different laws in different velocity ranges, as shown in Figs. 3, 4, as quite different from that of a single pier.Thus, according to the approach velocity, the curve of the relative sour depthversus the relative approach velocityaround the downstream pier could be divided into four regions: the flatbedform region, the synchronous-scouring region, the transition region, and the radical-deviation region, the same as in Wang et al.[12], attributed to the interaction of the twin piers. The characteristics of each region are detailed as follows.
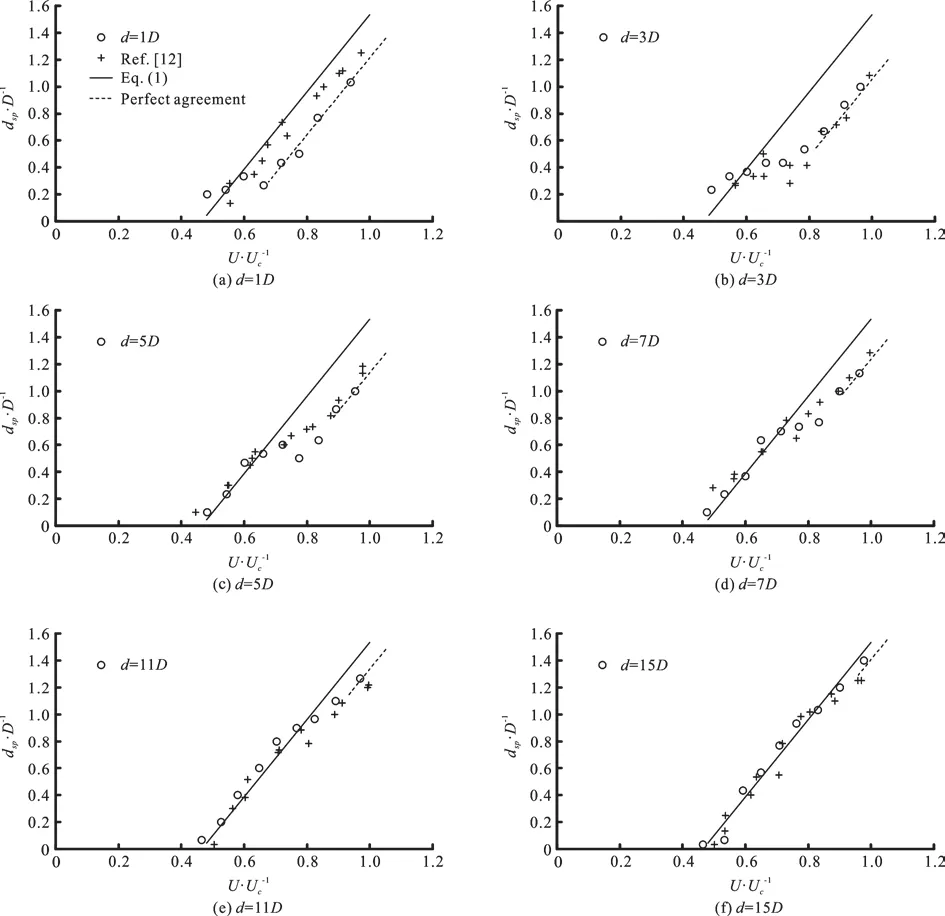
Fig. 3 Scour depths around the downstream pier (Experimental data are obtained at an interval of 5 h. Eq. (1) represents the scour depth around upstream pier which is similar to that of a single pier)
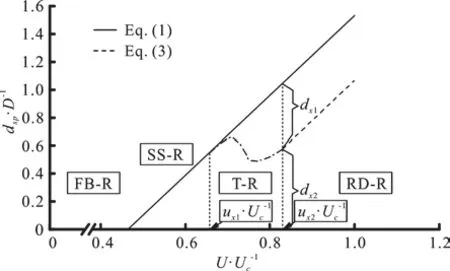
Fig. 4 Sketch of the four regions corresponding to specific spacing (FB-R, SS-R, T-R, RD-R represent the four regions)
In the flat-bedform region, the flow intensity is not high enough to activate the scouring process, and the scour depthsd remains to be 0. In the synchronous-scouring region, the scour depthssd around the two piers are both the same as that of a single pier. As shown in Fig. 3, the data with a scatter are in good agreement with Eq. (1)[12]within a certain velocity range for each pier spacing. The velocity range corresponding to different pier spacings is all around=0.465, while the end of the velocity range changes with the pier spacing. It indicates that the critical velocity between the synchronous-scouring region and the transition region might be a function of the pier spacing.

Fig. 5 (Color online) Influence of sidewall on sand dune generated by local scour around the upstream pier
As for the transition region, the scour depths around the downstream pier first decrease and then increase, with the increase of the approach velocity.Figure 3 shows that the data from Wang et al.[12]are not in a perfect agreement with those of this study in the transition region. This discrepancy might be caused by the contraction effects on the scour depth around the downstream pier, which may have effect for the ratio of the channel width to the pier diameter, in Wang et al.[12], while it is 14 in thecurrent study. Ballio et al.[22]found that, for a single pier, the contraction has effects on the scour depth only whenança et al.[23]observed that the. The scour depth around a single pier is caused by the downflow and horseshoe vortices.However, for the downstream pier, it is also influenced by the sediment transport and the sheltering effects from the upstream pier. As shown in Fig. 5, the scouring boundary has already reached the sidewall at the location about 9.5D downstream of the upstream pier. Therefore, a largermight be needed for calculating the local scour of twin piers to ignore the contraction effects, although the contraction has no effect for a single (or the upstream) pier forcontraction has no effects on the scour depth for
As for the radical-deviation region, the characteristics of the scour depth are regressed linearly again,as shown in Fig. 3, to be fitted with the dotted lines parallel with Eq. (1). The characteristics of this region can be expressed as
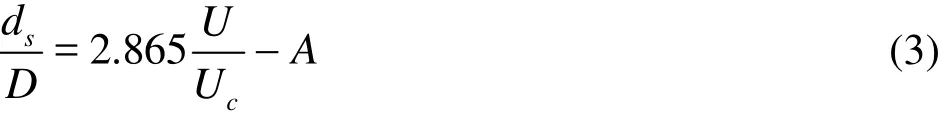
where A is a parameter depending on the twin pier spacing. The data from the current study are not in a perfect agreement with those from Wang et al.[12]in the radical-deviation region. However, the difference is not significant as compared with the transition region, as shown by the scatter data in Fig. 3, except for the spacing =1d D. This may be attributed to a more significant sediment transport effect caused by the smallerin Wang et al.[12].
Based on the above analysis, the cumulative effect of the twin piers on the local scour is mainly embodied in the complicated scour characteristics around the downstream pier, with the local scour around the upstream pier almost the same as that of a single pier. Therefore, the following discussion is mainly focused on the scour characteristics of the downstream pier, to find out the relationship between the critical velocities and the pier spacing. The discussions are mainly based on the experimental data in this study, with some reference to the data from Wang et al.[12].
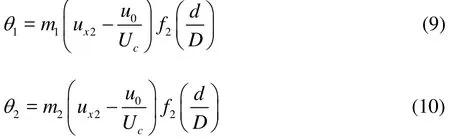
2.2 Critical velocity from synchronous-scouring re-gion to transition region
The critical velocity in the synchronous-scouring region and the transition region is the critical point which finalizes the former and activates the latter, and is defined as the “transition velocity1xu ”, as shown in Fig. 4. Theoretically, the scour depth around each of the twin piers corresponding to1xu should be the same. When the approach velocity increases slightly,the scour depth around the downstream pier becomes smaller than that around the upstream pier, with a typical experimental phenomenon that the net sediment moves from upstream to downstream scour holes.Therefore, this suggests that the start of the transition region is synchronous with the sediment transport from the upstream scour hole to the downstream one.
Based on the above definition and description,the “transition velocity” for each pier spacing is obtained from the following experimental procedure.For a certain pier spacing, each velocity listed in Table 1, from the minimum to the maximum, is tested for 5 h to observe the local scour bedform, and when the net bed load sediment transport from the upstream to downstream scour holes is firstly observed, the corresponding velocity is recorded as thefor this certain pier spacing. The transition velocities for different pier spacings are labeled in Table 1 in the reference column.
For a small pier spacing (2)dD≤, the scour depths around the downstream pier, corresponding to the experimental velocities, are greater than those around the upstream pier, as shown in Table 1. This suggests that, under small spacing conditions, the scour of the downstream pier occurs prior to that of the upstream pier, because of the more complex flow characteristics around the downstream pier, as observed during the experiments. This phenomenon is not in accordance with the definition of the “transition velocity”. However, when the approach velocity upstream of the upstream pier decreases marginally,there is no sediment movement into the scour hole around the downstream pier. Therefore, the experimental velocities obtained at a small pier spacing are essentially the “transition velocity”.
where1(/)f d D represents a function of the pier spacing.
Substituting the experimental data into Eq. (4), a new equation is obtained as follows
Equation (5) indicates a linear relationship betweenas shown in Fig. 6. When the pier spacing =0d , the scour depths around the upstream pier are almost the same as those around a single pier under corresponding flow conditions, as shown in Fig.4. When the scour first occurs at the pier spacingthe sediment moves past the downstream pier.Therefore, the transition velocityfor =0d is equal to the velocity at which the scouring first occurs around a single pier. So, the constant 0.465 in Eq. (5)is the relative velocity in Eq. (1) when the scour depth is 0. Equation (5) also indicates that a larger pier spacing needs a higher velocity for the scour to reach the transition region. When the spacing between the twin piers is large enough, the scour depth around the downstream pier will appear to be the same as that around the upstream pier under the same flow conditions. Thus, there should be a minimum pier spacing as a threshold, above which the transition velocityis equal to. Substitutinginto Eq. (5), gives a value of =22.3d D, which means under the condition ofthe downstream pier scouring would not develop into the transition region within 5 h at any approach velocity smaller than
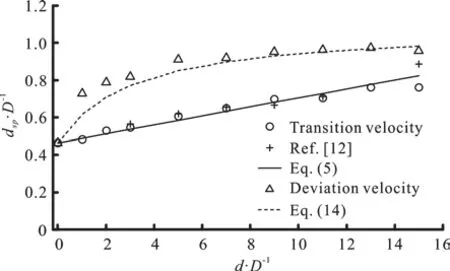
Fig. 6 Transition velocity 1xu and deviation velocity 2xu
2.3 Critical velocity from transition region to radical-deviation region
The critical velocity in the transition region and the radical-deviation region is the critical point which finalizes the former and activates the latter, here defined as the “deviation velocity2xu ”. It is fairly difficult to obtain2xu directly from experiments,hence we apply Eq. (3) to make a perfect fitting of the scatter data of the scour depth around the downstream pier in the deviation region, then estimate the value offrom the experimental velocities near the starting point of the perfect fitting curve based on the definition, as shown in Figs. 2, 3. Although this method is somehow subjective, it is an effective way to cope with this problem. The theoretical considerations of the deviation velocityare explained as follows.
The relative scour depth around a single piercorresponding to the velocitycould be considered to be composed of two parts


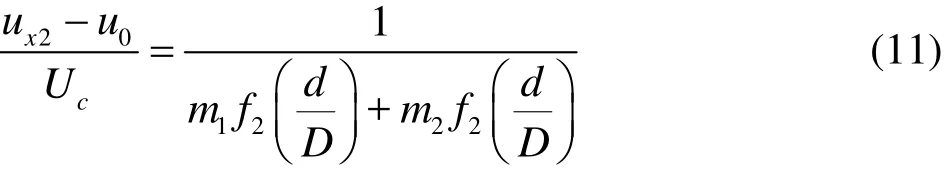
Substituting the estimated experimental data ofinto Eq. (11), a new equation is obtained as follows
The comparison between Eq. (13) and the experimental data is shown in Fig. 6. When =22.3d D in Eq. (13),, which indicates that the transition velocity1xu is equal to the deviation velocity2xu , and the scour characteristics of the downstream pier are the same as those of a single pier for any approach velocity smaller thancU within 5 h.
2.4 Scour depth around downstream pier in radical-deviation region
Although Eq. (3) is used to show the scouring characteristics in the radical-deviation region, the parameter A is also a function of the spacing. The form of A is identified with the following method.
Based on Eqs. (1), (3),1xd in Fig. 4 can be rewritten as

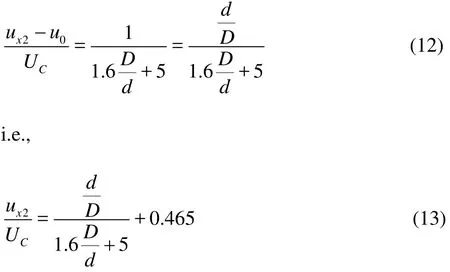
Experimental values of1(exp)xd are obtained also by making a “perfect fitting” of the experimental dataset with Eq. (3). And the value of1xd corresponds to the difference of the intercepts of the two parallel lines,as shown in Figs. 3, 4. Then based on Eqs. (7)-(12),the form o fcan be found as
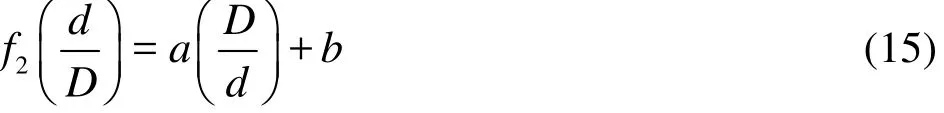
where a, b are constants.
Substituting Eqs. (8), (13), (15) into Eq. (9), the following expression is obtained
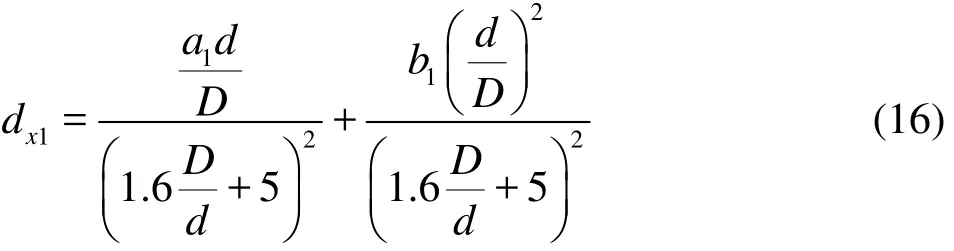
Substituting the experimental data1(exp)xd into Eq. (16),are obtained, andcould be expressed as follows
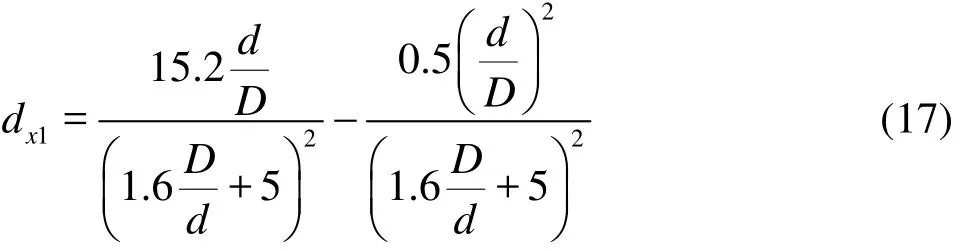
Figure 7 shows that the difference between the experimental1(exp)xd and the calculated1(cal)xd using Eq. (17) is within the 10%± error lines. Whenwhich is reasonable because the scouring characteristics of the downstream pier are the same as those of a single pier, corresponding to the spacing of 22.3≥dD within 5 h of scouring, i.e.,during the first scouring stage.
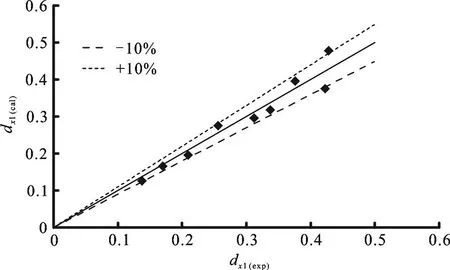
Fig. 7 Comparison of the experimental and calculated 1xd
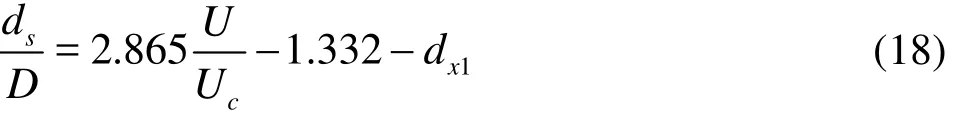
Based on the above analysis, the formation of the scour depths around the downstream pier in the radical-deviation region with different spacings can be expressed as
3. Conclusions
Experiments are carried out in an open channel flow to investigate the influence of the pier spacing and the flow velocity on the local scour characteristics of the two isolated piers. With the increase of the approach flow velocity, the scour depth around the upstream pier shows similar traits as that of a single pier despite of different pier spacings. For the downstream pier, the curve of the scour depth versus the approach velocity is divided by the critical velocities into four regions, which essentially constitutes the major features of the local scour of twin piers. The flat-bedform region ends at aboutregardless of the pier spacing. The transition region starts with the occurrence of the net sediment transport from the upstream scour hole to the downstream scour hole. Eqs. (5), (13) are established to indicate the transition velocityand the deviation velocity, respectively. With the three critical velocities, the range of each region is identified. When 22.3≥dD,the scouring characteristics of the downstream pier are the same as those of a single pier within the first scouring stage. Finally, Eq. (18) is derived to predict the downstream pier scour depth with different spacings in the radical-deviation region.
Since the scour depth in the transition region is too complex and clearly affected by the sediment transport, further studies are needed to assess the scour characteristics in the transition region. Besides,additional insights into the evolution characteristics of the 2-D profile and the 3-D surface of the local scour as well as the hydrodynamic characteristics around twin piers should also be searched in the future studies.
Acknowledgements
This work was supported by the Fundamental Research Funds for the Central Universities (Grant No.2017B12214), the Colleges and Universities in Jiangsu Province Plans to Graduate Research and Innovation (Grant No. KYZZ_0146), and the Project Funded by the Priority Academic Program Development of Jiangsu Higher Education Institutions(PAPD).
猜你喜欢
杂志排行

水动力学研究与进展 B辑的其它文章
- Call For Papers The 3rd International Symposium of Cavitation and Multiphase Flow
- An integral calculation approach for numerical simulation of cavitating flow around a marine propeller behind the ship hull *
- Numerical study on influence of structural vibration on cavitating flow around axisymmetric slender body *
- An integrated optimization design of a fishing ship hullform at different speeds *
- Dynamic analysis of wave slamming on plate with elastic support *
- Numerical investigations of the effects of blade shape on the flow characteristics in a stirred dead-end membrane bioreactor *