The effect of a curved bed on the discharge equation in a spillway with a breast wall*
2015-04-20NGUYENCongThanhWANGLingling王玲玲TANGHongwu唐洪武
NGUYEN Cong-Thanh, WANG Ling-ling (王玲玲), TANG Hong-wu (唐洪武)
State Key Laboratory of Hydrology-Water Resources and Hydraulic Engineering, College of Water Conservancy and Hydropower Engineering, Hohai University, Nanjing 210098, China, E-mail: thanhctt.dhxd@gmailcom
Introduction
Orifice spillways are widely used for controlling and measuring discharge in hydropower projects or irrigation systems[1]. The breast wall spillways, a type of orifice spillways, are often applied to release the flood and the sediment disposal in a reservoir[2]. The accurate estimation of the discharge capacity of breast wall spillways is very important from an operational,environmental and economic point of view in hydraulic engineering. The discharge capacity of orifice spillways could be obtained by using experimental, analytical[3]or numerical methods[4]. Ansar and Chen[5]used the dimensional analysis and the field flow measurements collected from 90 prototype gated spillways in South Florida, the Unite States, to obtain a single generalized equation under all flow conditions. However, this equation has a limitation that it can only be used for spillways with similar geometries, that is, the approaching and exiting channels. Ansar and Juan[6]also, based on the dimensional analysis, proposed a submerged vertical gated spillway and compared it with some existing ones. Bijankhan et al.[7], based on the Buckingham theorem and the incomplete self similarity (ISS), obtained a new stage-discharge relationship for the sluice gate with radial gates. In the case of the Ogee spillway with radial gates,Mazumdar and Indroniel[8]introduced a pressure correction factorCpas a function of both the head and the gated openings while showing a discrepancy between theoretical and experimental values of discharge. In these and other similar studies, the analytical method and the dimensional analysis were combined with the measured data to deduce a discharge prediction formula for the orifice spillways. However, the effect of the crest downstream profile on the variation of the mean pressure and the discharge capacity of theorifice spillway were not duly considered. In fact, the discharge capacity of the breast wall spillway depends on many factors, such as the water head, the orifice opening, the friction loss, and, especially, the mean vertical pressure distribution at the outlet section of the orifice opening[9].
The flow through the breast wall spillways is a rapidly varied flow and is influenced by centripetal or centrifugal force depending on the convex or concave nature of the bottom, which is normal to the direction of the flow. Moreover, the pressure changes rapidly with great pressure gradient from the beginning to the end of the curve[10]. Therefore, the mean pressure over the cross-section may be smaller or larger than the hydrostatic pressure. Its distribution is in a curve form that depends on the velocity, the curvature of the downstream profile, the flow depth, and the orifice opening, etc.. The effect of a curved bed on the mean pressure distribution over the cross-section was studied,such as by Dewals et al.[11], Castro-Oscar[12]and Anh and Hosoda[13]. Recently, Castro-Orgaz and Dey[14]obtained a generalized depth-averaged channel flow equation for an arbitrary curved bed and an equation for the pressure distribution in they-direction normal to the channel bed in an one-dimensional problem.However, these equations are very difficult to solve without further hypotheses. As a result, these equations may only be applicable for the gradually varied unsteady and the steady flows or for constant slope channels. On the other hand, the flow through the spillway with a breast wall experiences an abrupt transition from the subcritical upstream to the supercritical downstream of the breast wall, which indicates that there might be an unsatisfactory mean vertical pressure distribution if the above theories are applied.
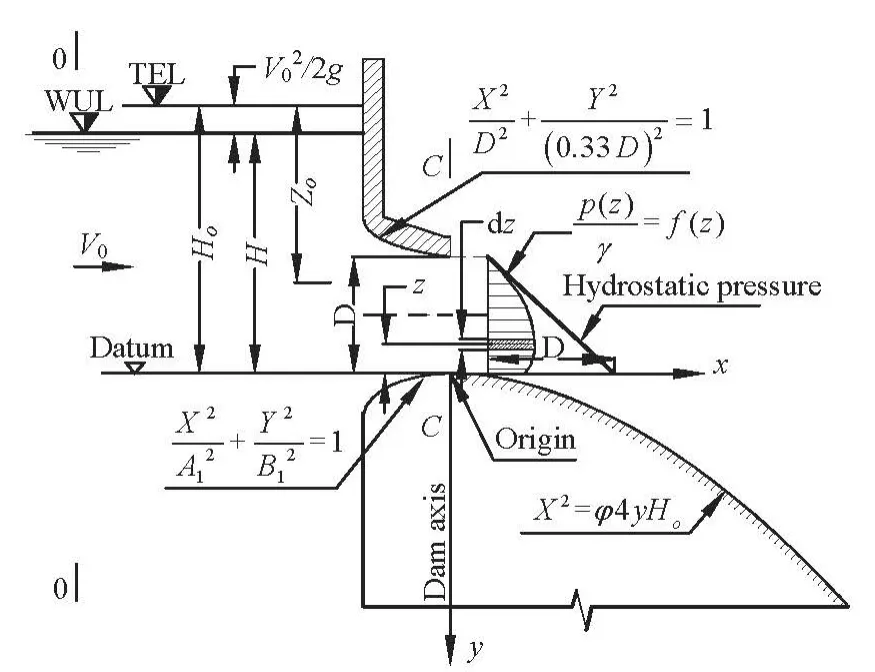
Fig.1 The scheme to determine the discharge capacity and the mean pressure distribution at the outlet section of the free breast wall spillway
Although the discharge capacity of orifice spillways has been widely studied, experimentally, theoretically and numerically, the flow through spillways with a breast wall has not received enough attention.As mentioned previously, there are abundant discharge calculations while there are few studies of the deviation of the mean pressure from the hydrostatic pressure and its influence on the discharge capacity of orifice spillways. This paper studies the effect of a convex crest profile on the mean pressure distribution,especially, the deviation of the mean hydrodynamic pressure from the hydrostatic pressure, and applies these results to the discharge calculation of the breast wall spillways by conducting experiments. Based on the measured data, the multi linear regression and the least squares method are applied to obtain a discharge prediction formula for the flow in this field.
1. General discharge capacity prediction formula of the spillway with a breast wall
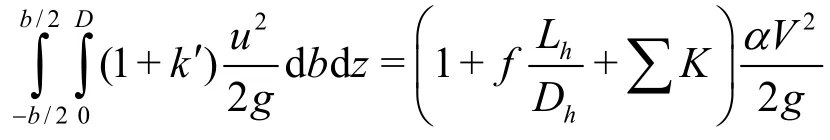
The computational scheme for a spillway with a breast wall is shown in Fig.1. The datum is set equal to the crest elevation. According to White[15], the incompressible steady-flow energy equation, with no shaft work and negligible viscous work, including the friction loss between sections 0-0 and C-C for the streamline dz, is as follows

in which,Hois the total head,zis the elevation above the datum plane (upward from the origin of the spillway),pis the mean static pressure value at the elevationz(at the cross-section C-C),gis the gravitational acceleration,γis the specific weight of the water,LhandDhare the length and the hydraulic diameter of the orifice openingD, respectively,k′ is the total head loss coefficient between two sections,bis the average width at the section C-C. The other symbols are shown in Fig.1. Integrating Eq.(1) over the section C-C with the assumption that
the total headHois obtained as

where ∑Kis the total minor head loss coefficient andfis the Darcy friction factor between two sections.αis the kinetic energy correction. According to Eq.(2), we have
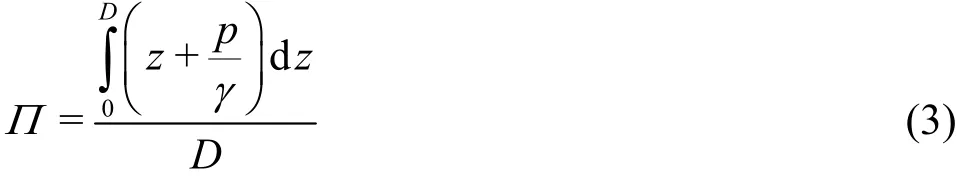

in which,∏andZo=Ho-∏denote the average potential energy at the outlet section C-C and the water head effect of the orifice flow, respectively. The discharge coefficientCodis determined by

The general discharge capacity of a spillway with a breast wall,Q, is determined by
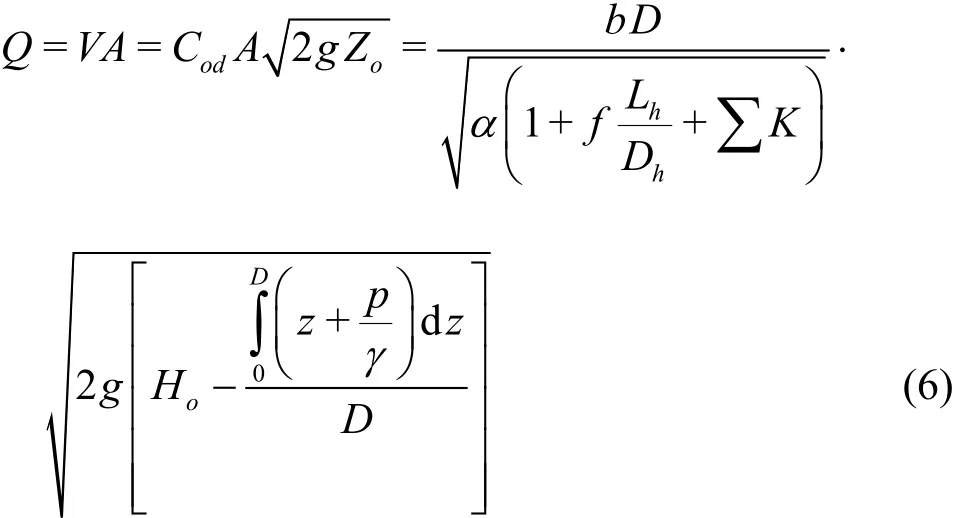
whereA=bDis the area of the orifice corresponding to the orifice openingD. According to Eq.(6), the discharge coefficientCodand the mean pressure distribution over the cross-section C-C must be known before the discharge capacity of the spillway with a breast wall can be calculated. In an actual case, based on some hydraulic and geometric considerations of the spillways, the value of ∑Kandfcould be determined[15]. Therefore, only the mean pressure distributionp(z)/γover the cross-section C-C needs to be found. In other word, thep(z)/γvalue plays an important role in the discharge calculation of the flow in this field. This distribution affects considerably the accuracy of the discharge calculation according to Eq.(6). This study considers the flow through the spillway with a breast wall with the convex bottom profile in a parabolic profile. The mean pressure distributionp(z)/γis obtained from an experiment in a laboratory flume.
2. Experiment setup and procedure
2.1 Experiment setup
The experiments are conducted in the Hydraulic Structures Laboratory at the National University of Civil Engineering (NUCE), Hanoi, Vietnam. Figure 2 shows the experimental scheme and the spillway model in this study. It consists of a flume, several pumps, a large feeding tank, a model of the breast wall spillway, and a flow circulating system. A series of experiments are conducted in a steel frame flume with two transparent Plexiglas sides, 0.4 m wide, 6 m long and 0.8 m deep. The bottom of the flume is made of stainless steel with a horizontal slope. The breast wall spillway models of Plexiglas of different dimensions are installed and placed at the position of 3 m from the beginning of the stilling tank in the flume.The upstream edge of the breast wall is in line with the upstream edge of the spillway and the downstream edge is in line with the spillway crest axis, as shown in Fig.1.
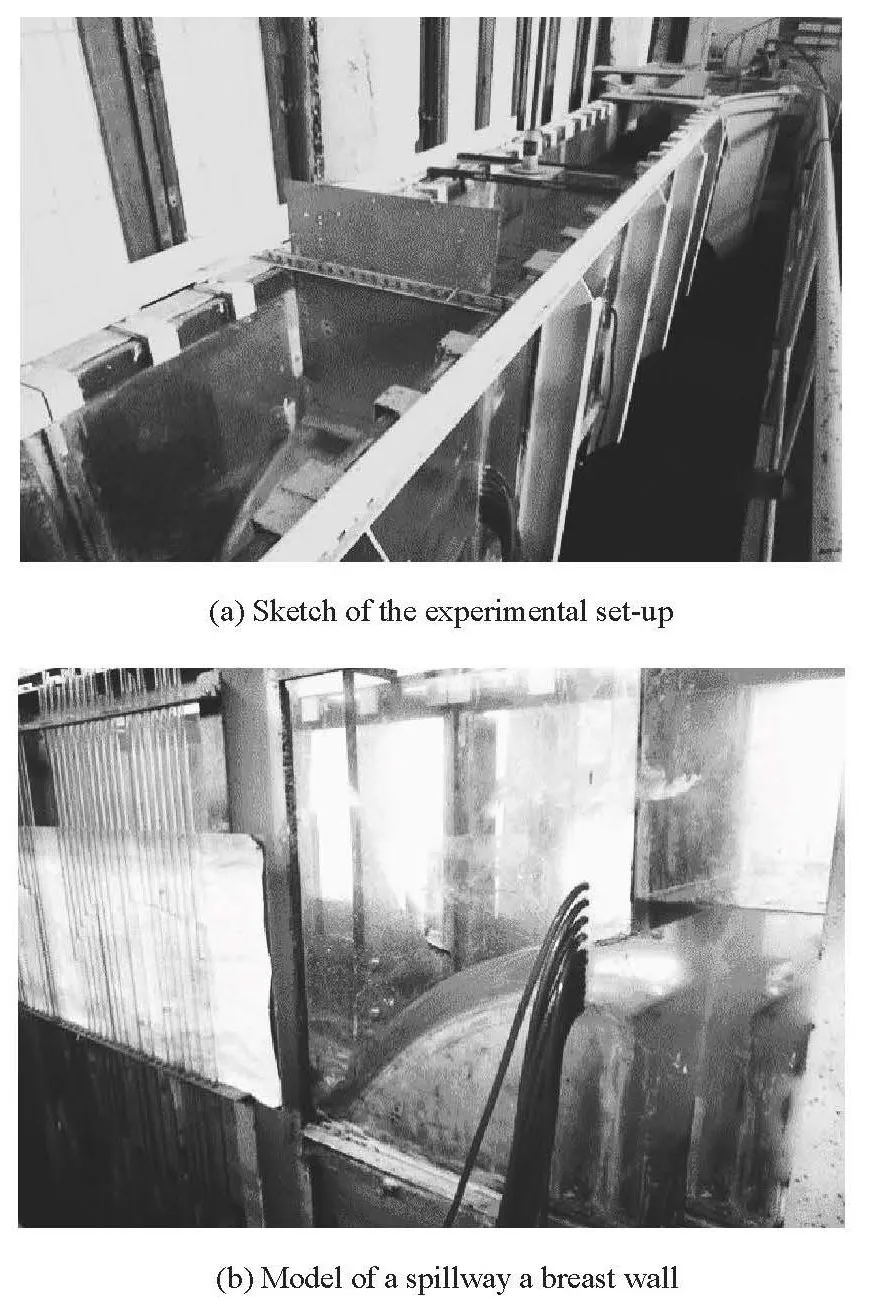
Fig.2 The experimental hydraulic model scheme
The water is pumped from the underground tank to the feeding tank, which supplies the water for the stilling tank, a part of the flume connected by an adjusting valve. The water is fed into the flume from the feeding tank through 0.25 m-diameter pipelines to guarantee that the water level is stable during the ex-periment in the stilling tank. The water surface profile from the upstream to the downstream is measured at the centerline of the flume with a point gauge of an accuracy of ±0 .0001m . Furthermore, the upstream water level of the model is measured at the position 1.5 m from the origin of the spillway toward the upstream. Consequently, the measured water surface is relatively steady during the experiment in the specific cases. The crest pressure and the vertical pressure distribution at the cross-section C-C behind the breast wall are measured by several static tubes, connected to a piezometer board with glass tubes vented to the atmosphere. The piezometer board readings give the average pressures at each pressure tap location. The measurements on this board are within ±0.001m precision. The discharge into the flume is also measured by a rectangular sharp-crested weir located in the gathering tank. The relative uncertainty in the measured discharge is 3%.
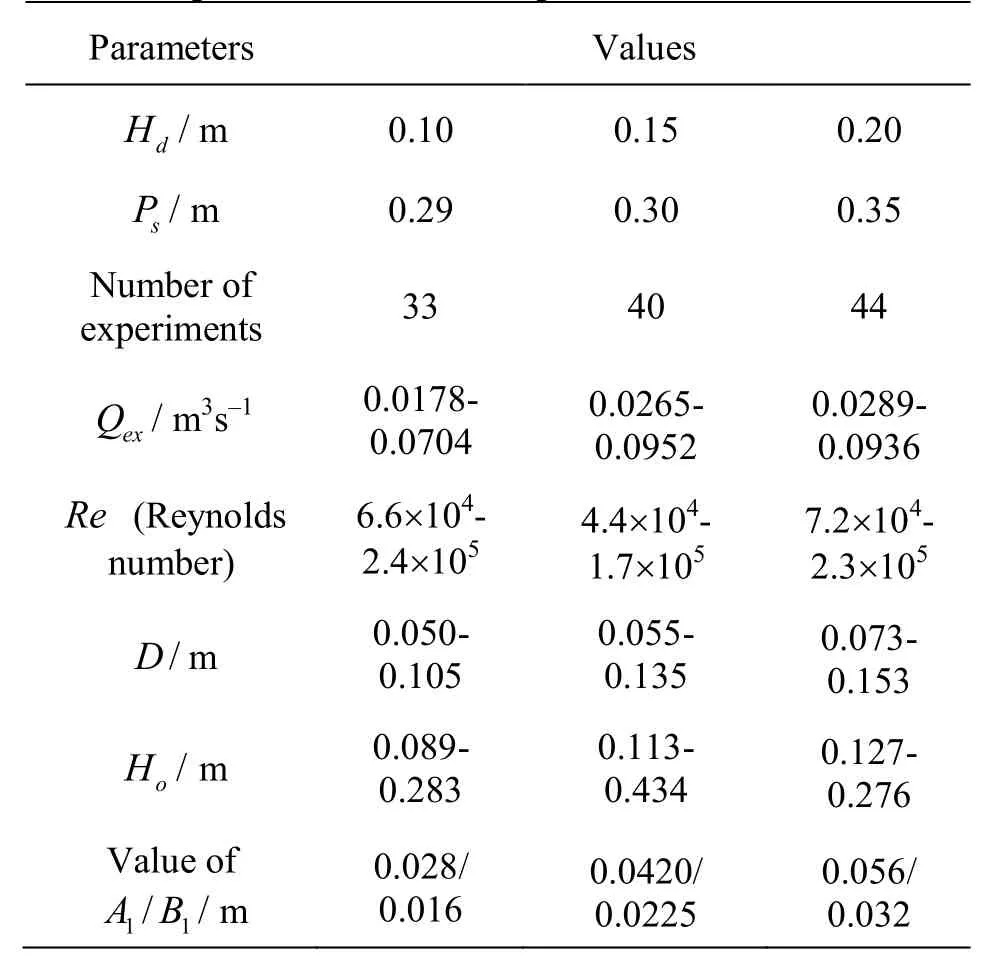
Table 1 Experimental cases and parameters
2.2 Experimental cases
Table 1 lists the experimental cases and the fundamental geometric parameters of the spillway with a breast wall models. The spillway models are designed with three design heads (Hd), namely, 0.15 m, 0.2 m,and 0.25 m and with 0.3 m, 0.29 m and 0.35 m in height (Ps), respectively. The spillway’s upstream quadrant profile is in a shape of ellipse, which is similar to the Ogee profile of the free overflow spillway.Namely, the upstream quadrant profile is designed by an equationin this study. The downstream profile of the spillway is fabricated according to a parabolic equationwithφ=0.9. In addition, the breast wall profile is determined by the following equation.The experiments are performed for variations of the water headH, and the orifice openingDfor three spillway models. The measured parameters include the water surface profile, the mean vertical pressure distribution p(zi)at the outlet cross-section C-C andithe dischargeQex.

Fig.3 The vertical pressure distribution at section C-C in some experimental cases
3. Results and discussions
3.1 Mean vertical pressure distribution at section C-C
During the experiment, the mean vertical pressure distribution at the section C-C (see Fig.1) is measured in each specific case. Figure 3 shows the distribu-tion ofp(z) in some cases. They-axis is the water height upward from the origin of the spillway. As shown in Fig.3, the value ofp(z) depends on the parameters, such as the orifice openingD, the dischargeQand the total headHo. Furthermore, this distribu
extion could be characterized by the value of the Froude number (, whereVis the average velocity at the section C-C) at the orifice opening. This distribution has a tendency to decrease as theFrnumber of the orifice flow increases. According to Fig.3, the mean pressure at each point in the flow depth is considerably smaller than the hydrostatic pressure (p(z)i/γ<zi). This is consistent with the conclusions of Dewals et al.[11]and Chaudhry for the influence of the centripetal force on the mean vertical pressure in the convex flow. However, their result is valid only for the free and gradually varied flow. Here,the flow is a rapidly varied flow, and one sees a dramatic transition from the subcritical to supercritical states as the flow goes through under the breast wall.Therefore, this mean pressure distributionp(z) may be different from the others.
3.2 Prediction of the water head effect Zo of the flow through breast wall spillway
According to Eq.(4), the value of the water head effectZomust be calculated from the average potential energy∏, but this value depends on the integral. Thus, the value ofZois not a fixed value in each specific case. This means that the accurate calculation ofZoplays an important role in the estimation of the discharge capacity for the flow in this study. To calculate the integralin Eq.(3), the mean pressure distribution is assumed as a third order polynomial function for all experimental cases. As a result, this integral can be evaluated, and the value of∏can be calculated by using Eq.(3) in specific cases. Then, the value ofZois also computed asZo=Ho-∏. It is found that the value of the calculated water head effectZodepends on some geometrical parameters, such asHd,D,sP, the downstream profileΦ(x) and the total headHo. Generally, this relationship can be expressed as

Based on the dimensional analysis[16], Eq.(7) can be written as
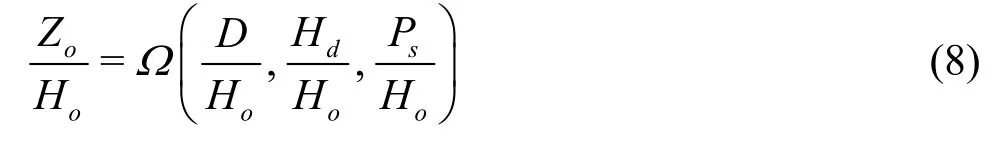
To find this relationship, the multiple linear regression method is applied to correlate the ratio ofto both the hydraulic and geometrical parameters. The general equation can be written as
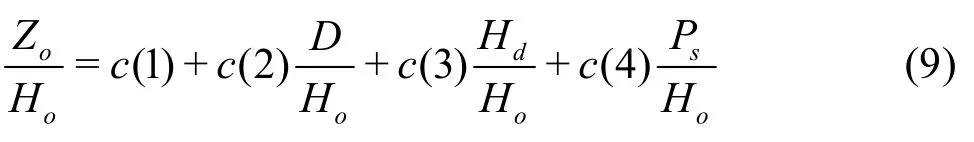
in which,c(1)-c(4) are the unknown coefficients of the regression analysis. These coefficients reflect the influence of the dimensionless quantities, such asandon thevalue and can be found by using the experimental data. Based on the least squares method, these unknown coefficients are determined, and a formula for the determination ofis obtained. This equation fits the experime-ntal data with a correlation coefficient,R2=0.98 and the standard error of estimation SEE=0.0168. This result shows that all unknown coefficients are statistically meaningful with the confidence level of 95%.Equation (9) is rewritten again as

Equation (10) indicates that the contribution ofD/HoinZo/Hois the most significant, whereas the contributions ofHd/HoandP/Hoare smaller. To evaluate the best-fit line and its ability, in terms of the agreement between the experimental data and the prediction values ofZo, an average percentage error term,zε, proposed in Ref.[17], is defined as
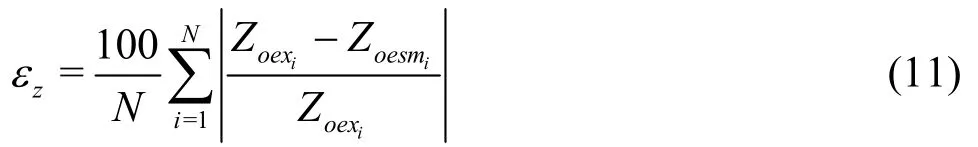
in which,Nis the number of data points,ZoexiandZoesmiare the experimental and estimated values of the water head effectZo, respectively. According to Haddadi and Rahimpour[17], the lower thezεvalue,the greater the accuracy of Eq.(10) and vice versa. The calculated value ofzεis 2.24% for the estimation ofZoin this study. This error is acceptable in hydraulic engineering. Furthermore, a comparison ofZobe-tween Eq.(10) and the experiment is shown in Fig.4,which shows a good agreement (R2=0.998) between the experimental and estimatedZovalues, whereZoOis mean the experimental value,ZoPis mean the computed value. In short, Eq.(10) could be used to estimate the value ofZowithin ±5% in the ranges 0.18≤D/Ho≤ 0.68, 0.35 ≤Hd/Ho≤ 1.57, and 0.69 ≤Ps/Ho≤ 3.27.
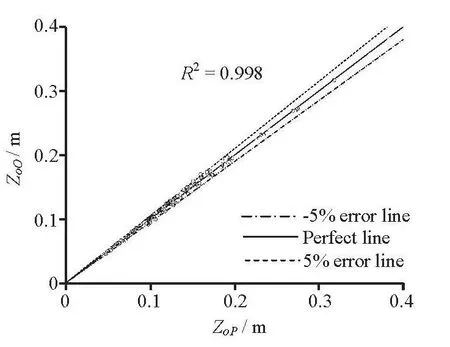
Fig.4 Experimental versus predicted Zo values using Eq.(10)
3.3 Proposal of the discharge formula and water head effect coefficient
According to Eq.(10), the discharge formula(Eq.(6)) could be rewritten as follows

Alternatively, aCZfactor, called the water head effect coefficient, can be defined as
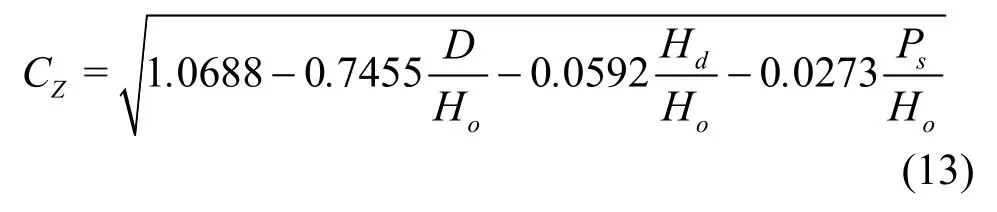
Hence, the discharge formula (12) becomes

The proposed discharge formula (Eq.(14)) is in a familiar form in calculating the discharge capacity of the orifice spillway, except the coefficientCZ. This factor depends on some hydraulic and geometric parameters of the spillway and reflects the influence of the mean vertical pressure variation at the outlet crosssection C-C on the value of the water head effector the discharge capacity.
3.4 Validation of the proposed discharge formula
Before using the proposed discharge formula to calculate the estimated discharge, the value ofCodneeds to be determined for all cases. Based on the geometrical spillway models, theCodvalue is found in a range of 0.912-0.913 with known parameters,such asand=0.08 (whereis the relative roughness). In short, the value ofcould be taken in average as 0.913 for the discharge calculation in all cases.
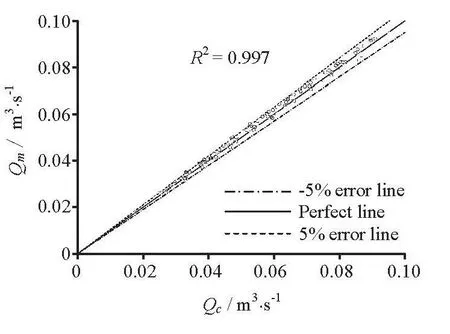
Fig.5 Measured versus computed discharges using Eq.(14)
The estimated dischargeQeand the average percentage error termεQeare calculated by using Eq.(14)and Eq.(11), respectively. The value ofεQeis 2.26%for the measured dischargeQexfor all experimental cases. Figure 5 shows a close correlation (R2=0.997)between the measured and estimated discharge values,and the computed discharge is within ±5% of the measure one, whereQmis mean the measured value,Qcis mean the computed value. This means that the proposed discharge formula predicts quite accurately the discharge capacity of the flow in this study. However, the mean pressure distributionp(z) must be determined before the calculation as shown in the previous subsection. On the other hand, some assumptions are often made to simplify the discharge calculation for the flow in this field. By assuming the mean pressurep(zi)=0 over section C-C or the mean pressure distributionp(z) in the hydrostatic pressure law,the discharge formula (Eq.(6)) could be rewritten, respectively, as follows:
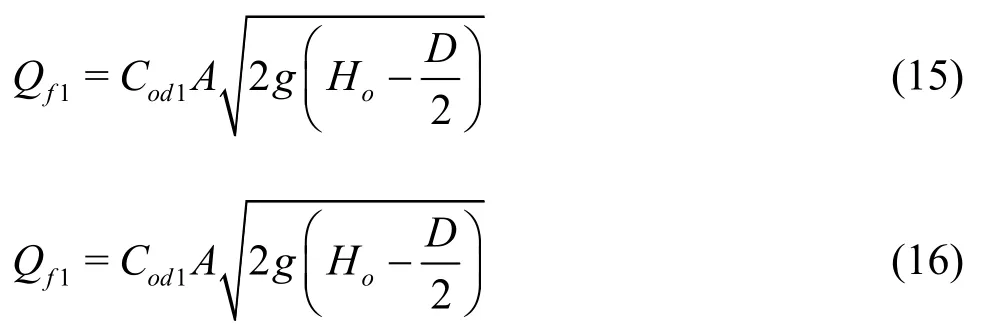
whereCod1andCod2are the discharge coefficientsfor Eq.(15) and Eq.(16), respectively. These values could be obtained using a calibration method. The value ofCod1is in a range of 0.6-0.8 and depends onH0/D[18], and the value ofCod2could be assumed to be equal to the value ofCod.
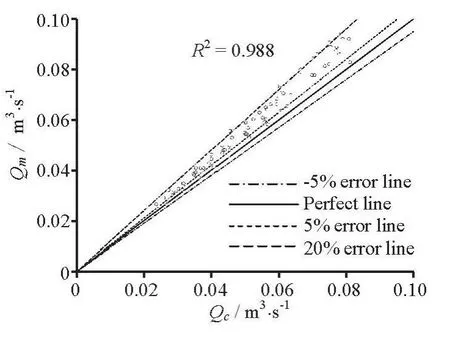
Fig.6 Measured versus computed discharges using Eq.(15)
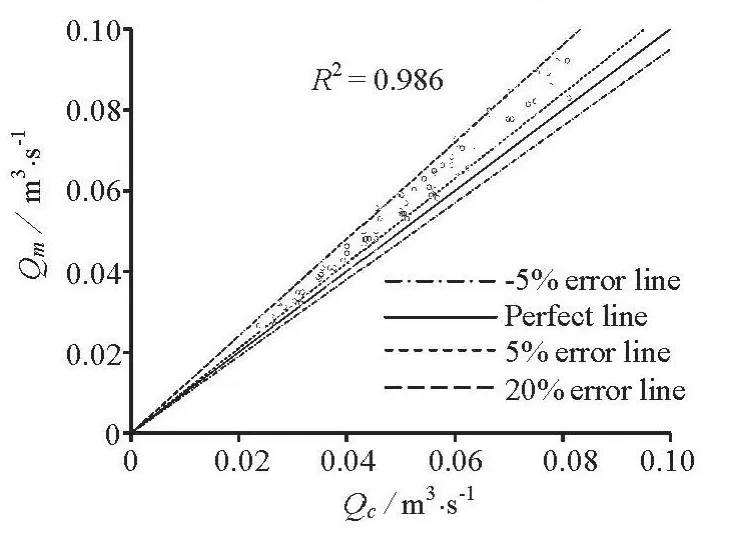
Fig.7 Measured versus computed discharges using Eq.(16)
Figure 6 and Fig.7 show a deviation between Eq.(15) and Eq.(16) in comparison with the measured data, withR2f1=0.988andR2f2=0.986, the average percentage errorsεQf1=9.72%andεQf2=10.33%,respectively. Moreover, the computed discharge is within ±5 %-20% of the measure ones. Obviously,the big error (20% or even more) in the discharge calculation comes from the above assumptions. On the other hand, the application of the mean pressure variation at the outlet section leads to a more accurate discharge than the others as shown in Fig.5.
4. Summary and conclusion
The effect of the mean vertical pressure variation at the outlet section on the discharge capacity of a spillway with a breast wall is studied by experiments in this paper The mean pressure distribution is affected by some hydraulic parameters, such as the total headHo, the orifice openingD, the crest downstream profile. This distribution in turn affects the determination of the water head effectZoor the discharge capacity according to Eq.(6). Based on experimental data, a relationship betweenZo/Hoand the above quantities is established by using the multiple linear regression analysis and the least squares method, and a discharge formula is proposed. With the proposed discharge formula, accurate results (with errors within±5 %) can be obtained with the mean pressure distribution being applied in the determination of theZovalue. Otherwise, with the assumption of the mean pressurep(zi)=0 over the section C-C or the mean pressure in the hydrostatic pressure law, the big error(20% or even more) is obtained in comparison with the experimental data. In short, the proposed discharge formula is more accurate than the others under the conditions of this study. On the other hand, more work should be done under a wider range of hydraulic conditions in future.
[1] WU Jian-hua, FENG Shu-rong and WU Wei-wei et al.Hydraulic characteristics of partial opening of the working gate for a discharge tunnel[J]. Journal of Hydrodynamics, 2007, 19(4): 488-493.
[2] KHATSURIA R. M. Hydraulica of Spillways and Energy dissipators[M], New York, USA: Marcel Dekker, 2005.
[3] JAVAN M., and SHAHROKHNIA M. A. Dimensionless Stage–Discharge relationship in radial gates[J].Journal of Irrigation and Drainage Engineering,2006, 132(2): 180-184.
[4] BHAJANTRI M. R., ELDHO T. I. and DEOLAKIKAR P. B. Numerical investigation of the effects of sluice spillway roof profiles on the hydraulic characteristics[J].International Journal for Numerical Methods in Fluids, 2008, 57(7): 839-859.
[5] ANSAR M., CHEN Z. Generalized flow rating equations at prototype gated spillways[J]. Journal of Hydraulic Engineering, ASCE, 2009, 135(7): 602-608.
[6] ANSAR M., JUAN A G. C. Submeged weir flow at prototype gate spillway[C]. World Water and Environmental Resources Congress. Philadelphia, USA,2003.
[7] BIJANKHAN M., FERRO V. and KOUCHAKZADEH S. New stage-discharge relationships for radial gates[J].Journal of Irrigation and Drainage Engineering,2012, 139(5): 378-387.
[8] MAZUMDAR S. K., INDRONIEL D. R. Orifice flow in a gated spillway[J]. ISH Journal of Hydraulic Engineering, 1997, 3(2): 44-52.
[9] NGUYEN Cong-Thanh, HUYNH Ba Ky Thuat. The water haed effect of undersluices as the shape of outlet is curved[J]. Viet Nam Science and Technology Journal of Agricultural and Rural Development,2012, 9(3): 30-34.
[10] LIU Zhi-ping, ZHANG Dong and ZHANG Hong-Wei et al. Hydraulic characteristics of converse curvature section and aerator in high-head and large discharge spillway tunnel[J]. Science China Technological Sciences,2011, 54(Suppl. 1): 33-39.
[11] DEWALS B. J., ERPICIM S. and AECHAMBEAU P.et al. Depth-integrated flow modelling taking into account bottom curvature[J]. Journal of Hydraulic Research, 2006, 44(6): 785-795.
[12] CASTRO-ORGAZ O. Approximate modelling of 2D curvilinear open channel flows[J]. Journal of Hydraulic Research, 2010, 48(2): 213-224.
[13] ANH T., HOSODA T. Depth-averaged model of openchannel flows over an arbitrary 3d surface and its applications to analysis of water surface profile[J]. Journal of Hydraulic Engineering, ASCE, 2007, 133(4): 350-360.
[14] CASTRO-ORGAZ O., DEY S. One-dimensional channel flow equations with curvature revisited[J]. Journal of Hydraulic Research, 2009, 47(2): 157-166.
[15] WHITE F. M. Fluid mechanics[M]. 4th edition, New York: McGraw-Hill, 2003.
[16] WU Jian-hua, CAI Chang-guang and JI Wei et al. Hydraulic characteristics of water-wings for the middlepier of a discharge tunnel[J]. Journal of Hydrodynamics, 2006, 18(5): 567-571.
[17] HADDADI H., RAHIMPOUR M. A discharge coefficient for a trapezoidal broad-crested side weir in subcritical flow[J]. Flow Measurement and Instrumentation, 2012, 26: 63-67.
[18] HUSSAIN S., HUSSAIN A. and AHMAD Z. Discharge characteristics of orifice spillway under oblique approach flow[J]. Flow Measurement and Instrumentation,2014, 39: 9-18.
杂志排行

水动力学研究与进展 B辑的其它文章
- A general framework for verification and validation of large eddy simulations*
- Direct calculation method of roll damping based on three-dimensional CFD approach*
- Visualization study on fluid distribution and end effects in core flow experiments with low-field mri method*
- Large-eddy simulation of the flow past both finite and infinite circular cylinders at Re =3900*
- Safe operation of inverted siphon during ice period*
- Flow field simulation of supercritical carbon dioxide jet: Comparison and sensitivity analysis*