Experimental investigation of flow past a circular cylinder with hydrophobic coating *
2019-01-05JunWen文俊HaibaoHu胡海豹ZhuangzhuLuo罗莊竹ZhaozhuZhang张招柱
Jun Wen (文俊), Hai-bao Hu (胡海豹), Zhuang-zhu Luo (罗莊竹), Zhao-zhu Zhang (张招柱)
1. School of Marine Science and Technology, Northwestern Polytechnical University, Xi'an 710072, China
2. Chongqing Institute of Green and Intelligent Technology, Chinese Academy of Sciences, Chongqing 400714,China
3. State Key Laboratory of Solid Lubrication, Lanzhou Institute of Chemical Physics, Chinese Academy of Sciences, Lanzhou 730000, China
Abstract: A series of experiments are performed in a gravitational low-speed water tunnel to investigate the influence of the hydrophobic coating on the flow past a circular cylinder. The mean velocity and turbulence intensity profiles behind the cylinders are measured using the hot-film anemometer while the separation angles are obtained with the flow visualization technology. For the Reynolds number lower than 3 800, the hydrophobic coatings are in the Cassie state, the velocity deficit and the turbulence intensity in the wake of the hydrophobic cylinders are lower than those of the smooth cylinders which implies the drag reduction effect of the hydrophobic coatings. When the Reynolds number becomes higher than 6 600, the hydrophobic coatings turn into the Wenzel state.Through decomposing the velocity data in the turbulent wake into different scales based on the orthogonal wavelet transform, it is found that the total turbulence intensity in the wake of the hydrophobic cylinders becomes almost the same as in the wake of the smooth cylinders while the intensity of the large scales of vortex components in the wake of the hydrophobic cylinders is still lower.Furthermore, the separation angles show the same trend as a function of the Reynolds number but always take smaller values for the hydrophobic cylinders.
Key words: Hydrophobic coating, drag reduction, vortex structures, separated flows
Introduction
The flow past a circular cylinder was studied during the past few decades since the pioneer work of Strouhal and von Kármán. As a representative bluff body, a circular cylinder is shown to be fundamental for a general understanding of a broad class of flows,involving the flow separation and the vortex shedding.As the vortices shed firstly from one side and then the other, an increased drag and a periodic pressure are imposed on the cylinder surface[1-3]. Thus, a wide variety of both active[4-5]and passive[6-7]strategies for reducing the drag and suppressing the vortex shedding were proposed and studied. In this work, the influence of the hydrophobic coating on the flow past a circular cylinder is experimentally studied to reveal the potential effect of the hydrophobic coating.
The hydrophobic coating and its ability of reducing drag were investigated since the middle 1990s. By measuring the pressure drop and the velocity profile, Watanabe and Udagawa[8]firstly reported the laminar drag reduction of fluids in square, rectangular and circular pipes with highly water-repellent walls. The maximum drag reduction ratio was detected in the square pipe, which was about 15%. In micro-channel flows, Ou et al.[9-10]measured a maximum slip velocity of more than 60% of the average velocity with a 40% drag reduction effect.Through their detailed velocity measurements, it was demonstrated that the slip along the shear-free airwater interface supported between the hydrophobic micrometer-sized ridges is the primary mechanism responsible for the drag reduction observed for flows over hydrophobic coatings. More recently, Daniello et al.[11], Martell et al.[12]investigated the drag reduction effect of hydrophobic coatings in turbulent flows. Their experimental and computational results sugges- ted that in turbulent flows, only when the spacing between micro-features is on the same order as the thickness of the viscous sub-layer, the drag reduction takes effect.The skin friction drag on the large hydrophobic plates is also measured and compared with that of an uncoated bare aluminum plate using a high-speed towing tank system developed by Aljallis et al.[13]. Significant drag reduction up to 30% in the transition regime is observed on the hydrophobic plate.
In view of the significant drag reduction of the hydrophobic coating both in the micro-channel flows and the flat plate flows, studies were carried out for its effect on the flow past a circular cylinder. You and Moin[14], Legendre et al.[15]were among the first to investigate this problem. In You’s study, a combination of the direct numerical simulation (DNS) and the large eddy simulation (LES) was used to study the flows past cylinders coated with alternating circumferential bands of partial slip and no-slip. The slip length was set to be 2% of the cylinder diameter in both the stream-wise and span-wise directions. At the Reynolds numbersin their studies,the largest reduction of the drag and the rms lift on the cylinder, as much as 75%, was found while almost no effect on the shedding frequency was detected. The reduction of the drag and the lift was also detected in Legendre’s study using the DNS method. Additionally,it was shown that the vortex intensity in the wake of the hydrophobic cylinder decreased while the vortex shedding frequency increased because of the slip condition of the cylinder surface. Recently, in the experiments performed by Muralidhar et al.[16], the cylinders coated with hydrophobic coatings were found to delay the onset of the vortex shedding and to increase the length of the formation region of the separated vortex in the wake. As for the separation point and the vortex shedding frequency, the results varied as the direction of the slip changed. A more direct method of investigating the influence of the slip on the vortex-induced motion of a hydrophobic cylinder was used by Daniello et al.[17]. By directly measuring the lift and drag forces on the cylinder,they found that the presence of the slip decreased the rms lift and the amplitude of the oscillating cylinder by up to 15% with no measureable impact on the drag or the natural frequency of the elastically mounted system. Despite the interests on the use of hydrophobic coating for the f1ow control, the flow characteristics and the vortex structures, such as the mean velocity and the turbulence intensityprofiles,in the wake remain to be experimentally determined.
In this study, several experiments on the flow past hydrophobic circular cylinders are performed.The velocity and turbulence intensity profiles as well as the separation angles are measured and compared,to help to reveal the mechanism of how hydrophobic coatings influence the flow past a circular cylinder.
1. Experimental details
The experiments in this study are performed in a gravitational low-speed water tunnel with an experimental segment of 0.2 m×0.2 m×1.2 m, as described in our another paper[18]. The systematic error of the water speed is less than 1.0%, and the free stream turbulence intensity at the center of the experimental segment is less than 2.0%. The testing cylinders are in 4 groups. Each group consists of 3 cylinders with diameters ()d of 0.010 m, 0.015 m and 0.020 m. The f1ow structures around the cylinders are measured at Re of 1 100, 2 200, 2 850, 3 800, 6 600, 9 900 and 13 200. The length of the testing cylinders is 14cm. It is widely accepted that the wake for cylinders with an aspect ratio larger than 3.8 can represent that for an infinitely long cylinder[6], as is the case in this study.
All cylinders are made of aluminum with three groups being coated with hydrophobic coatings. The smooth cylinders and the three groups of cylinders with hydrophobic coatings are referred to as 0#, 1#, 2#,and 3#, respectively. The hydrophobic coatings investigated in this study are fabricated using the following spraying method. In the first step, the cylinders are coated with hydrophobic materials (acrylic) to reduce the surface energy. In the second step, the polytetrafluoroethylene (PTFE) and carbon tubes are added into the acrylic layer to increase the surface roughness. And then, with a heating process for the 2#and 3# coatings, firm hydrophobic coatings are obtained, no heating process is applied for the 1#coating. The properties and the SEM images of the hydrophobic coatings are shown in Table 1, Fig. 1.
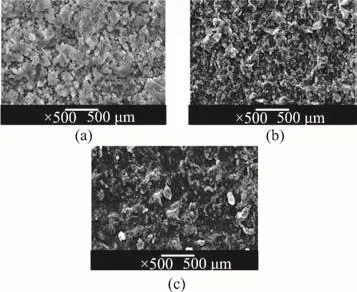
Fig. 1 SEM images of the hydrophobic coatings
Schematic diagrams of the testing system and the coordinate system used in the experiments are shown in Fig. 2. The origin of the coordinate system is at the center of the cylinder. The x axis is in the direction of the flow, the z axis is perpendicular to the flow and the y axis coincides with the cylinder axis. Two end plates with sharpened leading edges are installed at each end of the cylinder (Fig. 2(b)) to minimize the influence of the boundary layer developed along the sidewalls of the tunnel.
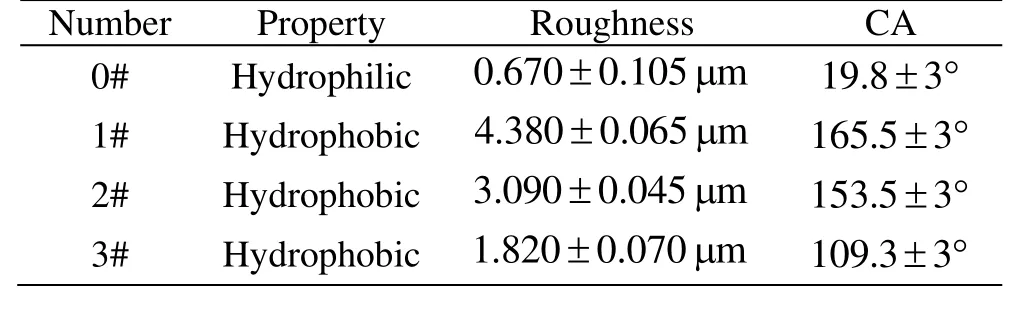
Table 1 Properties of the cylinder surfaces
The flow velocity profiles and the turbulence intensity profiles in the wake of the cylinder are measured using the “IFA 300” constant-temperature anemometry system of TSI Company. This system can automatically adjust the frequency response, with a maximum value of 300 kHz, so it can capture very high frequency fluctuations of turbulence. In this study, a single-sensor hot-film probe (model “1218–20 W”) is selected. In view of the symmetry of the wake behind the cylinder, 21 measuring points are distributed in half of the wake with a minimal interval of 0.05d. At each measuring point, the velocity data is acquired for 20 s at a frequency of 50 000 Hz with a low-pass filtering at 25 000 Hz.
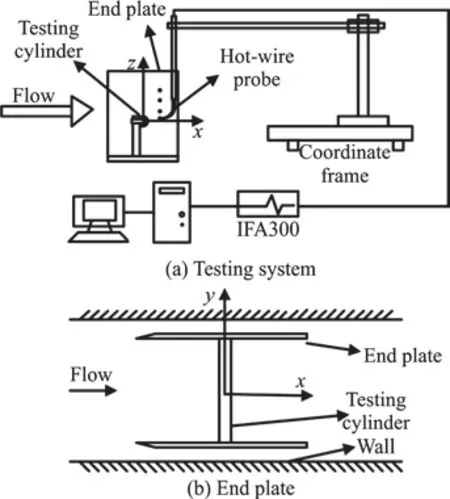
Fig. 2 Experimental setup
2. Results and discussions
2.1 Results in time domain
For the hydrophobic coating under water, there are two different wetting states, “the Cassie state[19]”and “the Wenzel state[20]”. In the Wenzel state, the water penetrates into the interspace between the micro/nano structures on the surface. In the Cassie state, the hydrophobicity of the micro/nano structures prevents the water from penetrating into the interspace,thus, an air-water interface is formed between the water and the solid surface. It is accepted that only in the Cassie state can the hydrophobic coating generate a significant drag reduction[13,21]. A plate with the hydrophobic letters “hydrophobic” is placed under the water to show the wetting state of the hydrophobic coating. The hydrophobic coating is colored with red fine powders (Fig. 3(a)). In the Cassie state, the letters are covered by an air layer and appear to be light-reflecting (Fig. 3(b)), as is the case in this study for Re lower than 3 800 (Fig. 3(c)). When Re is higher than 6 600, the air-water interface disappears(Fig. 3(d)) and the coatings turn into the Wenzel state.
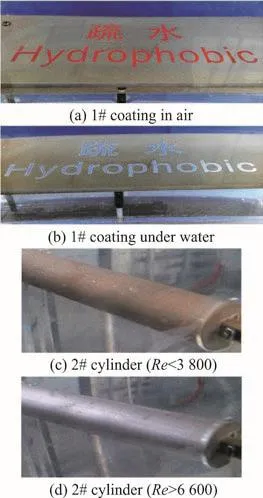
Fig. 3 (Color online) Wetting state of the hydrophobic coating
Figure 4 shows the vertical profiles of the streamwise mean velocity and the turbulence intensity measured at the downstream location ofin the cases of3800, and the coatings are now in the Cassie state as mentioned in Section 2.1. The stream-wise mean velocityand the location of the measuring point in z axisare scaled using the free stream velocityand the diameter of the cylinder, respectively.

Fig. 4 Profiles in the wake of the cylinders in the Cassie state
The observation of a higher stream-wise mean velocity as shown in Fig. 4(a) implies that the momentum defi cit of th e cy lin der i s controlle d by the hydrophobiccoatingsandadragreductioneffectis shown. When R e = 2 200 in Fig. 4(a), the velocity at′= 0 for all cylinders almost decreases to 0, which implies that the measuring points are located in the formation region of the separated vortex, where the velocity of the flow is extremely low. As Re grows higher over 2 800, the mean velocity at z ′= 0 rises up a great deal. This process just matches the evolution trend of the vortex formation region in the wake of the cylinder whose length decreases as Re grows. It can be inferred from the data that the vortex formation region in the wake of the hydrophobic cylinders decreases faster than that of the smooth cylinders.
Comparing the turbulence intensity profiles in Fig. 4(b), we can see that when Re < 3800, the turbulence intensity in the wake of the hydrophobic cylinders is lower than that of the smooth cylinders.And for 1# coating one sees the largest difference,which is about 50%. This is because the shear free air-water interface largely reduces the shear stress on the cylinder surface and then leads to a decrease of the amount of vorticity brought into the wake, generated at the surface of the circular cylinder. This also verifies the drag reduction effect of the hydrophobic coatings at these values of Re.
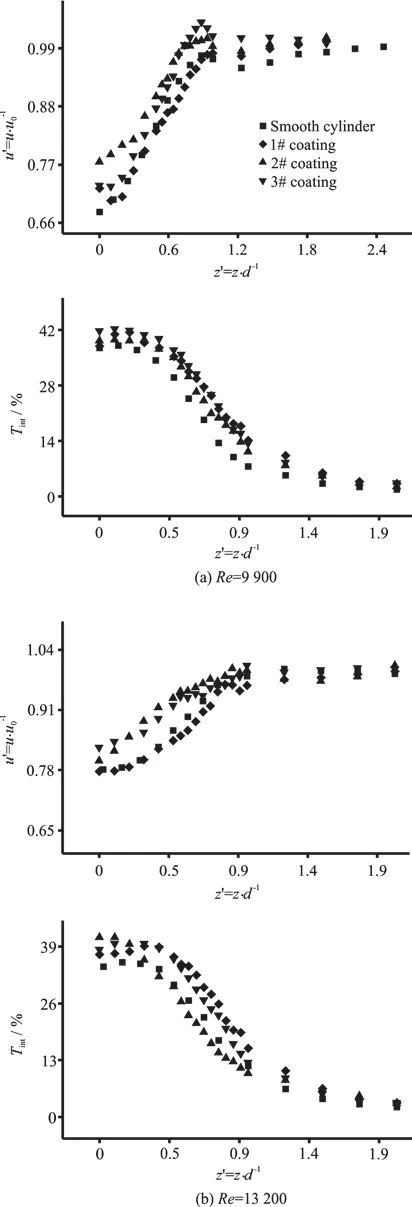
Fig. 5 Profiles in the wake of the cylinders in Wenzel state
As Re increases, the air-water interface disappears and the underwater hydrophobic coatings turn into the Wenzel state (Fig. 2(d)). The slip boundary condition of the hydrophobic cylinders is replaced by a partial slip or non-slip condition. The flow field is now influenced more by the roughness than by the hydrophobicity of the coatings. The results under this condition are shown in Fig. 5. Although the velocity deficit of the 2# and 3# coatings is still smaller than that of the smooth cylinders, the difference between them is much smaller. The velocity deficit of the 1#which keeps almost constant for the values of Re covered in this study.This can be seen in the measurements of the St for the smooth cylinders presented in Fig. 6, which matches the well-established trends[22]. The values of St in this study are obtained by applying a frequency spectrum analysis for the velocity signals at / =z d 0.5 in the wake of the cylinder. Comparing with the smooth surface, the hydrophobic coatings do not show much influence on St, which experimentally verifies the simulation results of You and Moin.coating becomes even higher than that of the smooth cylinders, unlike the results for Re lower than 3 800.
Additionally, the change of the wetting state from “the Cassie” to “the Wenzel” has more profound influence on the turbulence intensity profiles. The vorticity and the velocity fluctuation generated by the roughness of the hydrophobic coatings weaken the influence of the hydrophobicity, thus, induce a higher turbulence intensity for the hydrophobic cylinders in the wake. More details of the influence on different scales of vortex components are in the next section of this article.
2.2 Results in frequency domain
The vortices behind the circular cylinder are shed at a dimensionless shedding frequency known as the Strouhal number,
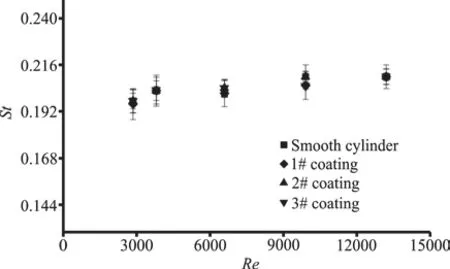
Fig. 6 Dimensionless vortex shedding frequency, St, as a function of Re
The turbulent structures in the near wake of a circular cylinder are characterized by a wide range of scales, including the large-scale structures and the relatively small-scale structures[23-25]. The proportions of different scales of turbulent structures differ at different locations of the measuring point. In order to investigate the influence of the hydrophobic coatings on different scales of structures in the Wenzel state, a multi-resolution technique based on the orthogonal wavelet transform (OWT) is applied to analyze the velocity data obtained in the x-z plane in the turbulent wake of the cylinders. Using this technique,the turbulent structures are decomposed into a number of wavelet components based on their wavelet levels or central frequencies, and the subtle influence of the hydrophobic coatings can be revealed.
In this study, the Daubechies wavelet basis with an order of 20 is chosen as the orthogonal wavelet basis, because this wavelet basis of a higher order has a good frequency localization, which in turn increases the energy compaction. The wavelet basis can be simplified as
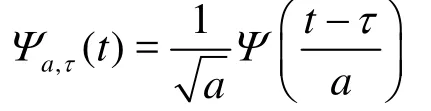
where a is the scaling parameter, and τ is the translating parameter[26-27]. In the practical application,a and τ are always discretized. Here, we choosea=2j( j ∈Z) and τ=kτ0(k∈Z).According to the Nyquist-Shannon Sampling Theorem, because the width oftimes of the width of,so the corresponding τ can be chosen asis normalized as 1).
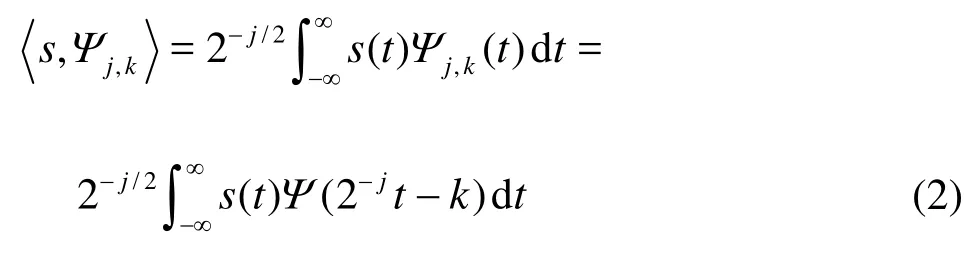
The set of functions forming the orthogonal basis can be written as

The corresponding discrete wavelet transform(DWT) is
Based on the OWT, the signal ()s t can be described as
With the scale0j chosen as the critical value,the signalcan be divided into approximate and detailed parts as
The first part of Eq. (4) is the approximation (low frequency) of the signal ()s t and the second part is the details (high frequency) of ()s t.
By using the above method, the measured instantaneous velocity in the wake of the cylinder is decomposed into different wavelet levels or wavelet components in the x-z plane. Then the signals are reconstructed in particular levels, to eliminate most redundant frequencies, and the velocity components at different frequencies are extracted. So the key is to calculate the frequency corresponding to each scale of the OWT, which can be obtained in the following equation
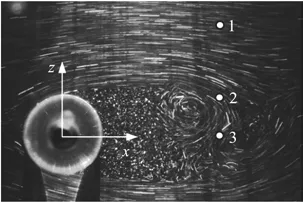
Fig. 7 Location of the measuring point
Here, we have decomposed the instantaneous velocities measured at 3 typical points behind the circular cylinder in the case of R e = 9900. The 3 points are located at=2 in the flow direction and=1.5, 0.5, 0, respectively, along the z axis(as shown in Fig. 7). Figure 8 shows the fluctuating velocityof different scales of the turbulence structures. We can see that the point 1 at=1.5 is located at a place out of the wake, the signal at this point is almost unaffected by the shedding vortex and only shows a slight fluctuation. The point 2 at=0.5 is located at the center of the upper vortex street, so the velocity componentthere shows an extremely strong fluctuation and periodicity. This is also the reason why the point 2 is chosen to be the location to extract the vortex shedding frequency.Furthermore, it is from here that the under vortex street starts to show its effect, which can be detected from the fluctuation of the velocity component 2.When the measuring point moves down to the center of the wake at the point 3, the signal there is strongly affected by both the upper and under vortex streets.Comparing with the point 2, the velocity componentdies down while the velocity componentreaches its peak value. All above results indicate that the OWT can accurately decompose the signal into different velocity components and can be appropriately used in the following research.
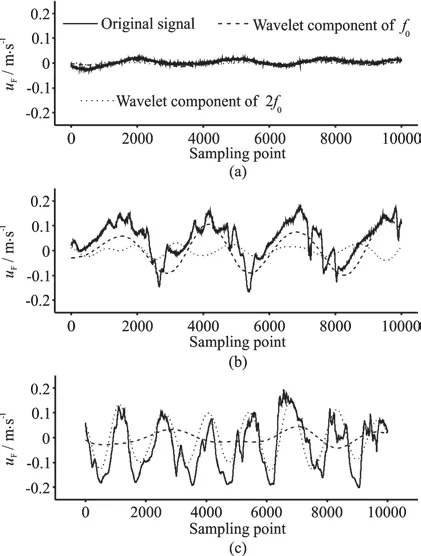
Fig. 8 Turbulence signals of different scales at different positions
The turbulence intensity is defined as the ratio of the root-mean-square of the turbulent velocity fluctuations to the mean velocity. It means that for the same Re, the turbulence intensity of the reconstructed velocity component at the same measurement point can reflect the intensity of different scales of the vortex structures. Thus the same analysis is conducted for the signals of the hydrophobic circular cylinders in the case of R e = 9900, and the turbulence intensity of the reconstructed velocity components is calculated.The turbulence intensities for the velocity component f0and 2 f0are shown in Fig. 9.
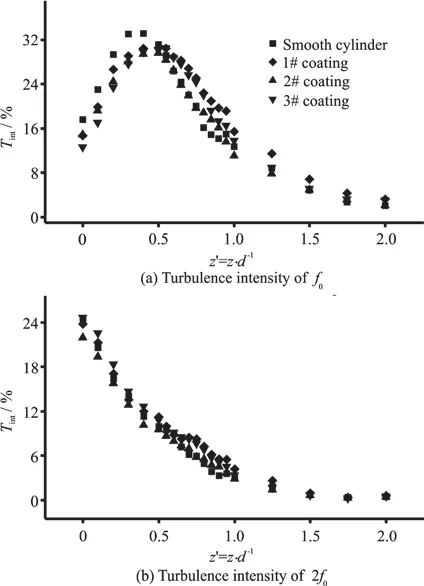
Fig. 9 Turbulence intensities of different wavelet components in the wake of the circular cylinders
By comparing the turbulence intensity of the velocity components for different cylinders, the influence of the hydrophobic coatings on different scales of vortex structures can be obtained. Along z axis,from the center of the wake to the outside of the wake,the turbulence intensity of the velocity component f0experiences a process of increasing first and decreasing later. And it reaches its peak value (nearly 30%)at=0.5. In contrast, the turbulence intensity of the velocity componentdecreases all the way to almost 0% from the center of the wake to the outside of the wake along z axis. The different trends of the turbulence intensity of different velocity components are due to the fact that there are two symmetrical shedding vortex streets behind the cylinder. As shown in Fig. 5, the total turbulence intensity of the hydrophobic cylinders at the same Re is higher than that of the smooth ones. The OWT analysis shows that,unlike the total turbulence intensity, the turbulence intensity for the large scale velocity componentof the hydrophobic cylinders is lower than that of the smooth cylinders. And the turbulence intensity for the large scale velocity componentof the hydrophobic cylinders is almost the same as that of the smooth ones. It means that in the Wenzel state, the surface hydrophobicity still controls the large scale vortex structures in the wake of the cylinders. And it is the turbulence intensity of much smaller scalesthat leads to a higher total turbulence intensity. On the one hand, the roughness of the hydrophobic coatings stretches into the boundary layer on the surface of the cylinders. Thus, the large scales of the vortex structures are broken into small scales by the surface roughness. On the other hand,the roughness itself will generate many more small scales of the vortex structures. These differences indicate that, in the Wenzel state, the roughness of the hydrophobic coatings weakens the effect of the hydrophobicity.
2.3 Separation angle
The angle formed by the front stagnation point,the center of the circle and the separation point is defined as the separation angle ()θ. A large separation angle means that the boundary layer separates further downstream from the front stagnation point on the surface of the cylinder. In this paper, the tracer particles are spread into the flow field to observe the changes of the separation angle from the cylinder as a function of the hydrophobic coating. With a laser light sheet illuminating the flow field vertical to the cylinder, a clear view at the separation point from the cylinder surface is captured (as shown in Fig. 10).
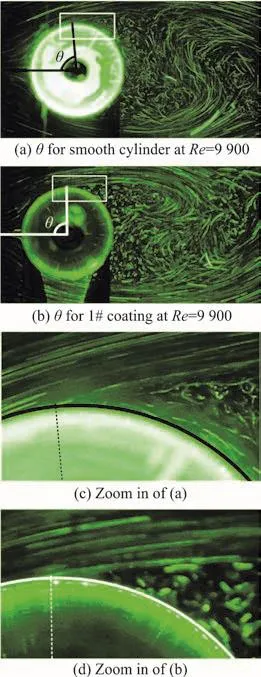
Fig. 10 (Color online) The wake of the cylinder
By processing the images, the separation angle is quantified in Fig. 11 as a function of Re for the smooth cylinders as well as the 1# hydrophobic cylinders. And the separation angle from the smooth cylinders follows the well-established trends. For Re lower than 3 800, as Re grows, the separation angle shows a slight decrease. When Re becomes higher than 6 600, the separation angle keeps relatively stable.The separation angle for the 1# hydrophobic cylinder follows the same trend as Re grows. But when Re is lower than 3 800, one sees a sharper decrease. And in the latter process, the separation angle is about 5°less than that of the smooth circular cylinder. The results agree with those of Muralidhar et al.[16]for the hydrophobic coating with micro ridges aligned in the flow direction.
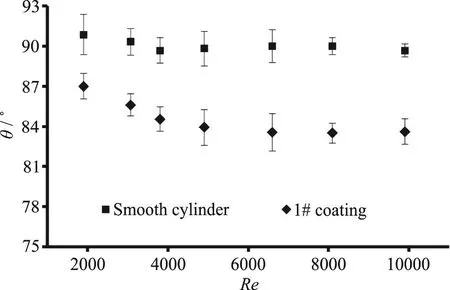
Fig. 11 Separation angles as a function of Re
3. Conclusion
In this work, a series of experiments are carried out to investigate the effect of the hydrophobic coating on the flow past a circular cylinder. The hydrophobic coatings investigated in this study are produced using a spraying method. Whenthe hydrophobic coatings are in the Cassie state. In this state, the hydrophobic coating decreases the deficit of the mean velocity and the turbulence intensity in the wake of the cylinders, thus has a significant drag reduction effect. Whenthe hydrophobic coatings turn into the Wenzel state,the roughness of the hydrophobic begins to affect the flow field and the drag reduction effect disappears.The subtle effects of the roughness are detected from the results of the OWT analysis. The results indicate that the hydrophobic coating decreases the intensity of the large scales of vortex components and increases that of the small scales. For all values of Re in our study, the hydrophobic cylinders have smaller separation angles while the vortex shedding frequency is almost the same as that of the smooth cylinders. This work demonstrates experimentally that the hydrophobic coating has potential effects in the application of the drag reduction for the flow past a circular cylinder.
Acknowledgement
This work was supported by the Innvovation Foundation of Maritime Defense Technologies Innovation Center, the Fundamental Research Funds for the Central Universities (Grant No. 3102018gxc007).
杂志排行

水动力学研究与进展 B辑的其它文章
- Call For Papers The 3rd International Symposium of Cavitation and Multiphase Flow
- Bubble dynamics and its applications *
- Transient peristaltic diffusion of nanofluids: A model of micropumps in medical engineering *
- High-speed experimental photography of collapsing cavitation bubble between a spherical particle and a rigid wall *
- Flow induced structural vibration and sound radiation of a hydrofoil with a cavity *
- Unsteady flow structures in centrifugal pump under two types of stall conditions *