Impurity profile of macitentan in Tablet dosage form using a stability-indicating high performance liquid chromatography method and forced degradation study
2019-01-05NarasimhaLAKKAChandrasekarKUPPANParthasarathyRANGASAMY
Narasimha S LAKKA, Chandrasekar KUPPAN, Parthasarathy RANGASAMY
(1. Department of Science and Humanities, VIGNAN’s Foundation for Science, Technology & Research (VFSTR), Vadlamudi, Guntur (Dist.) 522213, India; 2. Department of Analytical Research & Development, Sinotherapeutics Inc., Shanghai 201210, China)
Abstract: Macitentan (MAC) is a pulmonary arterial hypertension (PAH) drug marketed as a tablet and often has stability issues in the final dosage form. Quantitative determination of MAC and its associated impurities in tablet dosage form has not been previously reported. This study quantified impurities present in Macitentan tablets using a binary solvent-based gradient elution method using reversed phase-high performance liquid chromatography. The developed method was validated per International Conference on Harmonization (ICH) guidelines and the drug product was subjected to forced degradation studies to evaluate stability. The developed method efficiently separated the drug and impurities (48 min) without interference from solvents, excipients, or other impurities. The developed method met all guidelines in all characteristics with recoveries ranging from 85%-115%, linearity with r2≥0.996 6, and substantial robustness. The stability-indicating nature of the method was evaluated using stressed conditions (hydrolysis: 1 N HCl at 80 ℃/15 min; 1 N NaOH at 25 ℃/45 min; humidity stress (90% relative humidity) at 25 ℃ for 24 h, oxidation: at 6% (v/v) H2O2, 80 ℃/15 min, thermolysis: at 105 ℃/16 h and photolysis: UV light at 200 Wh/m2; Fluorescent light at 1.2 million luxh). Forced degradation experiments showed that the developed method was effective for impurity profiling. All stressed samples were assayed and mass balance was>96%. Forced degradation results indicated that MAC tablets were sensitive to hydrolysis (acid and alkali) and thermal conditions. The developed method is suitable for both assay and impurity determination, which is applicable to the pharmaceutical industry.
Key words: reverse phase-high performance liquid chromatography (RP-HPLC); stability-indicating method; forced degradation study; binary solvent gradient; endothelin receptor antagonist (ERA); pulmonary arterial hypertension (PAH); macitentan (MAC); impurity profiling
Macitentan (MAC) is a U S Food and Drug Administration (FDA) approved oral endothelin receptor antagonist (ERA) drug for treatment of pulmonary arterial hypertension (PAH) [1]. The chemical structure of macitentan isN-[5-(4-bromophenyl)-6-[2-([(5-bromo-2-pyrimidinyl)oxy]ethoxy]-4-pyrimidinyl]-N′-propylsulfamide with molecular formula C19H20Br2N6O4S and relative molecular mass of 588.27. MAC exhibits dual biological activities on endothelin (ET) receptor subtypes A and B, resulting in receptor antagonism [2]. The active metabolite ACT-132577, formed by oxidative depropylation of MAC, is a dual receptor antagonist with 16-fold greater selectivity for ETAthan ETB[3,4]. Greater selectivity towards ET by the drug results in reduced characteristic physiological changes in patients with PAH such as vascular tone and proliferation of endothelial smooth muscle cells and fibroblasts [5]. Compared to other ERA drugs, MAC exhibits superior activity with a single dose per day, resulting in a 15 to 20-fold increase in receptor activity [6]. This increased activity is associated with stronger binding characteristics of the drug with the receptor, independent of ET-1 concentration [7]. Bioavailability of MAC under physiological conditions is 6%, which is greater than other ERA drugs such as bosentan (1%) and ambrisentan (0.01%), resulting in greater efficacy. The pKavalue (6.2) of the drug suggests it exists in a non-ionized form under physiological conditions, maintaining adequate hydrophobicity to allow diffusion into cells [7,8]. Higher tissue penetration and sustained receptor binding makes this drug beneficial compared to other drugs. This ERA drug has been synthesized by many manufacturers by adopting multistep synthetic procedures [9,10]. With increasing number of synthetic steps, the number of impurities may increase, which may result in increased regulatory scrutiny.
According to ICH [11] and various pharmacopeia (United States Pharmacopeia (USP), European Pharmacopeia (Ph. Eur.), British Pharmacopeia (BP), Japanese Pharmacopeia (JP)), the acceptable limit of any impurity in a drug substance should be less than the identification threshold [12]. Identification of impurities above the ICH threshold for identification [11-13] is essential (a) to avoid genotoxicity, (b) to guarantee the quality of the drug, (c) to assure safe usage and (d) maintain efficacy. Increasing therapeutic importance of MAC justifies development and validation of methods to separate, quantify, and identify all MAC-related impurities. Impurity profiling is a necessary activity for newly discovered drug substances. Impurity profiling identifies possible degradation products using forced degradation, and informs development of suitable methods to identify and separate impurities [14-20]. Impurity profiling studies are essential activities in development of stability-indicating methods for analysis of new drugs substances and drug products. Impurity profiling has the potential to inform new synthetic techniques to manufacture drugs with high purity.
Prior to 2013, the majority of literature focused on MAC was limited to synthesis and therapeutic usage because of lack of U S FDA approval [1]. Following FDA approval, studies focusing on MAC increased in number (Table 1S, supporting information at http://www.chrom-China.com/UserFiles/File/1806032_Supporting_Information.pdf). However, few studies evaluated impurity profiles in MAC tablets using stability-indicating methods [21-30]. These studies are important because impurities can be generated during synthesis, manufacturing and storage. As such, impurity profiling of MAC in tablet form is necessary.
Impurity profiling can be performed using many modern analytical tools [11-13]. HPLC is a modern technique used to separate the impurities from active pharmaceutical ingredients. Structural characteristics of related impurities and degradation products can be determined using various detection techniques such as UV/Vis, mass spectrometry (MS), evaporative light scattering (ELS), and refractive index (RI).
This study proposed a novel stability-indicating method for assay and impurity analysis of MAC in tablet dosage form using RP-HPLC. The proposed method had adequate specificity to allow for quantitation of MAC and MAC-related substances in oral dosage form tablets. This method employed separation using a binary solvent system, allowing for simple, rapid, precise, accurate, and specific process. The developed method was validated for specificity, linearity, quantitation limit, accuracy, precision, robustness, and solution stability.
1 Experiments
1.1 Reagents and materials
Ammonium formate (NH4HCO2, Analytical Reagent grade) was purchased from SCR, China. Acetonitrile (CH3CN, AR grade) and methanol (CH3OH, HPLC grade) were purchased from Merck, USA. MAC standard, four of its related process and degradation impurity standards, MAC formulation tablet (10 mg) samples, and placebo sample (matrix without drug) were kindly gifted by Sinotherapeutics Inc., China. HPLC grade water was collected from a purified water generator (Elga, UK).
1.2 Instrumentation
A high performance liquid chromatography system (Waters Alliance e2695, Waters, UK) equipped with a UV/Vis detector (Waters 2489, Waters, UK) and/or photodiode array (PDA) detector (Waters 2996, Waters, UK) and fitted with an HPLC column (Inertsil ODS-3V, 250 mm×4.6 mm, 5 μm, GL Sciences, Japan) was used for separation and detection. An ultrasonic bath (Sonicator, Shumei, China), centrifuge (Cence, H1650-W, China), and 0.45-μm porosity membrane filters (type: Nylon; diameter: 25 mm; maker: MS, Membrane Solutions, China) were used for sample preparation. Empower 3 software was used to collect, process, and report data.
1.3 Chromatographic conditions
Chromatographic separation was achieved by HPLC with gradient elution. Ammonium formate (50 mmol/L) buffer solution was used as mobile phase A and acetonitrile was used as mobile phase B. A solvent gradient program using mobile phase A and B was programmed as follows: time (min)/B (%): 0.01/10.0, 10.0/55.0, 20.0/65.0, 30.0/75.0, 38.0/75.0, 40.0/10.0 and 48.0/10.0, with a flow rate of 1.0 mL/min. Injection volume was 10 μL. The auto-sampler tray temperature was maintained at ≤ 10 ℃ to enhance standard and sample stability. The column temperature was maintained at 30 ℃ and absorbance was monitored at 260 nm.
1.4 Standard and sample preparation
A stock solution of MAC (100 μg/mL) and a standard solution (5 μg/mL) were prepared using ACN/MeOH, 60/40, v/v (diluent), Standard solutions of pure impurities were prepared using the same diluent. The test solution for analysis was prepared as follows: MAC tablets were finely-ground (20 tablets). Approximately 100 mg was diluted to volume (100 mL) using diluent and ultra-sonicated for 15 min. Samples were either filtered using 0.45 micron filters or centrifuged at 10 000 r/min for 5 min and the supernatant (1 000 μg/mL theoretical) was retained for analysis. A placebo solution for specificity measurements was prepared by diluting a definite amount of finely powdered placebo (formulation without drug) to 100 mL using diluent.
1.5 Forced degradation studies
Stability studies are essential in the pharmaceutical industry as they inform recommended storage conditions and shelf-life of a drug product. Stability is the ability of a drug to resist physical or chemical changes over time in response to stress. Among the three types of stability studies [31], forced degradation studies provide the most complete data, as these studies are performed under more severe conditions than standard stability studies. Drug degradation can occur during separation, sampling, storage, or at any other point in the analytical process, necessitating understanding of drug stability under different practical conditions. Forced degradation studies result in production of a wide array of degradation products, allowing for development of accurate and specific stability-indicating methods.
Forced degradation studies were performed using hydrolysis (acid/base/humidity), oxidation, photolysis (UV and photo luminescence), and thermolysis as summarized in Table 1. For acid, alkaline, and oxidative degradation studies, approximately 1 000 μg/mL of test solution was treated with aqueous 1 N HCl at 80 ℃ for 15 min, aqueous 1 N NaOH at 25 ℃ for 45 min, or 6% v/v H2O2at 80 ℃ for 15 min, respectively. After degradation, these solutions were neutralized with appropriate neutralizing agents such as 1 N sodium hydroxide for acid stress and 1 N hydrochloric acid for alkali stress. The oxidized sample was diluted with ultra-pure water and diluted with diluents prior to analysis using the developed RP-HPLC technique.
For thermolytic stress, a finely-ground tablet sample was exposed to dry heat at 105 ℃ for 16 hours in a hot air oven. For photolytic stress, the sample was exposed to photolytic conditions such as UV light with a power intensity of 200 Wh/m2and white cool fluorescence (visible) light of 1.2 million luxh in a photostability chamber as recommended by ICH guidelines [31]. For humidity stress, tablet sample powder was exposed to 90% Relative Humidity at 25 ℃ for 24 hours in a humidity chamber. The above stressed sample solutions (thermolytic, photolytic, and humidity) were prepared by dissolving the respective samples in diluent for subsequent analysis.
The stressed samples were characterized using the same HPLC method developed for analysing pure MAC and associated impurities. The stressed samples were assayed against a freshly prepared working standard and mass balance was assessed by examining the amount of impurities and amount of the active component.
2 RP-HPLC method development for impurity profiling of MAC
Pure MAC, MAC in the presence of impurities, and MAC-related impurities without MAC were used to develop a method for separation using RP-HPLC. Four known impurities were evaluated based on earlier reports of these impurities being present above the threshold limit for MAC-related substances. Solvents, temperature, columns, flow rates, and injection volumes were optimized using these prepared standards. The results of these analyses informed development of a stability-indicating method. Specifics of activities for development of a stability-indicating method are as follows.
2.1 Selection of column
MAC is insoluble in water and lipophilic in nature. As the drug is non-polar and insoluble in water, a reversed phase HPLC column packed with C18sorbent was chosen to achieve separation. Different columns from different manufacturers were evaluated [4,21-30,32], and an Inertsil ODS-3V, 250 mm×4.6 mm, 5 μm (GL Sciences, Japan) was selected based in compatibility with the chosen solvent system and MAC.
2.2 Auto-sampler and column temperature
Based on preliminary investigation, MAC and its impurities were not stable in solution when stored at room temperature. As shown in Fig. 1, the peak intensity of impurity 4 (shown in the inset) increased after 2 hours of storage at room temperature, indicating degradation of MAC. To overcome stability issues, solutions were stored in a refrigerator or in an HPLC auto-sampler set to 10 ℃. Under these conditions, MAC and its related impurities were stable for up to 48 hours. Column temperature was set at 30 ℃, which resulted in optimal separation of MAC and its impurities with a resolution of >2.
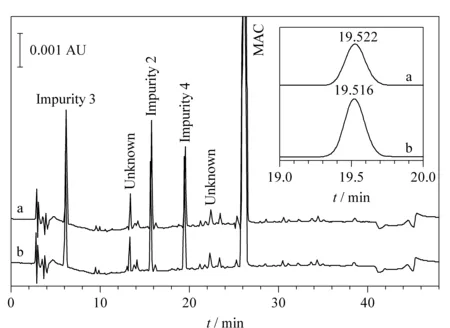
Fig. 1 RP-HPLC chromatogram of MAC and associated impurity samples injected (a) before and (b) after 2 hours of storage at room temperature

Fig. 2 HPLC Chromatogram of (a) MAC spiked with associated impurities, (b) Impurity 3 in acetonitrile-ammonium formate buffer (90∶10, v/v) and (c) diluent (acetonitrile-ammonium formate buffer, 90∶10, v/v)
2.3 Diluent for solution preparation
MAC is insoluble in water, so organic solvents should be used as diluents. Small amounts of water present in diluent led to degradation by hydrolysis of MAC and MAC-related impurities, as confirmed by additional peaks or peak broadening as shown in Fig. 2. Among solvents (acetonitrile, methanol), buffers (ammonium formate buffer), and solvent-buffer mixtures (acetonitrile-ammonium formate buffer (90∶10, v/v)) evaluated, an acetonitrile-methanol binary solvent mixture was the best diluent with regard to stability of MAC solutions. An acetonitrile-methanol ratio of 60∶40 (v/v) was compatible with MAC, its associated impurities, and column conditions. Further, the solvent mixture improved peak resolution.

Fig. 3 Optimized binary (ammonium formate, acetonitrile) solvent gradient program used for separation of MAC and its associated impurities at a flow rate of 1 mL/min at 30 ℃
2.4 Selection of mobile phase
Mobile phases must be selected carefully because the solvents (a) should not induce degradation, (b) should not result in unintended solvent-drug interaction, (c) should result in unintended solvent-column interactions, and (d) should promote resolution of closely eluting peaks. MAC has a pKaof approximately 6.2, so the solvents were likely chosen that it did not induce ionization. Acidic 50 mmol/L ammonium formate buffer (pH 5.5-5.9) was chosen as mobile phase A as this mobile phase is within the operating parameters of the column, and is suitable for high temperatures up to 60 ℃. To aid in resolution, precision, accuracy, and reproducibility, acetonitrile was chosen as mobile phase B.
2.5 Gradient program for separation
Individual mobile phases were not successful in eluting the drug molecules without interference, so a mixture of mobile phase A and B in different ratios were evaluated at different isocratic conditions for better separation. A gradient program was developed by maintaining constant column temperature and flow rate (30 ℃ and 1.0 mL/min, respectively) with varying ratios of mobile phases A and B. The optimized gradient program in time (min)/B (%) in mixed mobile phase A and B was 0.01/10.0, 10.00/55.0, 20.00/65.0, 30.00/75.0, 38.00/75.0, 40.00/10.0 and 48.00/10.0. The optimized gradient can be grouped into three phases as summarized in Fig. 3, which includes a representative chromatogram of MAC and MAC-related impurities. Initially, a linear gradient of 0.01/10.0, 10.0/55.0, 20.0/65.0, 30.0/75 (time (min)/B (%)) was chosen with a high percentage of polar mobile phase A under initial conditions, with a slow transition to a comparatively less polar mobile phase B to retain and resolve early eluting MAC-related impurity peaks with optimal resolution. Second, an isocratic gradient with greater acetonitrile (mobile phase B) composition (time (min)/B (%): 30.0/75.0, 38.0/75.0) was chosen to ensure elution of remaining MAC-related impurities from the column. Finally, mobile phase compositions were chosen to stabilize the column (time (min)/B (%): 40.0/10.0, 48.0/10.0) for post analysis equilibration. This gradient design was best-suited for separation of all analyte peaks (Impurity 1-4, MAC, and all unknown peaks) within the run time of 48 minutes.
2.6 Detection wavelength
The eluted samples were characterized using a UV/Vis detector. MAC showed threeλmaxat 260 nm, 210 nm, and 195 nm as shown in Fig. 4. Among these maxima, 260 nm provided the greatest sensitivity for quantitative characterization of MAC and MAC-related impurities in a tablet dosage form. The other two maxima at 195 nm and 210 nm were subject to interference from the solvents utilized for dilution, so the peak at 260 nm was fixed as the detection wavelength for separation, identification, and quantitative determination of MAC and its impurities in the tablet dosage form.
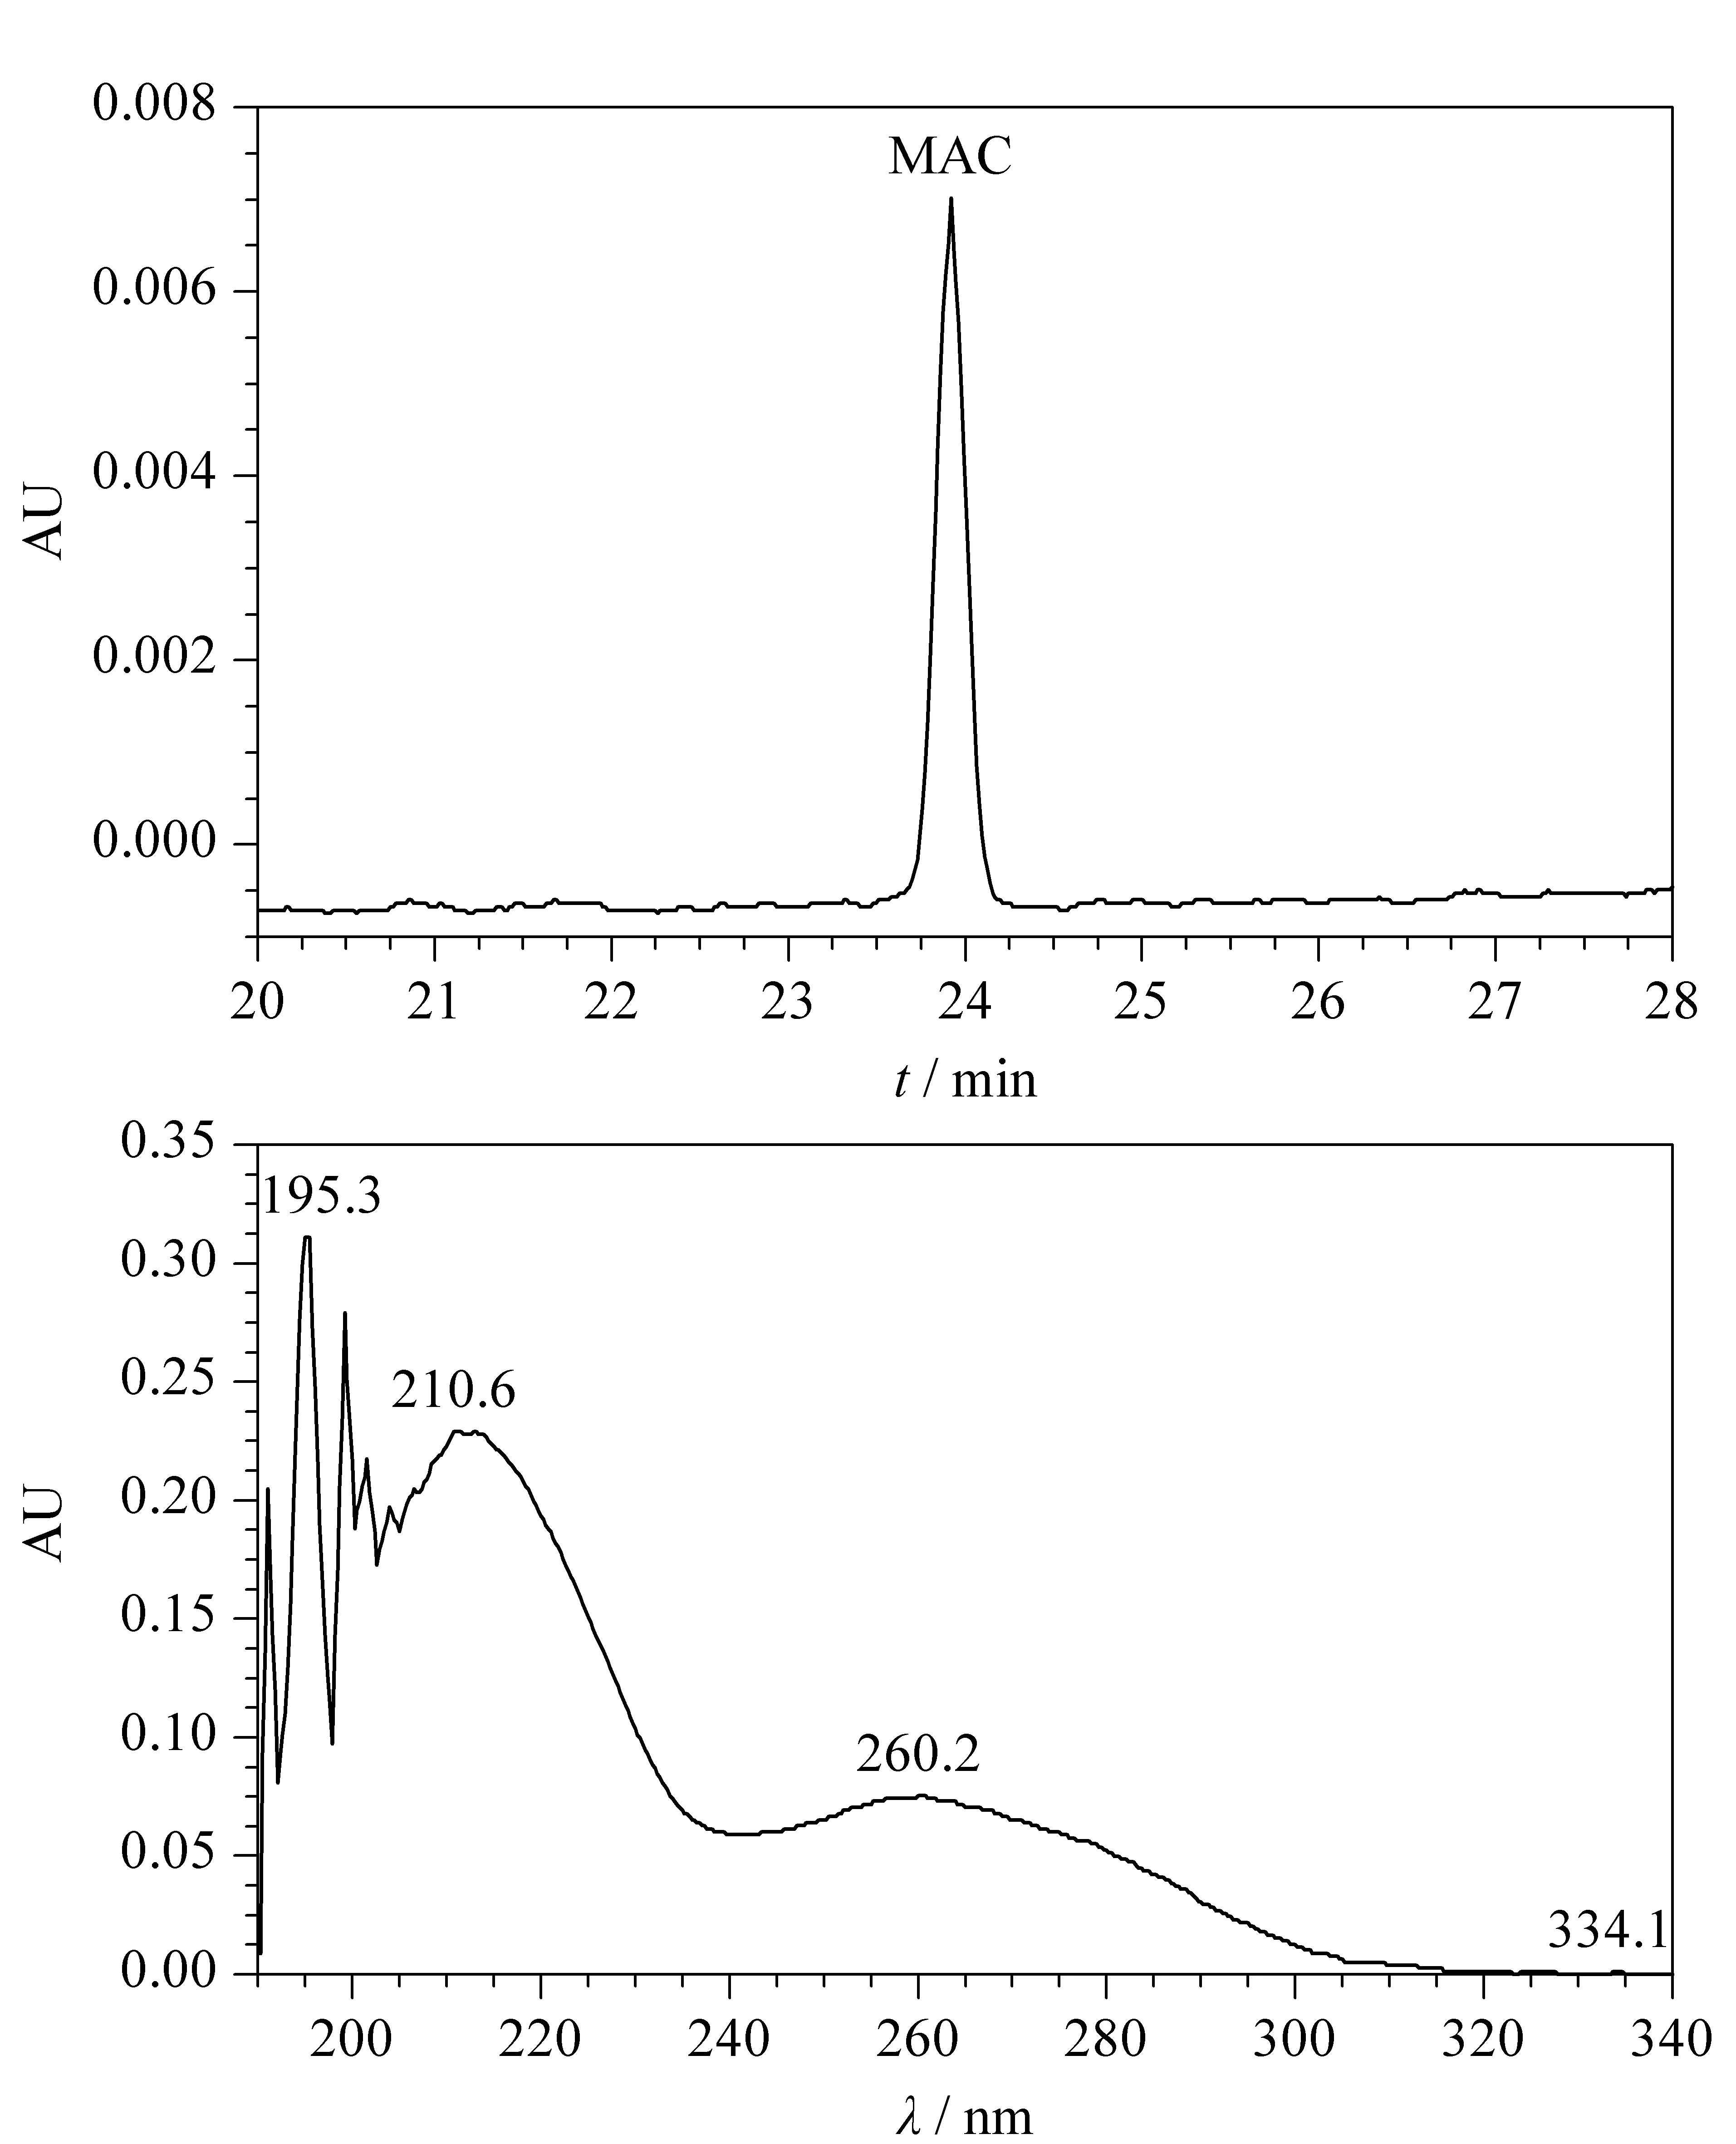
Fig. 4 (a) HPLC chromatogram and (b) UV spectrum of MAC standard solution in ACN-MeOH diluent at 30 ℃
The order of elution using the developed chromatographic technique depended on the polarity of the drug and its associated impurities. MAC is comparatively least polar than its related impurities, and Impurity 3 is highly polar. As such, the order of elution using the RP-HPLC column was expected to follow the following order with respect to time: Impurity 3>Impurity 1>Impurity 2>Impurity 4>MAC which was the case as shown in Fig. 3.
3 Results and discussion
Many manufacturers have synthesized MAC using multistep syntheses [9,10], which upon purification and processing are used to formulate drug products. Though these drugs are initially purified, MAC is susceptible to degradation by external stress conditions thereby affecting the stability of the drug over time [31]. The nature of degradation and the associated impurities with the drug in dosage formulation can be determined by subjecting the drug to force stressed degradation conditions. The main objective of this work was to determine the possible potential impurities in the tablet dosage form and develop a separation technique using RP-HPLC as a stability-indicating method. The developed method was validated per ICH guidelines and was found to be simple, reliable, precise, accurate, robust, specific and stability-indicating for separation and quantitative determination of MAC and its associated impurities, making the method suitable for use in the pharmaceutical industry. The details of the analytical procedures are discussed in the following sections.
3.1 Forced degradation study
Forced degradation of MAC samples in the tablet dosage form was carried out using the standard experimental procedure [31] summarized in Table 1 along with the degraded product. MAC degrades to four known impurities designated 1 to 4 as shown in Fig. 5. Among the four impurities, impurities 2 and 4 are degradation products of MAC (Fig. 6) and impurities 1 and 3 are process related impurities during API synthesis. Forced degradation analyses showed that MAC underwent hydrolytic (acid and alkali), oxidative, and thermal (dry heat) degradation, but not photolytic humidity-related degradation.
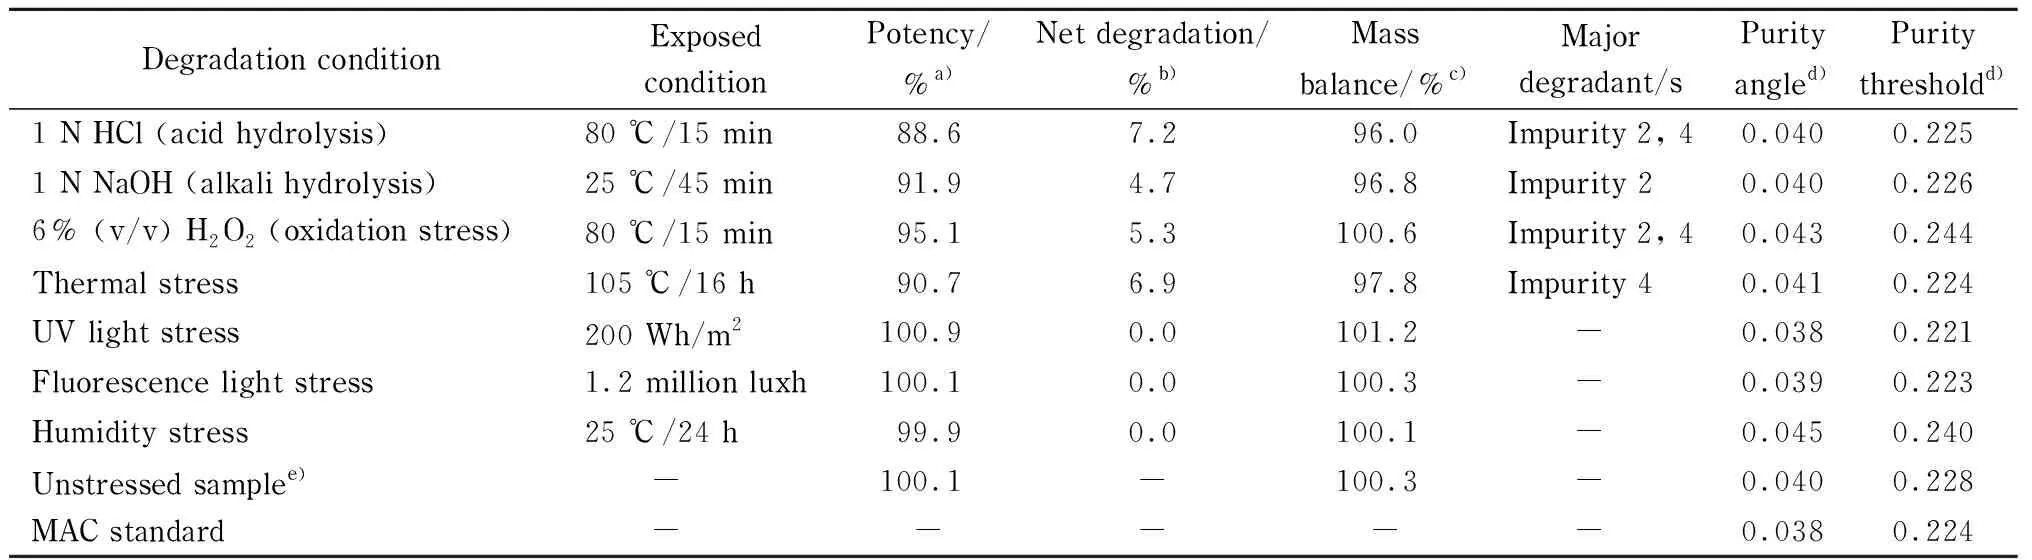
Table 1 Results of forced degradation study of MAC at different stressed conditions
a) Potency of MAC in the respective stressed sample; b) net degradation=total impurities in stressed sample (%)- total impurities in unstressed sample (%); c) mass balance=potency of sample (%)+total degradation (%); d) peak purity: purity angle should be less than purity threshold; e) 0.2%=detected total impurities in unstressed/photo-light/humidity sample; -: not applicable.
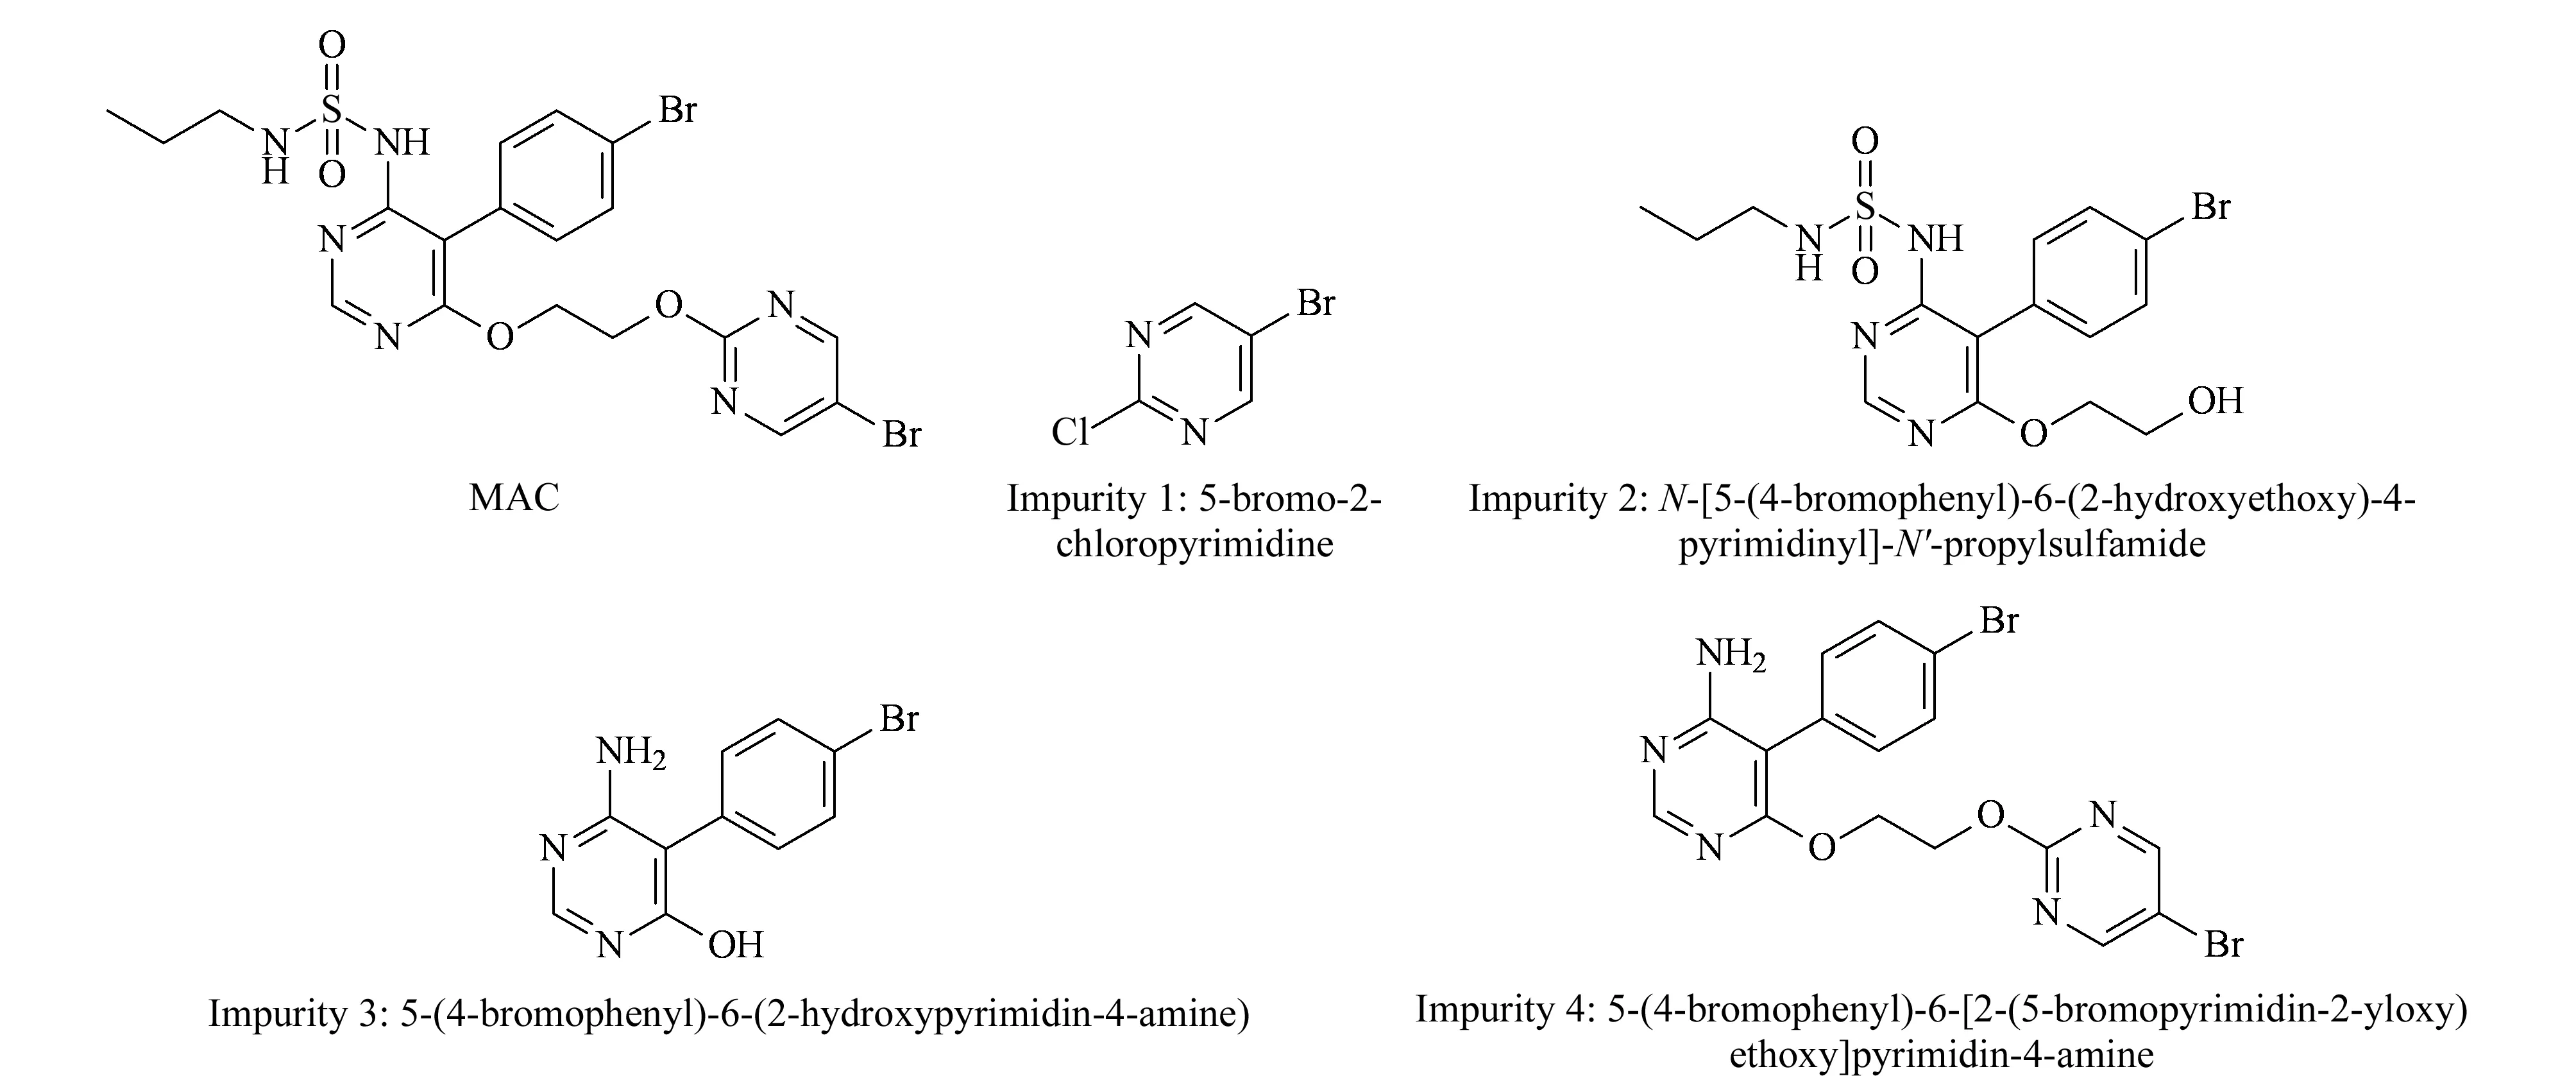
Fig. 5 Structures of MAC and its associated impurities
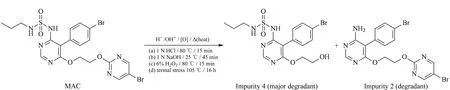
Fig. 6 Force stressed degradation pathway of MAC to impurities 2 and 4 at different conditions
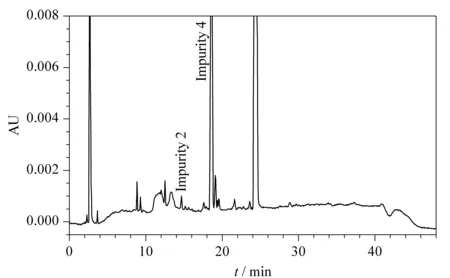
Fig. 7 HPLC chromatogram of MAC after oxidation stress conditions with formation of impurity 2 and 4 at 14.66 and 18.58 min, respectively
Using the developed method, the forced degradation mixture was separated using RP-HPLC equipped with a photodiode array (PDA) detector using Empower 3 software. A representative chromatogram for oxidative degradation is shown in Fig. 7, where the impurity peak 4 and an unknown peak at 19.1 min showed the greatest intensity along with other unknown peaks and impurity 2 at 14.6 min. The developed method clearly showed no interference at the retention time of MAC. To ensure the degraded products and their retention time during the elution process, pure impurity solutions were spiked along with pure MAC and the chromatogram was compared with forced degradation chromatograms. Impurity 4 was the major degradation product from the stress study as shown in Table 1. The purity angle values were found less than the purity threshold values; this indicates that MAC compound is pure in all stressed conditions.
3.2 Method validation
The method developed for the separation process underwent validation per ICH guidelines [33]. The main purpose of validation is to confirm the selectivity and suitability of the developed method to ensure content and purity of the drug product. If content and purity are appropriate, safety and efficacy are assumed. Validation parameters included system suitability, specificity, linearity, quantitation limit, accuracy, precision, solution stability, and robustness [33,34]. Thus, it was necessary to properly define the method conditions prior to validation.
3.2.1System suitability
System suitability of the developed method for MAC (5 μg/mL) was measured using six replicate injections (n=6). System suitability parameters evaluated were tailing factor, plate count, and percent relative standard deviation (RSD). For the drug and its associated impurities, system suitability was within the acceptable limits as shown in Fig. 4 and Table 2 for MAC. The tailing factor was 1.0 (limit: not more than 1.5), which is indicative of a symmetrical peak. The column efficiency or plate counts of the chromatograms were >10 000 (limit: not less than 5 000) indicating excellent chromatographic performance. System precision (mean peak area 71 819) as determined by six replicate injections of the MAC working standard was < 2.1% (RSD limit: not more than 5.0%), indicating repeat-injection precision.
3.2.2Specificity
Specificity of the method was evaluated to determine interference of solvents, placebo matrix, and impurities in the chromatographic method using resolution as an indicator. The developed method showed no interference at the retention time of MAC in impurity, solvent, or placebo preparations. Furthermore, the associated impurity peaks were also well-resolved and free of interference. These results demonstrate method specificity as well as selectivity. A representative chromatogram of a spiked sample and impurities compared to a blank and a placebo is given in Fig. 8.
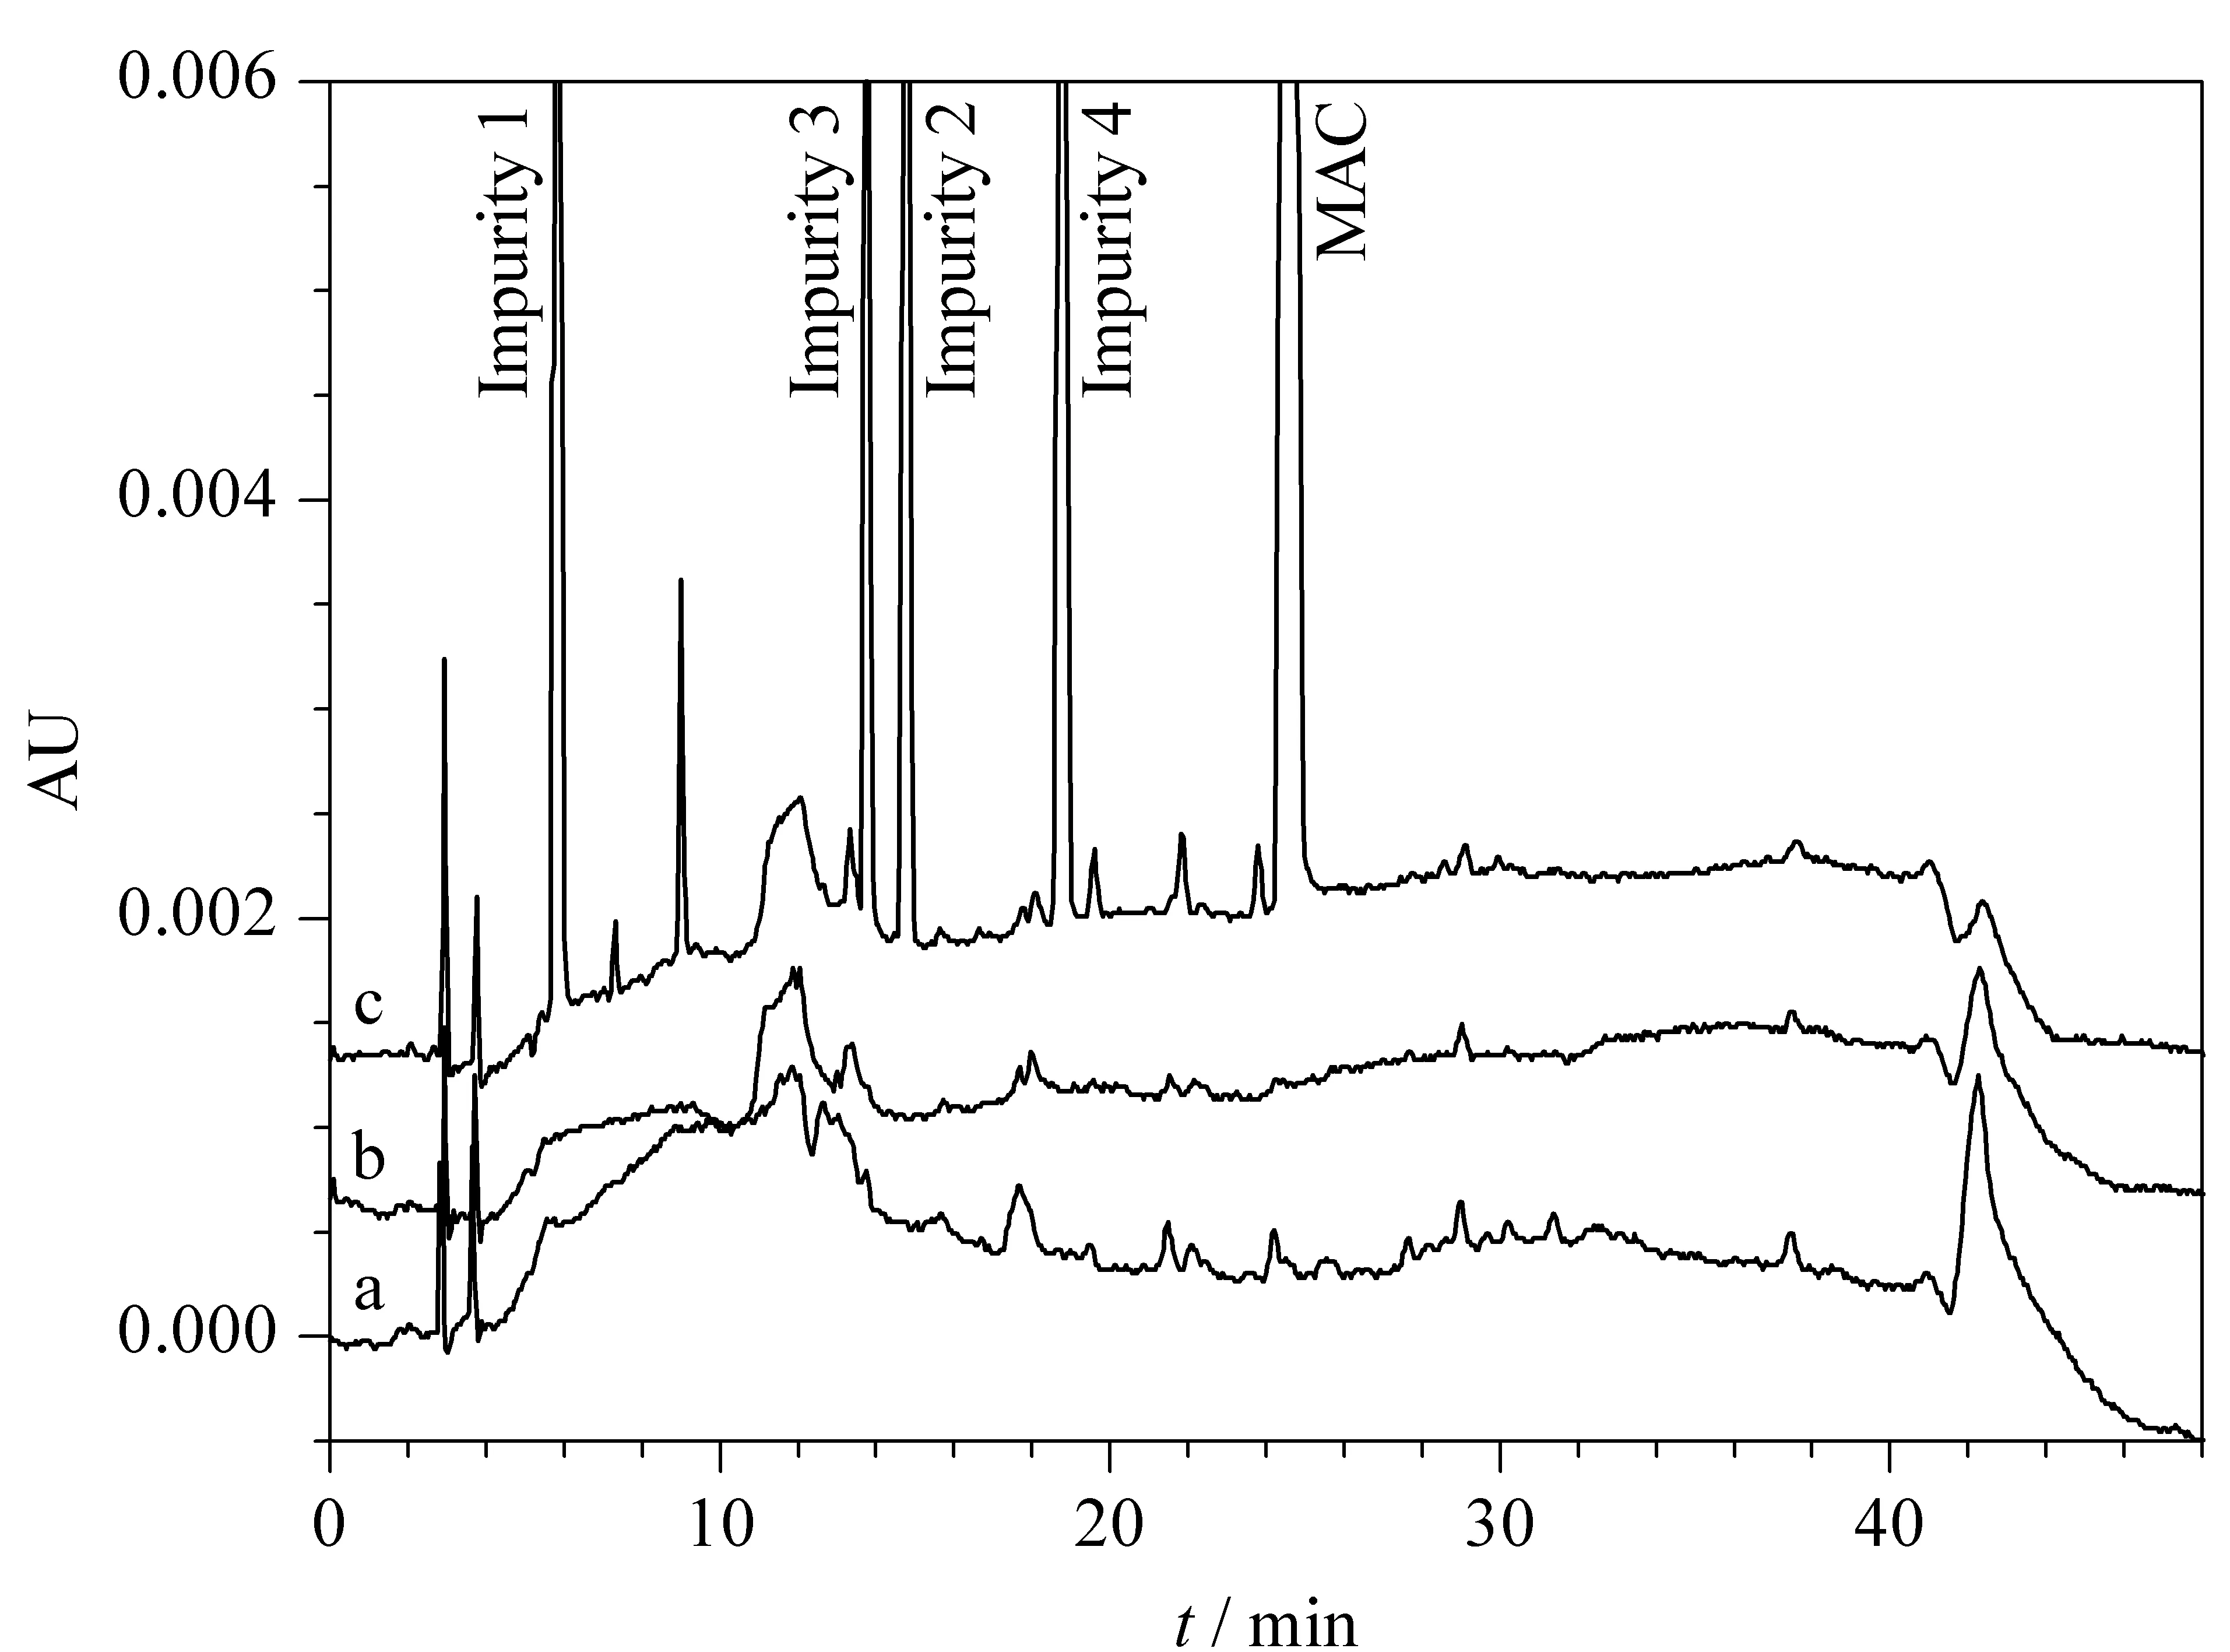
Fig. 8 HPLC chromatograms of MAC spiked with associated impurities in presence of (a) diluent (blank), (b) placebo and (c) MAC sample spiked with four known impurities
3.2.3Limit of quantification
LOQ is the minimum amount of analyte that can be quantitatively determined with precision and accuracy using the developed method. This can be determined by measuring the signal to noise (S/N) ratio (which should be>10) of different drug concentrations and impurity standard solutions. The minimum concentrations that can be detected with precision for MAC and its impurities was established at approximately 0.01% of 1 000 μg/mL with anS/Nratio of ≥ 10 as shown in Table 2.
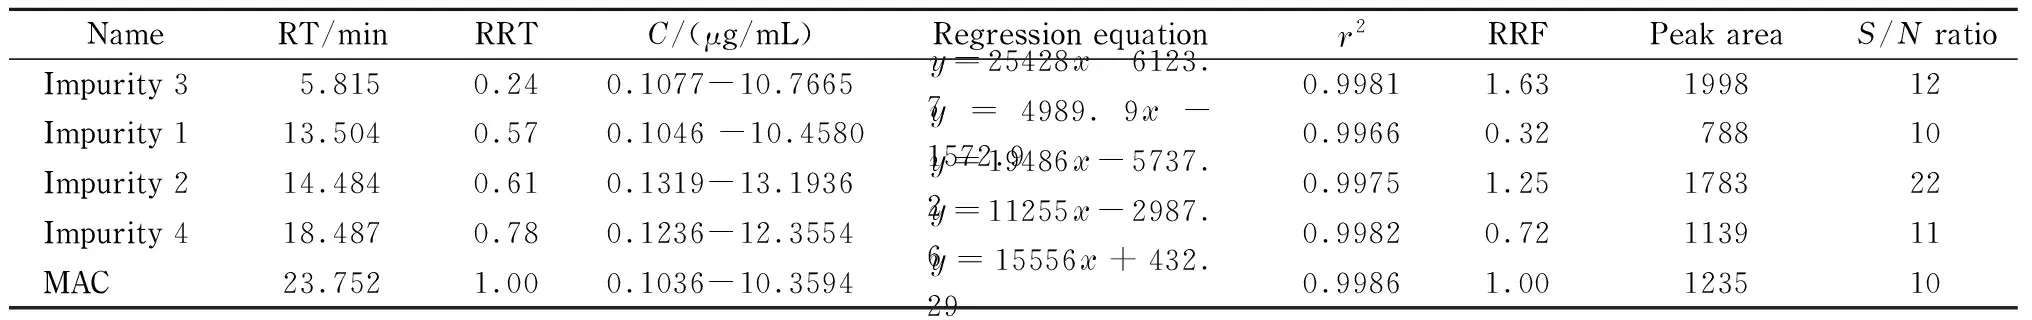
Table 2 Results of specificity, linearity and LOQ for MAC and its associated impurities
RT: retention time; RRT: relative retention time, RT of impurity peak/RT of MAC peak;C: mass concentrations with respect to 5 μg/mL limit level, 2.2% (LOQ)-215% for Impurity 3, 2.1% (LOQ)-209% for Impurity 1, 2.6% (LOQ)-264% for Impurity 2, 2.5% (LOQ)-247% for Impurity 4, 2.1% (LOQ)-207% for MAC;r2: regression correlation coefficient; RRF: slope of impurity/slope of MAC.
3.2.4Linearity
Linearity of the method was determined using different known concentrations of MAC (minimum of 6 points) ranging from quantification limit to 200%. For the analysis, the concentrations used were LOQ, 50%, 75%, 100%, 150% and 200% of standard drug solutions. A calibration plot of concentration vs. peak area was linear as shown in Fig. 9. The obtained results were subjected to statistical analysis using a linear regression model and the results were tabulated in Table 2. All samples showed linear behavior across the chosen concentration ranges.

Fig. 9 Calibration plot of MAC and its associated impurities in diluent using the peak area for concentrations in the range of LOQ to 200% of specification limit 0.5% (mass percentage)
3.2.5Accuracy and precision
Accuracy of the developed method is determined by measuring the amount of recovered samples by injecting or spiking known concentrations of impurities in the pure drug sample. The concentrations chosen for accuracy determination were LOQ, 100%, and 150%, specification limit as 0.5% (mass percentage), with three replicate measurements. The chromatograms for the spiked samples for accuracy determination were shown in Fig. 8 and the results are summarized in Table 3. Results showed that the developed method can successfully recover the injected impurities within the range of 85%-115%, which is more accurate than other reported methodologies [33,34].
Table3ResultsofaccuracyandprecisionofthedevelopedRP-HPLCmethodusingMACanditsassociatedimpuritiesintheconcentrationrangeofLOQ-150%ofspecificationlimit0.5% (masspercentage)

NameRecoveries/% (n=3)LOQ (0.01%)100%150%Overall mean (n=9)Overall RSD/% (n=9)Impurity 1115.098.899.6104.58.7Impurity 285.498.695.693.27.4Impurity 3100.295.394.196.53.4Impurity 493.4104.8101.199.75.8
3.2.6Solution stability with respect to temperature and time
The prepared stock solution of MAC and its associated impurities were found to be stable for 48 hours at < 10 ℃. Storage at room temperature (25 ℃) resulted in degradation within 2 hours, which was evident based on appearance of an unknown impurity peak at 23.7 min (RRT 0.97) as shown in Fig. 1. As such, all samples were run within 48 hours of storage at < 10 ℃, either in an auto-sampler or in a refrigerator.
3.2.7Robustness
To validate the robustness of the developed method, deliberate variations were made in the chromatographic conditions such as the flow rate ((1.0±0.1) mL/min), column temperature ((30±5) ℃), and the detection wavelength ((260±2) nm). The results from the validation process are summarized in Table 4. For all modified conditions, the peaks were highly resolved and there was no interference at the retention time of any of the known peaks. The elution order of the drug and the impurities followed the same order as the developed method condition. There were no significant changes in the elution times of the samples resulting from changes in column temperature or detection wavelength. However, changes in flow rate resulted in changes in retention time, with a flow rate of 1.1 mL/min resulting in earlier elution and a flow rate of 0.9 mL/min resulting in later elution. Changes in elution time did not result in interference. The method was found to be highly robust.
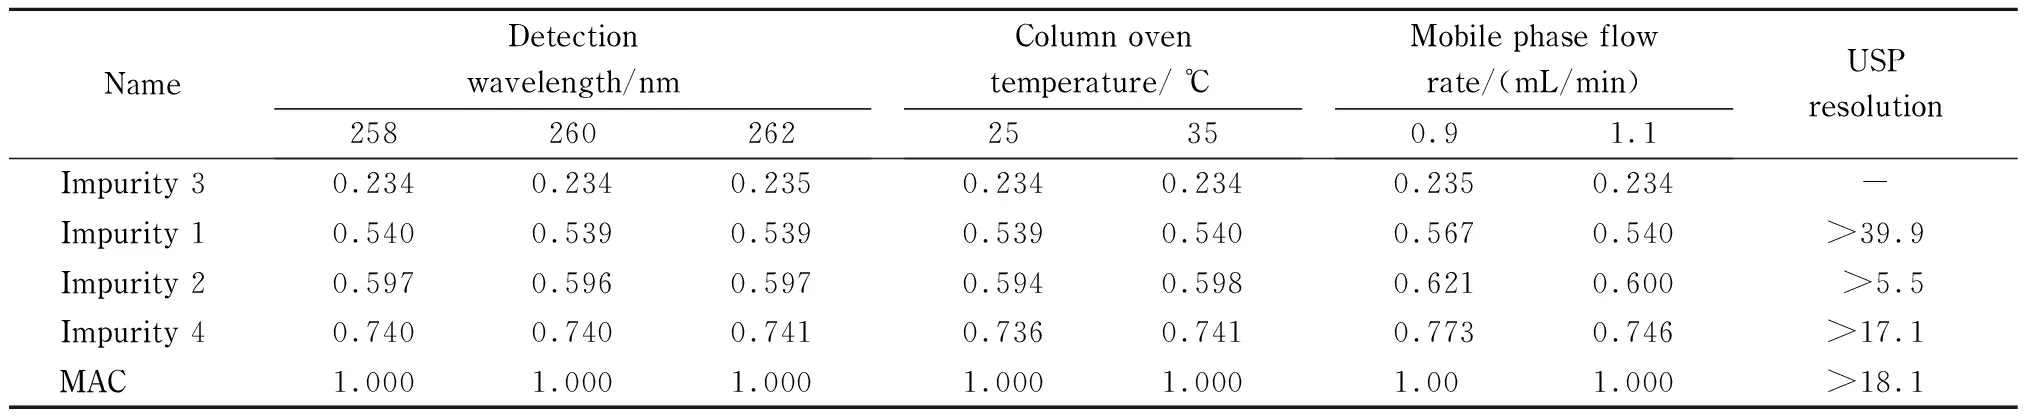
Table 4 RRT of related organic impurity peak vs. MAC peak
-: not applicable.
4 Conclusion
A stability-indicating RP-HPLC method was developed for quantitative determination of MAC and its impurities in tablet dosage forms. Chromatographic separation was performed by gradient elution with mobile phases composed of acidic 50 mmol/L ammonium formate (A) and acetonitrile (B) maintained at a flow rate of 1.0 mL/min and column temperature of 30 ℃. The developed gradient method successfully separated MAC and its associated impurities without interference from solvent or external conditions with a resolution of>2.0. The developed method was validated per ICH guidelines and the results met typical acceptance criteria. The method was linear (r2≥0.996 6) and accurate, as demonstrated by recoveries in the range of 85%-115% for MAC and its impurities, which was within the pre-defined acceptance criteria. MAC in tablet form was subjected to forced stress conditions including hydrolysis (acid/base/humidity), oxidation, thermolysis, and photolysis. Degradation results showed that MAC in tablet form was sensitive to acidic, alkaline, oxidative, and thermal conditions, but was stable under photolytic conditions. All stressed samples were assayed and mass balance was>96%, suggesting that all potential degradation products (Impurity 2, 4) and process impurities (Impurity 1, 3) can be detected by this method. The developed method is very simple and can be used to quantitate MAC and MAC-related impurities.
AcknowledgementThe authors thank the management of Sinotherapeutics Inc. for supporting this study.