规模奶牛养殖室外运动场春季温室气体与氨气排放特性
2018-11-23王朝元施正香李保明
刘 羽,刘 婕,王朝元,3,施正香,3,李保明,3
规模奶牛养殖室外运动场春季温室气体与氨气排放特性
刘 羽1,2,刘 婕4,王朝元1,2,3※,施正香1,2,3,李保明1,2,3
(1.中国农业大学水利与土木工程学院,北京 100083; 2. 农业农村部设施农业工程重点实验室,北京 100083; 3. 北京市畜禽健康养殖环境工程技术研究中心,北京 100083; 4. 山东省烟台市海阳招虎山省级自然保护区管理处,烟台 265100)
舍外运动场是中国传统奶牛养殖场的组成部分,同时也是温室气体和氨气(NH3)的重要排放源。由于开放式生产设施污染气体排放的监测难度大,目前中国还普遍缺少奶牛运动场温室气体和NH3排放通量的直接监测数据。该试验采用梯度法对北京地区春季典型开放式奶牛运动场的甲烷(CH4)、氧化亚氮(N2O)、二氧化碳(CO2)等温室气体和NH3浓度及其排放通量进行了监测分析,讨论了排放特征和关键影响因素,为获取中国北方地区奶牛运动场温室气体和NH3的排放通量提供了基础数据支撑。测试运动场饲养了52头荷斯坦奶牛,年均单产约8 t,头均占地面积为20.77 m2。结果表明,该奶牛运动场春季CH4、N2O和CO2的排放通量为155.59、3.60和4 869.37 mg/(m2·h),分别占温室气体排放总量的42.79%、9.37%和47.83%;NH3的排放通量为66.27 mg/(m2·h);排放峰值一般出现在运动场清粪之后。环境温度与CH4、N2O和NH3排放量呈显著的正相关关系(<0.05),同时风速在一定范围内会促进CH4、N2O和NH3的排放。奶牛场清粪活动不仅会加快污染气体的排放通量,还会影响温度和风速对气体排放通量的作用效果。
温室气体;氨气;排放控制;奶牛运动场;梯度法
0 引 言
农业生产活动所产生的温室气体和NH3是全球空气污染物排放的重要源头[1-2]。在中国,畜禽养殖业生产活动排放的CH4、N2O和CO2占总全国人为温室气体排放量的37%、65%和9%[3],而废弃物储存及管理过程是这些温室气体的主要来源[4],仅畜禽粪便产生的CH4即占农业温室气体排放量的15%[5]。北京市规模化奶牛场产生的主要温室气体为CH4和CO2,分为占温室气体总排放量的80.15%和11.24%[6]。畜牧生产过程中的NH3排放则会对生态环境产生重要影响,另外NH3还是细颗粒物(PM2.5)的前体物质,对中国东部地区PM2.5的贡献已达8%~11%[7]。工业化国家和地区大气中约有80%~90%的NH3排放来自于农业[8],而奶牛粪尿是其中的重点之一[9-11]。
在带有运动场的奶牛生产系统中,奶牛在运动场的活动时间长、粪尿排泄量大。袁慧军等[12]研究发现,残留在运动场上的粪便量约占整个奶牛场粪便总量的一半。因此,奶牛本身、清粪不彻底以及粪尿下渗等会造成运动场大量的温室气体和NH3排放。
欧美国家采用反演法等对运动场的污染气体排放进行过探索性的研究。Leytem等[13]对美国爱达荷州奶牛运动场的监测结果表明,CH4、N2O、CO2和NH3的排放通量分别为0.49、0.01、28.1和0.13 kg/(头·d),其中N2O、CO2和NH3排放占该场排放总量的57%、80%和78%。Borhan等[14]研究表明,奶牛运动场N2O、CO2和NH3的排放量分别占全场该气体产生量的72%、51%和63%~95%。
梯度法作为检测气体排放量的手段已有40多年的历史[15],梯度法具有不影响排放源小气候环境、可真实反映气体排放量与规律等显著特点,适用于开放性系统气体排放通量的检测[16-17]。1977年起,Denmead等[18]就开始采用该方法对NH3排放进行检测,之后科研人员在此基础上对梯度法进行了发展和优化。Griffith等[16]在已知气体排放速率的舍饲散养的奶牛舍内采用梯度法对CH4排放进行了检测,发现梯度法可较好地反映气体排放速率,检测偏差在10%以内。
运动场是中国传统奶牛场的标准配置,多采用三合土、立砖和混凝土地面,目前因为直接检测的难度大,仍然缺乏运动场温室气体和NH3排放的基础数据。同时,由于与西方国家在奶牛养殖模式、设施类型、粪便管理等存在明显差异,也无法直接采用欧美发达国家的研究数据预测国内奶牛运动场的污染气体排放。
本文采用梯度法对中国北京地区典型开放式奶牛运动场CH4、N2O、CO2和NH3的排放通量进行监测,并探究其排放特征和影响因素,为中国奶牛运动场温室气体和NH3的排放通量提供基础数据。
1 材料与方法
1.1 试验牛场
试验在北京延庆县某奶牛养殖中心进行(40.30°N,115.56°E),奶牛场平面布置图及试验运动场如图1所示。试验运动场位于养殖中心东南角,长40 m、宽27 m,共饲养52头荷斯坦泌乳奶牛,头均年单产约8 t,头均占地面积为20.77 m2。运动场为立砖地面,运动场每天下午02:00-04:00用铲车将表面粪便清理并集中堆放于运动场的西北角,之后通过清粪运输车运往奶牛场堆粪区自然堆放(如图1所示)。

1.堆粪场 2.青年牛舍 3.运动场 4.料库 5.宿舍 6.办公室7.挤奶厅 8.犊牛舍 9.隔离牛舍 10.低产牛舍 11.高产牛舍 12.气象站 13.门卫
a1,a2.测试区上边界1,2,b3,b4.下边界3,4
1.Waste storage area 2.Heifer barn 3.Open lot 4.Forage & feed storage 5.Accommodation for staff 6.Office building 7.Milking parlour 8.New born calve barn 9.Maternal cow barn 10.Low yield lactating cow barn 11.High yield lactating cow barn 12.Weather station 13.Gatehouse
a1, a2. Upwind boundary 1and 2; b3,b4. Downwind boundary 3 and 4
注:斜线标记区为试验运动场。
Note: Surveyed open lot is marked with cross lines.
图1 试验奶牛场平面示意图
Fig.1 Schematic diagram of surveyed dairy farm
1.2 试验装置构建与安装
梯度法利用质量平衡法原理,根据排放源的主导风向,将上风向处的边界定义为上边界,下风向处的边界定义为下边界,通过检测排放源不同高度处上下边界目标气体浓度差,采用质量差分法计算水平气流的扩散速率,气体的检测高度根据气体浓度分布和采样时间确定[18]。
北京市延庆县春季以东南风为主,按照梯度法测试要求,将运动场东侧和南侧定义为上风边界,西侧和北侧定义为下风边界。每个边界设置3个采样处以连续测试气体浓度,每个采样处设置3个高度的采样点,分别距地面1、2和3 m(图2)。
奶牛运动场气体浓度在线测量系统由采样模块、气路控制、气样分析和基础参数采集4部分构成。采样模块由采气管和光声谱气体监测仪(Photoacoustic Field Gas-monitor 1412i,LumaSense Technology,美国)构成,对温室气体和NH3浓度进行连续监测。通过自制的多路器系统作为气路控制模块实现在各个采样点之间的气路切换,并由光声谱气体监测仪完成气样分析和基础参数采集。

1. 3分路器 2.采样点 3.抽样管道 4. 12分路器 5.气体分析仪 6.气象站
自制的多路器系统包括1台12路多路器和12台3路多路器。每台多路器由电磁阀、继电器、Arduino Mega2560、安全开关、电线、气路等构成。每个采样处的3个采样点通过外径为6 mm的特氟龙管与1个3路多路器连接,并与12路多路器汇合,通过分路器将上风边界和下风边界处的气体分别输入2台气体监测仪中,以保证同时获得上下风边界相对位置采样点的气体浓度。因多路器中气泵流量为8 L/min,气体监测仪内部气泵流量为4 L/min,为防止过大的气流对气体监测仪内部气泵的损伤,故最终通过三通阀将多路器与光声谱气体监测仪连接。检测完的废气通过气管排至距离下风向边界20 m处。
1.3 气体浓度及环境参数监测方法
现场正式测试时间为2016年3月28日到2016年4月3日。3月28日-3月31日气体浓度采样时间为08:00-18:00,4月1日-4月3日气体采样时间从4月1日上午08:00开始到4月3日上午08:00结束,进行48 h的连续监测。
采样间隔为1 min,每个采样点连续监测3 min,梯度法1个采样循环周期为72 min。光声谱气体监测仪对CH4、N2O、CO2和NH3的测量精度分别为0.11、0.02、3.34和0.05 mg/m3。
将WS500-UMB气象站(WS500-UMB,8373.U01,德国Lufft测量控制技术有限公司,德国)立于运动场东南角对环境温度、湿度、气压、风速、风向等进行实时监测。WS500-UMB传感器距离地面5 m,保证其相同高度处10 m范围内没有遮挡物。气象站温度测试范围−40~60 ℃,精度±0.2 ℃;相对湿度范围0~100% RH,精度±2% RH;气压范围300~1 200 hPa,精度±1.5 hPa;风速范围0~60 m/s,精度±0.3 m/s;风向范围0~359.9°,精度<3°。
1.4 气体排放通量计算方法
本试验采用综合流梯度法对CH4、N2O、CO2和NH3的排放通量进行计算,计算式如下


为获取垂直高度距地面1、2和3 m处的实时风速和风向,本试验通过幂率公式推算各个高度处的风速,公式如式(2)[19]。

式中V和V分别为高度Z和Z处的风速,m/s;为风切变指数,取值0.19。
1.5 数据处理
如无特别说明,文中风速数据均为运动场上方1m处的测量值。试验数据采用Microsoft Excel软件进行数据整理,并用SPSS21.0软件分析。
2 结果与分析
2.1 运动场环境变化
运动场上温度、湿度和风速随时间变化情况如图3所示。试验期间奶牛运动场气温和相对湿度呈规律性的周期变化,范围分别为3~19 ℃和11%~56%。运动场上方1 m处风速变化范围为2.9~20.0 m/s。
试验期间大气压力变化范围为94.8~96.7 kPa,3月31日气压范围为94.8~95.3 kPa,为试验期间最低气压日,其他几天气压均大于95.3 kPa。
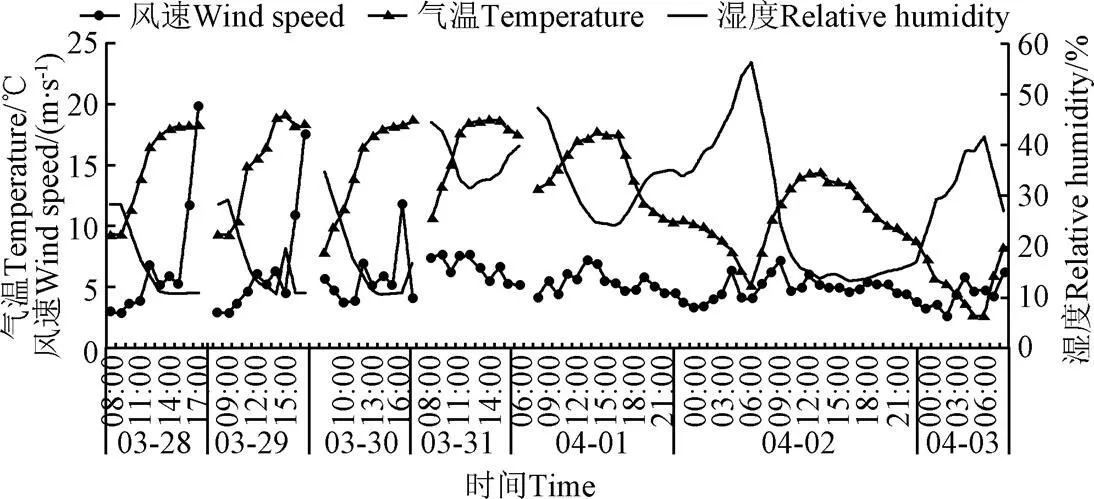
图3 运动场温度、湿度、风速变化情况
2.2 运动场温室气体、NH3排放通量
试验期间,运动场CH4、N2O、CO2和NH3的平均排放通量分别为155.59、3.60、4869.37和66.27 mg/(m2·h)(表1),换算成每头牛的日均排放量则为77.56、1.79、2 278.05和33.25 g/(头·d)。
试验期间运动场温度、湿度和风速变化平稳,气体排放通量总体比较稳定。3月31日的CH4、N2O和NH3的排放通量明显升高(<0.05),由图3可知当天的温度和湿度变化范围分别为10.8~18.8 ℃和31.4%~44.4%,在测试期间属于高温高湿天气,对粪污中污染气体的产生与排放产生了影响。运动场上的CO2主要来源于奶牛的呼吸,测试期间的温热环境处于奶牛舒适区,CO2排放通量没有明显变化。

表1 奶牛运动场CH4、N2O、CO2和NH3的排放通量
该结果中CH4、N2O和CO2的排放通量分别是Ding等[20]采用静态箱法对北京某奶牛运动场CH4、N2O和CO2的排放通量的3.6倍、2.6倍和1.7倍。主要是因为静态箱法仅能测得其所罩住的排放源(即残留的粪污)的气体排放通量,而梯度法所测气体排放通量为运动场粪污以及奶牛本身所产生的气体排放量之和。此外,Ding等[20]的试验布置9个测量点,测量点数量以及静态箱所覆盖地面上残留粪便量的差异也会对测量精度产生一定的影响。
运动场上的奶牛饲养密度以及粪便管理方式等,显著影响运动场气体排放量。Leytem等[13]对美国爱达荷州某奶牛运动场的测定结果表明,CH4、N2O和NH3的排放通量分别为52.91、7.5和98.33 mg/(m2·h)。CH4排放通量低于本试验监测结果,因为CH4主要来源于奶牛的胃肠道发酵[21-22],而测试运动场的每头牛占地面积为55.00 m2/头,高于本研究的20.77 m2/头,因此排放通量更低。另外,在Leytem等[13]试验中,工作人员每天会对奶牛运动场耙犁一遍,加快了粪便中N2O和NH3的排放,因此其排放均高于本试验结果。Borhan等[14,23]采用动态箱法对散养青年母牛运动场的N2O和CO2的排放通量进行了监测,其中N2O和CO2的排放通量分别为2.2~7.5 和2 824~5 392 g/(头·d),较本研究的N2O和CO2排放通量更高。分析认为,主要是因为其试验运动场每年仅清理2次粪污,粪尿的大量残留导致了更高的污染气体排放量。
2.3 运动场温室气体排放量
春季该奶牛运动场上通过奶牛生理活动和粪便发酵产生的CH4、N2O和CO2的排放量占比分别为42.79%、9.37%和47.83%,CH4和CO2的排放量占温室气体排放总量的比例相当。不同气体排放量占比会受到测试季节、饲养密度以及粪便管理制度等因素的影响。Ding等[20]的研究结果表明,奶牛运动场残留粪便全年的CH4、N2O和CO2的排放量所占比例分别为15.95%、18.75%和65.30%。Leytem等[13]对美国爱达荷州某牛场CH4、N2O和CO2的排放量进行了测算,该牛场每头牛占地面积为55.00 m2/头,并且每天对运动场耙犁一遍,测算得CH4、N2O和CO2的排放量比例分别为30.85%、5.96%和63.19%。此外,由于各个牛场使用的饲料因地区和季节不同而有所差异,因此推测CH4、N2O和CO2的排放量比例上的差异也可能与饲料成分有关。
2.4 环境因素对奶牛运动场气体排放通量的影响
2.4.1 温度对气体排放通量的影响
图4为4月1日至3日CH4、N2O、CO2和NH3的排放通量随温度变化的情况。统计结果显示,温度对CH4、N2O和NH3的排放通量有显著的正相关性影响(<0.05),而对CO2的影响不显著。崔晓东等[24]研究也发现温度与CO2排放通量相关性不显著。

图4 CH4、N2O、CO2和NH3的排放通量与温度变化规律
Fig.4 Emission rate of CH4, N2O, CO2and NH3related of temperature
Ding等[20]研究发现奶牛运动场上的温室气体在夏季排放速率最大,在冬季排放速率最小。说明温度对温室气体的产生有非常积极的影响。Pereira等[25-26]研究表明,当环境温度从5 ℃上升至35 ℃的过程中,CH4、N2O、CO2和NH3的排放通量明显增加。当温度低于10 ℃时,脲酶活性下降;当温度处于10~40 ℃时,脲酶活性升高[27]。脲酶活性增加会促进NH4+的生成,进而促进硝化作用和反硝化作用的进行,导致N2O产量的增大[26]。同时NH4+浓度的增加会使液相NH4+/NH3失衡,促使液态NH3转化为气态NH3[27]。随着温度的升高,微生物的生物活性和呼吸作用增加,加快了生物降解速率,促进了粪尿中挥发性脂肪酸等含有有机碳化合物的降解,导致CO2和CH4的产生量增加,从而提高气体的排放通量[28]。本试验后期,CO2排放量与温度变化趋势相反,可能与当时的奶牛活动有关。
2.4.2 风速对气体排放通量的影响
风速与气体排放速率有很强的相关性[29],会通过改变排放源表面传质系数而影响气体的排放[30]。表2列出了每天17:00时(运动场刚清完粪)所发生的不同风速条件下(距地面1 m处)奶牛运动场CH4、N2O、CO2和NH3的排放通量。这段时间,风速范围为4.05~18.85 m/s,CH4、N2O、CO2和NH3的排放通量范围分别为180.60~214.26、2.59~8.63、5 546.68~6 795.20及71.00~92.29 mg/(m2·h)。由表2可知风速对各个气体的排放通量有不同程度的影响。
当风速为4.05和4.75 m/s时,CH4和NH3的排放通量没有显著性差异(>0.05)。然而,当风速增大到5.16 m/s时,CH4和NH3的排放通量显著高于风速为4.75 m/s时的气体排放通量(<0.05)。在4.05~5.16 m/s的风速范围内,N2O的排放通量随风速的增加显著增加(<0.05)。当风速为18.85 m/s时,CH4、N2O和NH3的排放通量显著低于风速为5.16 m/s时的情况(<0.05)。虽然风速增大时,粪堆内外表面由于压差增大会促进气体的排放[31],但是随着风速的增大,粪堆表层水分的蒸发会加快,加速粪堆表面结痂,从而减少气体的排放[32]。风速对CO2的排放通量没有显著性影响(>0.05)。因为17:00时,奶牛场开始进行组织挤奶,大部分奶牛不在运动场,导致此时的CO2的排放通量贡献主要来自于运动场粪污发酵。
表2 不同风速条件下CH4、N2O、CO2和NH3的排放通量

Table 2 Emission rate of CH4, N2O, CO2 and NH3 under different wind speed
注:不同小写字母表示0.05水平差异显著。
Note: Different letters indicate significant difference at 0.05 level.
2.4.3 粪污管理制度对气体排放通量的影响
由图4可知CH4、N2O、CO2和NH3的排放通量会在17:00-18:00之间出现峰值,主要是因为该运动场每天15:00-16:30会进行清粪,新鲜粪尿的暴露会促进气体的排放。Leytem等[13]和Bjorneberg等[33]监测的奶牛运动场每天除了定时清粪以外,还会对运动场进行耙犁一遍,导致其测出的N2O、CO2和NH3排放通量高于本试验结果,也说明了清粪活动会加快气体的排放速率。Borhan等[14,23]的试验牛场每年仅清理2次粪污,大量的粪污滞留在运动场使温室气体和NH3的产量快速增加,从而提高气体的排放通量。说明过量或过少地清除运动场粪污对温室气体和NH3的排放都有很大的影响,合理的粪污管理制度对控制有害气体排放非常重要。
从图4还可看出每天气体排放通量峰值仅在清粪后(17:00后)出现,而在14:00-15:00之间当天的气温就会达到最高值,如果气体排放通量仅受温度影响,则其监测值应该先持续增长一段时间然后下降,但是在14:00-17:30之间气体排放通量持续增加,说明清粪活动在促进气体排放的同时也放大了温度对气体排放的影响。
此外,粪便管理制度也会改变风速对气体排放的影响效果。图5反映了奶牛运动场4月2日白天CH4、N2O、CO2和NH3的排放通量和风速的变化情况,由图5可看出运动场在下午清粪期间(15:00-16:30)风速持续下降,这本应该会降低气体的排放通量,但是气体排放通量却持续增加,说明清粪活动对气体排放通量的促进作用覆盖了风速对气体排放的影响效果。

图5 奶牛运动场4月2日CH4、N2O、CO2和NH3排放通量
3 结 论
本文通过对北京地区奶牛运动场春季温室气体和NH3的排放通量的现场测试,证明梯度法可应用于开放式系统的气体排放通量监测。结果表明,春季奶牛运动场CH4、N2O、CO2和NH3的排放通量分别为155.59、3.60、4 869.37和66.27 mg/(m2·h),在每天清粪之后出现排放峰值。环境温度显著影响CH4、N2O和NH3的排放量,风速在一定范围内会促进CH4、N2O和NH3的排放。奶牛场清粪活动不仅会加快气体的排放量,还会影响温度和风速对气体排放通量的作用效果。
[1] IPCC. Chapter 2: Changes in atmospheric constituents and in radiative forcing[M]//In Climate Change 2007: The Physical Science Basis; Contribution of Working Group I to the 4thAssessment Report of the Intergovernmental Panel on Climate Change. Cambridge University Press: New York, NY, USA, 2007.
[2] 曾承. IPCC第四次评估报告分组报告内容简介[J]. 地理教育,2008(1):封2-封3.
Zeng Cheng. A brief introduction to the IPCC fourth assessment report[J]. Education of Geography, 2008(1): F2-F3. (in Chinese with English abstract)
[3] 孟祥海,程国强,张俊飚,等. 中国畜牧业全生命周期温室气体排放时空特征分析[J]. 中国环境科学,2014,34(8):2167-2176. Meng Xianghai, Cheng Guoqiang, Zhang Junbiao, et al. Analyze on the spatial-temporal characteristics of GHG estimation of livestock’s by life cycle assessment in China[J]. China Environmental Science, 2014, 34(8): 2167-2176. (in Chinese with English abstract)
[4] 王悦,董红敏,朱志平. 畜禽废弃物管理过程中碳氮气体排放及控制技术研究进展[J]. 中国农业科技导报,2013,15(5):143-149.
Wang Yue, Dong Hongmin, Zhu Zhiping. Research progress on C, N related gas emissions and mitigation technology in animal waste management[J]. Journal of Agricultural Science and Technology, 2013, 15(5): 143-149. (in Chinese with English abstract)
[5] U.S. Environmental Protection Agency. Summary report: Global anthropogenic non-CO2greenhouse gas emissions: 1990-2030[R]. Washington, D C: Office of Atmospheric Programs, Climate Change Division, U.S. Environmental Protection Agency, 2012.
[6] 白玫,马文林,吴建繁,等. 北京规模化奶牛养殖企业温室气体排放评估[J]. 家畜生态学报,2017,38(5):78-85.
Bai Mei, Ma Wenlin, Wu Jianfan, et al. Evaluation on greenhouse gas emission of scale dairy farms in Beijing[J]. Acta Ecologiae Animalis Domastici, 2017, 38(5): 78-85. (in Chinese with English abstract)
[7] Wang S X, Xing J, Jang C, et al. Impactassessment of ammonia emissions on inorganic aerosols in EastChina using response surface modeling technique[J]. Environmental Science Technology, 2011, 45: 9293-9300.
[8] Lamarque J, Kyle G, Meinshausen M, et al.Global and regional evolution of short-lived radiatively-active gases and aerosols in the representative concentration pathways[J]. Climatic Change, 2011, 109: 191-212.
[9] Gupta A, Kumar R, Kumari K M, et al. Measurement of NO2, HNO3, NH3, SO2and related particulate matter at a rural site in Rampur, India[J]. Atmospheric Environment, 2003, 34: 4837-4846.
[10] Aneja V P, Roelle P A, Murray G C, et al. Atmospheric nitrogen compounds II: Emissions, transport, transformation, deposition, and assessment[J]. Atmospheric Environment, 2001, 35: 1903-1911.
[11] Mukhtar S, Mutlu A, Capareda S C, et al. Seasonal and spatial variations of ammonia emissions from an open-lot dairy operation[J]. Journal of the Air & Waste Management Association, 2008, 58: 369-376.
[12] 袁慧军,高志岭,马文奇,等. 应用反演式气体扩散技术测定奶牛场甲烷的排放特征[J]. 农业环境科学学报,2011,30(4):746-752.
Yuan Huijun, Gao Zhiling, Ma Wenqi, et al. Determination of methane emissions from a dairy feedlot using an inverse dispersion technique[J]. Journal of Agro-Environment Science, 2011, 30(4): 746-752. (in Chinese with English abstract)
[13] Leytem A B, Dungan R S, Bjorneberg D L, et al. Emissions of ammonia, methane, carbon dioxide, and nitrous oxide from dairy cattle housing and manure management systems[J]. Journal of Environment Quality, 2011, 40(5): 1383-1394.
[14] Borhan M S, CaparedaC S, MukhtarS, et al. Greenhouse gas emissions from ground level area sources in dairy and cattle feed yard operations[J]. Atmosphere, 2011, 2: 303-329.
[15] Mulhearn P J. Relations between surface fluxes and mean profiles of velocity, temperature and concentration, downwind of a change in surface roughness[J]. Quarterly Journal of the Royal Meteorological Society, 1977, 103(438): 785-802.
[16] Griffith D W T, Bryant G R, Hsu D, et al. Methane emissions from free-ranging cattle: Comparison of tracer and integrated horizontal flux techniques[J]. Journal of Environment Quality, 2008, 37(2): 582-591.
[17] Denmead O T, Harper L A, Freney J R, et al. A mass balance method for non-intrusive measurements of surface-air trace gas exchange[J]. Atmospheric Environment, 1998, 32(21): 3679-3688.
[18] Denmead O T, Simpson J R, Freney J R. A direct field of measurement of ammonia emission after injection of anhydrous ammonia[J]. Soil Science Society of America Journal, 1977, 41: 827-828.
[19] 王竞,马风友. 不同风速推算方法的研究[J]. 硅谷,2011,24:192-193.
[20] Ding L Y, Lu Q K, Xie L N, et al. Greenhouse gas emissions from dairy open lot and manure stockpile in northern China: A case study[J]. Journal of the Air & Waste Management Association, 2016, 66(3): 267-279.
[21] Sejian V, Lal R, Lakritz J, et al. Measurement and prediction of enteric methane emission[J]. International Journal of Biometeorology, 2011, 55(1): 1-16.
[22] 国家发展和改革委员会应对气候变化司. 中华人民共和国气候变化第二次国家信息通报[M]. 北京:中国经济出版社,2013.
[23] Borhan M S, Capareda C S, Mukhtar S, et al. Determining seasonal greenhouse gas emissions from ground-level area sources in a dairy operation in Central Texas[J]. Journal of the Air & Waste Management Association, 2011, 61: 786-795.
[24] 崔晓东,任康,朱法江,等. 夏季奶牛场污水覆膜存储池温室气体排放分析[J]. 农业工程学报,2018,34(9):210-215.
Cui Xiaodong, Ren Kang, Zhu Fajiang, et al. Greenhouse gas emission from covered wastewater storage tank on dairy farm in summer[J]. Transactions of the Chinese Society of Agricultural Engineering (Transactions of the CSAE), 2018, 34(9): 210-215. (in Chinese with English abstract)
[25] Pereira J, FangueiroD, Misselbrook T H, et al. Ammonia and greenhouse gas emissions from slattedand solid floors in dairy cattle houses: A scale modelstudy[J]. Bioprocess and Biosystems Engineering, 2011, 109:148-157.
[26] Pereira J, Misselbrook T H, Chadwick D R, et al. Effects of temperature and dairycattle excreta characteristics on potential ammonia andgreenhouse gas emissions from housing: A laboratorystudy[J].Bioprocess and Biosystems Engineering, 2012, 112: 138-150.
[27] Sommer S G, Zhang G Q,Bannink A,et al. Algorithms determining ammonia emission from buildings housing cattle and pigs and from manure stores[J]. Advances in Agronomy, 2006, 89: 261-335.
[28] Møller H B, Sommer S G, Ahring B K. Biologicaldegradation and greenhouse gas emissions during pre-storageof liquid animal manure[J]. Journal of Environmental Quality, 2004, 33: 27-36.
[29] Redeker K R, Baird A J, Teh Y A. Quantifying wind and pressure effects on trace gas fluxes across the soil-atmosphere interface[J]. Biogeoscience, 2015, 12: 7423-7434.
[30] Monteny G J, Erisman J W. Ammonia emission from dairy cow buildings: A review of measurement techniques, influencing factors and possibilities for reduction[J]. Netherlands Journal of Agricultural Science, 1998, 46: 225-247.
[31] Widén B, Lindroth A. A calibration system for soil carbon dioxide-efflux measurement chambers: Description and application[J]. Soil Science Society of America Journal, 2003, 67(1): 327-334.
[32] 王业健. 奶牛粪便自然堆放过程中温室气体和氨气排放模拟试验研究[D]. 北京:中国农业大学,2016.
Wang Yejian. Experimental Study on the Emissions of GHG and Ammonia from Stockpiled Dairy Manure[D]. Beijing: China Agricultural University, 2016. (in Chinese with English abstract)
[33] Bjorneberg D L, LeytemA B, Westermann D T, et al. Measurement of atmospheric ammonia, methane, and nitrous oxide at a concentrated dairy production facility in Southern Idahousing open-path FTIR spectrometry[J]. Transactions of ASABE, 2009, 52(5): 1749-1756.
Emission characteristic of greenhouse gases and ammonia from open lot of scale dairy farm in spring
Liu Yu1,2, Liu Jie4, Wang Chaoyuan1,2,3※, Shi Zhengxiang1,2,3, Li Baoming1,2,3
(1.100083,; 2.100083,; 3.100083,; 4.265100)
Climate change is currently a global concern, which is mainly caused by excessive emission of greenhouse gases to the atmosphere, in particular the emission of CH4, N2O and CO2from agricultural production process. Greenhouse gas produced from manure management in livestock and poultry production is an important source of greenhouse gas emission. Besides, fermentation process of animal manure may generate large amount of NH3, which is considered as an important contaminant gas to the environmental and ecological system. Among agricultural sector, dairy farm is a big source of greenhouse gas and NH3emission. In China, a barn with a fully open lot, where the cows are freely accessible, is a typical operation for dairy cattle. Manure on the surface of the open lots is typically removed from days to weeks depending the climate and management in the farms, while the remained manure, liquid penetration and the cows on the lot are important sources of contaminated gas emissions. However, there are few field studies on the emissions from the lot because of its open characterization, relative low gas concentration and the potential impact on the daily management of the farms. In this paper, an integrated horizontal flux method, based on the mass balance principle, was used to calculate the emission fluxes of CH4, N2O, CO2and NH3from a typical dairy open lot in Beijing in spring season by continuous measurement of their concentrations with the purpose to provide fundamental information on the emissions. As the emission source, the open lot, which was 40 m in length by 27 m in width and kept with 52 milking cows, was divided into upwind boundary and downwind boundary according to the dominating wind directions. The emission rate was calculated based on the concentration differences of the target gases continuously measured from the upwind and downwind boundaries at three different heights of 1, 2 and 3 m by a photoacoustic field gas-monitor (INNOVA 1412i) and self-developed multiplexer. The results showed the overall emission rates of CH4, N2O, CO2and NH3from the dairy open lot were 155.59, 3.60, 4 869.37 and 66.27 mg/(m2·h) during the field measurement, respectively. The emissions of all the gases reached their daily peaks after manure removal in late afternoon. The emissions of CH4, N2O and CO2(based on CO2equivalents) of the open lot accounted for 42.79%, 9.37% and 47.83% of the total greenhouse gases emissions, respectively; and their proportions were related to the climate, manure management strategies of the lot, and feed in gredients as well. Additionally, CH4, N2O and NH3emission rates were significantly and positively affected by ambient temperature (<0.05). CH4, N2O and NH3emission rates could also be enhanced by wind speed within some limits. When the surface wind speed was around 5.16 m/s, which was measured on the point 1 m above the ground, the emissions of the three gases were significantly differed from those under 4.05 and 4.75 m/s (<0.05). While, when the wind speed was at 18.85 m/s, the emission rates were decreased, which could be explained by the crust formed on the manure surface due to the drying process under much higher wind speed and its prevention on the emissions. Besides, manure removal activity increased the emissions of gases, and the impacts of ambient temperature and wind speed on the gas emission may also be altered to some extent.
greenhouse gases; ammonia; emission control; dairy open lot; integrated horizontal flux method
刘 羽,刘 婕,王朝元,施正香,李保明. 规模奶牛养殖室外运动场春季温室气体与氨气排放特性[J]. 农业工程学报,2018,34(22):178-184. doi:10.11975/j.issn.1002-6819.2018.22.022 http://www.tcsae.org
Liu Yu, Liu Jie, Wang Chaoyuan, Shi Zhengxiang, Li Baoming. Emission characteristic of greenhouse gases and ammonia from open lot of scale dairy farm in spring[J]. Transactions of the Chinese Society of Agricultural Engineering (Transactions of the CSAE), 2018, 34(22): 178-184. (in Chinese with English abstract) doi:10.11975/j.issn.1002-6819.2018.22.022 http://www.tcsae.org
10.11975/j.issn.1002-6819.2018.22.022
S815.4
A
1002-6819(2018)-22-0178-07
2018-05-29
2018-09-29
国家自然科学基金(31472132、31172244)、国家奶牛产业技术体系(CARS-36)
刘 羽,博士生,研究方向为设施畜禽养殖环境与控制。 Email:xiaohaizhibei@cau.edu.cn
王朝元,教授,博士生导师,研究方向为设施畜禽养殖过程控制与环境。Email:gotowchy@cau.edu.cn
中国农业工程学会高级会员:王朝元(E041200616S)