基于SPI判定的东北春玉米生长季干旱对产量的影响
2018-11-23李祎君宋迎波
刘 维,李祎君,何 亮,宋迎波
基于SPI判定的东北春玉米生长季干旱对产量的影响
刘 维,李祎君,何 亮,宋迎波※
(国家气象中心,北京 100081)
为了研究东北地区干旱对春玉米产量变化的影响机制,选用标准化降水指数(standardized precipitation index,SPI)作为干旱的判断标准,利用东北地区春玉米历史产量资料构建相对气象产量残差(standardized yield residuals series,SYRS),结合春玉米干旱受灾率,分析了东北地区春玉米全生育期干旱和产量变化特征,以及干旱对春玉米产量影响的变化规律。结果表明:1)年际间降水量的波动导致东北地区玉米单产不稳定,辽宁和内蒙古东部受旱的程度及年数均远高于黑龙江和吉林,玉米成灾率和生长季降水距平百分率呈现明显负相关。2)20世纪80至90年代中期出现干旱的年份较少;而从90年代后期至2015年干旱年变多。3)2000年之前,黑龙江、吉林和内蒙古东部3省区相对气象产量残差SYRS从负值向正值波动提升,在90年代中后期达到历史最高,进入2010年以后,SYRS普遍处于正常水平;辽宁省SYRS呈现年际间波动大的特征。4)东北四省区SPI6与SYRS满足向下的抛物线趋势,当降水量处于正常略偏多的情形下,东北4省区产量能达到高产的水平;当SPI6处于干旱或者过湿的情况下,将处于低产量水平。
干旱;作物;春玉米;东北地区;标准化降水指数;产量
0 引 言
在全球变暖背景下,中国极端干旱事件频繁发生[1],尤其是东北地区干旱有所发展[2],特别是20世纪90年代中期以后,东北气候呈现明显的干燥化趋势[3-5];而东北地区又是中国重要的商品粮基地和优质玉米生产出口基地,在全国粮食安全生产中占有十分重要的比例[6]。东北地区干旱增多加强的趋势势必会对中国粮食安全造成严重的危害。揭示干旱与产量波动的关系,对防旱抗旱、提高粮食产量,保障粮食安全有重要意义。作为一种气象干旱的评价指标,标准化降水指数(standardized precipitation index,SPI)计算简单,降水资料容易获取,而且计算结果与指数有极好的一致性[7],在不同地区和时间段都能有效地反映旱涝状况。众多学者也利用标准化降水指数SPI对中国不同地区干旱进行了系统的研究,从干旱强度发生频率、时空分布特征、干旱风险区划、干旱预测等方面取得众多的研究成果[8-15]。吴晶等[16]利用随机森林模型结合SPI干旱指标进行月度干旱预测,且准确率高于气候模式。马建勇等[17]基于SPI与相对湿润度指数研究了东北地区5-9月的干旱趋势分析,发现极端干旱发生频率增加幅度明显高于一般干旱;但是由于东北地区玉米一般在4月中旬至5月上旬播种[18],4月份的降水对也玉米播种尤为重要。刘彦平等[19]利用SPI作为干旱评判指标,分析了泾惠渠灌区干旱的变化特征,及其对冬小麦气候产量的变化。明博等[20-21]利用分析了SPI的时空演变特征,并研究了干旱特征变化及其对作物产量的不同影响。上述研究都表明SPI在一定程度上能够同作物减产率建立相应的定量关系。但目前研究的作物主要集中在夏玉米和冬小麦上,利用SPI研究东北春玉米干旱与产量的研究仍较少。综合来看,利用标准化降水指数能够反映东北地区干旱的特征,但多数是从气候角度和多尺度的角度来研究,或者结合单一的受旱面积、受灾站次比等;同时结合东北地区春玉米4-9月完整生长季、春玉米产量波动和玉米受灾程度变化的研究还较少;加之干旱与产量波动相互关系仍然不明确。因此本文拟利用东北地区9月份的SPI来评价4至9月春玉米生长季的干旱程度,同时研究SPI与玉米受旱程度、玉米产量波动的变化规律,以期得到利用SPI来评价干旱对玉米产量的影响。
1 材料与方法
1.1 研究区域概况
东北地区包括黑龙江、吉林、辽宁3省以及内蒙古东北部的赤峰市、通辽市、兴安盟和呼伦贝尔市。该区属于温带大陆性季风气候,冬天时间长温度低,夏季时间短气候湿润,东部地区年降水为400~700 mm,西部为250~400 mm,年平均温度为−4~12 ℃。该区域种植制度为一年一熟,4月至9月是玉米、一季稻、大豆等作物的适宜生长季。
1.2 研究方法
1.2.1 标准化降水指数
标准化降水指数(SPI)是用来表征某时段降水量出现的概率多少的指标,是国际上最常用的干旱指数之一,它可以反映多时间尺度的干旱;如1、3、6、12、24个月等,分别用SPI1、SPI3、SPI6、SPI12、SPI24等来表示。SPI1 可以监测每月水分变化,SPI3和SPI6可用于监测季度水分变化,SPI12、SPI24可监测年尺度的水分亏缺状况。该方法采用Gamma函数拟合降雨时间序列,然后再经标准化求得SPI[18,22-24],最终采用标准化降水累积频率分布来划分干旱等级(表1)。
SPI计算公式为

()为给定降水时段概率密度,由不完全分布概率密度函数积分求得,计算公式为

式中为形状参数,为尺度参数,两者采用极大似然估计方法求得。由于东北地区春玉米生长季在4月至9月,因此采用9月份的SPI6作为生长季时间尺度进行分析。本研究利用站点的降水量按照算术平均计算地区的降水量,其后用于计算各省区的SPI。

表1 SPI干旱等级
1.2.2 玉米产量
一般来说作物产量受到作物品种改良、科技水平提升、种植制度改变、气候变化等因素的影响,近年来作物产量倾向于一个增加的趋势[25]。为了预测作物产量,国内许多研究者在建立农业产量预报模型时,大多将随机“噪声”略去,将作物统计产量简化为趋势产量与气象产量之和,而实际中经常用相对气象产量来表征气象条件对作物单产的影响[26-29]
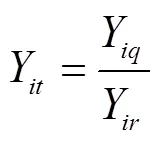
Y=Y+Y(3)

式中Y为统计产量,kg/ hm2;Y为气象产量,kg/hm2;Y为趋势产量,kg/hm2;Y由实际产量与年份拟合的方程得出,Y表示相对气象产量。由于SPI指数为无量纲指数,因此利用Y的残差作为比较的对象[30]。

式中SYRS(standardized yield residuals series)为相对气象产量残差,SYRS值越大,表明气象产量越高;反之,表明气象产量低[25];本研究中当SYRS大于0.5时为高产,小于−0.5时为低产,两者之间为正常年份。为相对气象产量的平均值,为相对气象产量的标准差,其中和越小,表示实际产量与年份拟合的方程效果越好,本文中辽宁和黑龙江为线性拟合,吉林和内蒙古东部为二次曲线拟合。
1.2.3 干旱成灾率
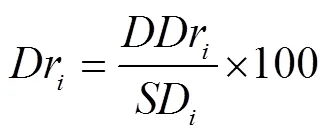
由于没有春玉米受旱面积,因此利用农业部种植业管理司分省粮食作物干旱成灾面积与粮食播种面积的百分比表示作物受旱程度,用成灾率Dr来表示干旱程度,由于东北地区旱地粮食作物主要为玉米和大豆,可用成灾率Dr表示干旱对单一作物的影响。

式中Dr为玉米成灾率,%;DDr为粮食作物成灾面积,hm2;SD为粮食作物播种面积,hm2。
1.3 数据来源
气象资料为1981-2015年黑龙江、吉林、辽宁、内蒙古东部(东四盟)共计77个农业气象观测站(图1)的日值数据,包括日降水量、日平均气温等常规气象要素数据,该资料来源于国家气象中心农业气象中心。春玉米种植面积、单位产量以及干旱成灾面积等来源于农业部种植业管理司,该数据资料统计时段为1981-2015年。

图1 东北地区春玉米观测站点分布
2 结果与分析
2.1 春玉米产量与成灾率
1981年以来,随着品种更新、农业种植水平的提高,东北地区春玉米单产呈现稳步上升的态势。但是由于东北地区气候特点,农作物生产以雨养农业为主,4月至9月春玉米基本依靠自然降水满足其正常的生长发育,年际间降水量的波动导致玉米单产不稳定,降水量少的年份单产明显下降。通过产量分离后得出的气象产量,能在一定程度上反映当年春玉米生长季中气象条件的优劣。从表2可知,辽宁省决定系数2明显低于其他3省,主要是由于该省年际间产量波动明显,相隔年份单产最大差值达到2 500 kg/hm2,而从和来看,产量分离拟合的效果较好。分析玉米成灾率和生长季降水距平百分率来看,两者呈现明显的负相关,绝对值都在0.5以上,尤其是辽宁省为0.76。辽宁和内蒙古东部35 a中分别有14 a和18 a玉米Dr≥20%,而黑龙江和吉林分别只有6 a和8 a。值得注意的是21世纪头10年4省玉米r≥20%的年份明显高于其他年代,这同图2中降水的变化趋势基本类似,表明降水的减少给玉米生长带来了明显的不利影响。

表2 东北地区玉米产量分离结果及成灾率≥20%的年份
注:为相对气象产量的平均值;为相对气象产量的标准差;为降水距平百分率与成灾率的相关系数。
Note:means the average of relative meteorological yield;means the standard deviationof relative meteorological yield;means the correlation coefficient between the percentage of precipitation departure and suffering disaster rate (Dr).
2.2 东北地区SPI6时间特征
1981年以来,东北4省区4月至9月春玉米生长季降水量年际间波动大,但总体上呈现缓慢减少的态势[31-32],尤其是内蒙古东部春玉米产区降水量减少趋势明显,辽宁省减小趋势最小。分析SIP6的年代变化特征可以看出(图2),20世纪80至90年代中期SPI6以正值为主,出现干旱的年份较少,仅1982和1989年为典型的干旱年型,4省区SPI6值都处于轻旱标准以上;而从90年代后期至今,SPI6以负值为主,尤其是1999−2004年这5年,各省区的SPI6平均值都处于中旱标准以上,处于明显的干旱时段,这也同降水距平百分率的变化一致,且4省区相关系数都在0.99以上。

图2 1981−2015年各省区SPI6年代变化特征和 4-9月降水量距平百分率
2.3 相对气象产量残差SYRS特征分析
分析4省区的相对气象产量残差SYRS可以看出(图3),整体上各省区年际间波动差异较大。2000年之前,黑龙江、吉林、内蒙古东部3省区相对气象产量残差SYRS呈现从负值向正值波动提升的特点,在90年代中后期达到历史最高;而2000年以后3省区SYRS普遍处于正常年份到偏低年份的态势;进入2010年以后,SYRS普遍处于正常水平。辽宁省SYRS则呈现波动幅度较大的特点,同产量的变化趋势基本保持一致(图4),总体上以正常到偏高的变化为主。

图3 1981−2015年东北地区相对气象产量残差SYRS变化特征

图4 辽宁省历史产量和相对气象产量残差SYRS频率分布规律
2.4 干旱对玉米成灾率的影响
对SPI6和玉米成灾率分析后发现(图5),成灾率Dr随着SPI的变大而变小,在SPI大于1时,成灾率普遍小于10%。但在内蒙古东部当SPI值偏大时,有3 a的成灾率也在30%以上,说明过湿也会导致玉米成灾。而当只考虑在干旱等级标准下时,东北4省区的成灾率2的斜率明显高于1。黑龙江省干旱成灾率程度明显低于其他3省区,最大的成灾率在30%左右,而辽宁和吉林最大的超过60%。

注:y1表示全部成灾率拟合,y2表示干旱条件下成灾率拟合(SPI6≤-0.5.)。
从SPI6与各省区的残差SYRS的关系可以看出(图6),4省区基本上满足向下的抛物线趋势,随着SPI从低到高,作物的SYRS也是从低值到最高值再下降的趋势,且各省的抛物线最高值对应的SPI基本上在0.5左右摆动,表明当降水量处于正常略偏多的情形下,此时的东北4省区产量能达到高产的水平。除了黑龙江拟合效果一般外,其余3省区拟合效果均较好。当SPI处于正常偏旱或干旱的情况下,作物处于一个低产的水平,且随着SPI的减小产量降低。
2.5 SPI过湿对玉米产量的影响
由图6可知,当SPI处于过湿的情况下,产量水平也将下降,但下降的水平没有干旱的严重,这主要是由于降水量变多,相应的气温和日照时数会下降,东北地区玉米除了受降雨影响外,气温也对产量有一定的影响,严重的情形下会出现低温冷害灾害,不利于玉米产量的形成。分析SPI后发现,4省区总共有29 a出现SPI大于1的年份,其中残差小于−0.5即低产的年份有8 a,这8 a中降水距平百分率偏高都在17%以上,有7年≥10 ℃积温低于常年值,偏低在−38至−185(℃·d)之间,仅一年积温偏高(表3),这也表明了降水偏多、积温偏少也会导致产量下降。

图6 东北地区SPI6与SYRS的关系

表3 东北地区SYRS<−0.5下降水距平百分率和≥10 ℃积温距平特征
3 讨 论
目前干旱的划分主要有气象干旱、农业干旱、水文干旱和社会经济干旱[31],且各类干旱之间密切相关,同时差异显著。玉米受灾导致产量下降应该归结为农业干旱,但是降水量的亏缺造成最先出现气象干旱,随后导致农田土壤湿度下降,而当正好处于作物生育期内,就容易造成作物减产从而产生农业干旱,因此从本质上说农业干旱是由气象干旱持续一段时间而引发的。而由于评价农业干旱的指标往往是由农田土壤含水量、作物发育期、降水量、遥感监测等多尺度多方法的集成,运算量大、资料获取难度较高。而作为一种简单常用的气象干旱指标,SPI仅需要降水资料就能计算使用,方便运算;但SPI只考虑了单一的降水因子,没有考虑作物等下垫面的影响,尤其是作物不同生育期对水分的需求也是不同的。因此本文利用4-9月全生育期的6个月降水量来分析SPI与产量的关系,一定程度上规避了SPI对农业干旱评价的不精确。
由于受降水年际间波动大的影响,东北各省区粮食单产波动较大,产量分离的时候有一定的不确定性,因此利用相对气象产量和相对气象产量残差SYRS能够有效减小误差,从而更好的揭示SPI6对产量的影响。当然,东北地区年际间产量波动除了受降水影响以外,其他气象条件,比如霜冻、低温冷害等也是造成产量下降的原因,但是由于受全球变暖趋势影响,东北地区生长季热量资源增加,水资源减少趋势,霜冻害、低温冷害、寒潮等农业气象灾害减少,但仍然对玉米、水稻等作物产量形成影响较大[32-35]。但需要注意的是,由于缺少各省玉米实际的受灾程度统计,利用粮食作物受旱程度来反推玉米受旱程度,有一定的误差。
本文利用SPI较为准确的描述东北地区年际和年内的波动变化,再结合玉米受旱程度和产量变化趋势,能够较好的反应出干旱对玉米生长的不利影响,一定程度上揭示玉米生育期降水量对产量的影响,对农业气象业务中产量预报、灾害评估提供方法。
4 结 论
1)东北地区玉米成灾率和生长季内的降水距平百分率呈现明显的负相关,辽宁和内蒙古东部受旱的程度和年份远大于黑龙江和吉林。东北地区SPI6年际间波动显著,20世纪90年代中期之前干旱的年份较少;90年代中后期开始,辽宁、黑龙江、内蒙古东部生长季内降水量明显偏少,干旱年份增多。
2)玉米成灾率随着SPI6的变大而变小,黑龙江成灾率程度明显低于其他3省区。东北4省区SPI6与SYRS满足向下的抛物线趋势,相对气象产量残差(SYRS)随着SPI6从低到高呈现先升高再下降的趋势,且抛物线的最高值对应的SPI6基本上在0.5左右摆动。而当SPI6处于过湿的情况下,降水量和降雨日数增多导致积温下降,也会对产量有一定的影响。
[1] 李忆平,李耀辉. 气象干旱指数在中国的适应性研究进展[J]. 干旱气象,2017,35(5):709-723.
Li Yiping, Li Yaohui. Advances in adaptability of meteorological drought indices in China [J]. Journal of Arid Meteorology, 2017, 35(5): 709-723. (in Chinese with English abstract)
[2] 李宝林,周成虎. 东北平原西部沙地的气候变异与土地荒漠化[J]. 自然资源学报,2001,16(3):234-239. Li Baolin, Zhou Chenghu. Climatic variation and desertification in west sandy land of Northeast China Plain[J]. Journal of Natural Resources, 2001, 16(3): 234-239. (in Chinese with English abstract)
[3] 孙力,沈柏竹,安刚. 中国东北地区地表干湿状况的变化及趋势分析[J]. 应用气象学报,2003,14(5):542-552.
Sun Li, Shen Baizhu, An Gang. A study of the variation and the tendency of surface dry and wet state of Northeast area in China[J]. Journal of Applied Meteorological Science, 2003, 14(5): 542-552. (in Chinese with English abstract)
[4] 谢安,孙永罡,白人海.中国东北近50年干旱发展及对全球气候变暖的响应[J]. 地理学报,2003,58(增刊):75-82.
Xie An, Sun Yonggang, Bai Renhai. Arid climate trend over Northeastern China and its response to global warming[J]. Acta Geographica Sinica, 2003, 58(Suppl.): 75-82. (in Chinese with English abstract)
[5] 马柱国,任小波. 1951-2006年中国区域干旱化特征[J].气候变化研究进展,2007,3(4):195-201.
Ma Zhuguo, Ren Xiaobo. Drying trend over China from 1951 to 2006[J]. Advances in Climate Change Research, 2007, 3(4): 195-201. (in Chinese with English abstract)
[6] 刘维,侯英雨,吴门新,等. WOFOST模型在东北春玉米产区的验证与适应性评价[J].气象与环境科学,2017,40(3):7-13.
Liu Wei, Hou Yingyu, Wu Menxin, et al. Validation and adaptability evaluation of WOFOST model in spring maize area of northeast[J]. Meteorological and Environmental Sciences, 2017, 40(3): 7-13. (in Chinese with English abstract)
[7] 韩海涛,胡文超,陈学君,等. 三种气象干旱指标的应用比较研究[J]. 干旱地区农业研究,2009,27(1):237-241,247.
Han Haitao, Hu Wenchao, Chen Xuejun, et al. Application and comparison of three meteorological drought indices[J]. Agricultural Research in the Arid Areas, 2009, 27(1): 237-241, 247. (in Chinese with English abstract)
[8] 黄晚华,杨晓光,李茂松,等.基于标准化降水指数的中国南方季节性干旱近58 a演变特征[J]. 农业工程学报,2010,26(7):50-59.
Huang Wanhua, Yang Xiaoguang, Li Maosong, et al. Evolution characteristics of seasonal drought in the south of China during the past 58 years based on standardized precipitation index[J]. Transactions of the Chinese Society of Agricultural Engineering (Transactions of the CSAE), 2010, 26(7): 50-59. (in Chinese with English abstract)
[9] 高西宁,徐庆喆,丛俊霞,等. 基于标准化降水指数的辽宁省近54年干旱时空规律分析[J]. 生态环境学报,2015,24(11):1851-1857.
Gao Xining, Xu Qingzhe, Cong Junxia, et al. Temporal and spatial patterns of droughts based on standard precipitation index (SPI) in Liaoning Province in Recent 54 a[J]. Ecology and Environmental Sciences, 2015, 24(11): 1851-1857. (in Chinese with English abstract)
[10] 陈永志,李傲,周祥. 基于多尺度SPI指数的哈巴河地区近53 a的干旱分析[J]. 长江科学院院报,2017,34(6):12-16,23.
Chen Yongzhi, Li Ao, Zhou Xiang. Drought analysis based on multi-timescale standardized precipitation index in Habahe region from 1962 to 2014[J]. Journal of Yangtze River Scientific Research Institute, 2017, 34(6): 12-16, 23. (in Chinese with English abstract)
[11] 李斌,解建仓,胡彦华,等.基于标准化降水指数的陕西省干旱时空变化特征分析[J].农业工程学报,2017,33(17):113-119.
Li Bin, Xie Jiancang, Hu Yanhua, et al. Analysis on spatiotemporal variability characteristics of drought in Shaanxi Province using standardized precipitation index[J]. Transactions of the Chinese Society of Agricultural Engineering (Transactions of the CSAE), 2017, 33(17): 113-119. (in Chinese with English abstract)
[12] 刘蕊娟,王旭红,赵会娟. 渭河流域多尺度干旱时空特征分析[J]. 干旱地区农业研究,2017,35(3):99-106,252.
Liu Ruijuan, Wang Xuhong, Zhao Huijuan. Analysis of spatial-temporal characteristics of drought by multiple scales in Weihe River Basin[J]. Agricultural Research in the Arid Areas, 2017, 35(3): 99-106, 252. (in Chinese with English abstract)
[13] 岳元,申双和,王琪. 基于标准化降水指数的近45年吉林省干旱特征分析[J]. 中国农村水利水电,2017(7):166-172.
Yue Yuan, Shen Shuanghe, Wang Qi. Drought characteristics analysis of Jilin province based on the standardized precipitation index in recent 45 years[J]. China Rural Water and Hydropower, 2017(7): 166-172. (in Chinese with English abstract)
[14] Seiler R A, Hayes M, Bressan L. Using the standardized precipitation index for flood risk monitoring [J]. International Journal of Climatology, 2002, 22: 1365-1376.
[15] 孙滨峰,赵红,王效科. 基于标准化降水蒸发指数(SPEI)的东北干旱时空特征[J]. 生态环境学报,2015,24(1):22-28.
Sun Binfeng, Zhao Hong, Wang Xiaoke. Spatiotemporal characteristics of drought in northeast China based on SPEI[J]. Ecology and Environmental Sciences, 2015, 24(1): 22-28. (in Chinese with English abstract)
[16] 吴晶,陈元芳,余胜男. 基于随机森林模型的干旱预测研究[J]. 中国农村水利水电,2016(11):17-22.
Wu Jing, Chen Yuanfang, Yu Shengnan. Research on drought prediction based on random forest model[J]. China Rural Water and Hydropower, 2016(11): 17-22. (in Chinese with English abstract)
[17] 马建勇,许吟隆,潘婕. 基于SPI与相对湿润度指数的1961-2009年东北地区5-9月干旱趋势分析[J]. 气象与环境学报,2012,28(3):90-95.
Ma Jianyong, Xu Yinlong, Pan Jie. Drought tendency based on standardized precipitation index (SPI) and relative moisture index over Northeast China from May to September during 1961-2009[J]. Journal of Meteorology and Environment, 2012, 28(3): 90-95. (in Chinese with English abstract)
[18] 张淑杰,张玉书,孙龙彧,等. 东北地区玉米生育期干旱分布特征及其成因分析[J]. 中国农业气象,2013,34(3):
350-357.
Zhang Shujie, Zhang Yushu, Sun Longyu, et al. Analysis of distributional characteristics and primary causes of maize drought in Northeast China[J]. Chinese Journal of Agrometeorology, 2013, 34(3): 350-357. (in Chinese with English abstract)
[19] 刘彦平,蔡焕杰. 基于标准化降水指数SPI的泾惠渠灌区干旱演变对冬小麦气候产量的影响[J]. 干旱地区农业研究,2015,33(3):267-272.
Liu Yanping, Cai Huanjie. Effect of drought evolution on climatic yield of winter wheat based on SPI in Jinghuiqu Irrigation District[J]. Agricultural Research in the Arid Areas, 2015, 33(3): 267-272.
[20] 明博,陶洪斌,王璞. 基于标准化降水蒸散指数研究干旱对北京地区作物产量的影响[J]. 中国农业大学学报,2013,18(5):28-36.
Ming Bo, Tao Hongbin, Wang Pu. Impact of drought on grain yield in Beijing investigated by SPEI-based methods[J]. Journal of China Agricultural University, 2013, 18(5): 28-36. (in Chinese with English abstract)
[21] 王连喜,边超钧,李琪,等. 陕西省干旱变化特征及其对玉米产量的影响[J]. 自然灾害学报,2014,23(6):193-199.
Wang Lianxi, Bian Chaojun, Li Qi, et al. Characteristics of drought change in Shaanxi Province and their influence on corn yield[J]. Journal of Natural Disasters, 2014, 23(6): 193-199. (in Chinese with English abstract)
[22] McKee T B, Doesken N J, Kleist J. The relationship of drought frequency and duration to time scales[C]// American Meteorological Society Boston, Proceedings of the 8th Conference on Applied Climatology, 1993: 179-183.
[23] Kumar M N, Murthy C S, Sesha Sai M VR, et al. On the use of standardized precipitation index (SPI) for drought intensity assessment[J]. Meteorol Appl, 2009, 16(3): 381-389.
[24] World Meteorological Organization. Standardized Precipitation Index User Guide[M]. WMO-No.1090, 2012.
[25] Potopov́a V, Boroneanţ C, Boincean B, et al. Impact of agricultural drought on main crop yields in the Republic of Moldova[J]. Int J Climatol, 2015, 36(4): 2063-2082.
[26] 宋迎波,王建林,陈晖,等. 中国油菜产量动态预报方法研究[J]. 气象,2008,34(3):93-99.
Song Yingbo, Wang Jianlin, Chen Hui, et al. Methodology on dynamical prediction of rape yield in China[J]. Meteorological Monthly, 2008, 34(3): 93-99. (in Chinese with English abstract)
[27] David B Lobell, Wolfram Schlenker, Justin Costa-Roberts. Climate trends and global crop production since 1980[J]. Scinece, 2011, 333: 616-620.
[28] 宋迎波,王建林,李昊宇,等.冬小麦气候适宜诊断指标确定方法探讨[J]. 气象,2013,39(6):768-773.
Song Yingbo, Wang Jianlin, Li Haoyu, et al. Exploration to the method for determining diagnostic indicators of suitable climate for winter wheat[J]. Meteorological Monthly, 2013, 39(6): 768-773.
[29] 邱美娟,宋迎波,王建林,等. 农业气象产量预报方法中权重系数的确定[J]. 气象与环境学报,2016,32(2):106-111.
Qiu Meijuan, Song Yingbo, Wang Jianlin, et al. Determination of weight coefficient in agro-meteorological yield prediction[J]. Journal of Meteorology and Environment, 2016, 32(2): 106-111. (in Chinese with English abstract)
[30] Tian Liyan, Yuan Shanshui, Quiring S M. Evaluation of six indices for monitoring agricultural drought in the south central United States[J]. Agricultural and Forest Meteorology, 2018, 249: 107-119.
[31] American M S. Meteorological Drought:Policy statement[J]. Bulletion of American Meteorological Society, 1997, 78: 847-849.
[32] 赵秀兰. 近50年中国东北地区气候变化对农业的影响[J].东北农业大学学报,2010,41(9):144-149.
Zhao Xiulan. Influence of climate change on agriculture in Northeast China in recent 50 years[J]. Journal of Northeast Agricultural University, 2010, 41(9): 144-149. (in Chinese with English abstract)
[33] 陈群,耿婷,侯雯嘉,等. 近20年东北气候变暖对春玉米生长发育及产量的影响[J]. 中国农业科学,2014,47(10):1904-1916.
Chen Qun, Geng Ting, Hou Wenjia, et al. Impacts of climate warming on growth and yield of spring maize in recent 20 years in Northeast China[J]. Scientia Agricultura Sinica, 2014, 47(10): 1904-1916. (in Chinese with English abstract)
[34] 王艳华,任传友,韩亚东,等. 东北地区活动积温和极端持续低温的时空分布特征及其对粮食产量的影响[J]. 农业环境科学学报,2011,30(9):1742-1748.
Wang Yanhua, Ren Chuanyou, Han Yadong, et al. The tempo-spatial patterns of active accumulated and consecutive extreme low temperature and their impacts on grain crop yield in Northeast China[J]. Journal of Agro-Environment Science, 2011, 30(9): 1742-1748. (in Chinese with English abstract)
[35] 高晓容,王春乙,张继权. 气候变暖对东北玉米低温冷害分布规律的影响[J]. 生态学报,2012,32(7):2110-2118.
Gao Xiaorong, Wang Chunyi, Zhang Jiquan. The impacts of global climatic change on chilling damage distributions of maize in Northeast China[J]. Acta Ecological Sinica, 2012, 32(7): 2110-2118. (in Chinese with English abstract)
Effect of growing season drought on spring maize yields in Northeast China based on standardized precipitation index
Liu Wei, Li Yijun, He Liang, Song Yingbo※
(,100081,)
In order to study the influence mechanism of drought change on spring maize yields in Northeast China, the standard precipitation index (SPI) was selected as the drought evaluation index. The relative meteorological standardized yield residuals series (SYRS) was computed by using the series of spring maize yields in Northeast China and combined with drought disaster rate of spring maize to analyze the variation characteristics of drought and the yields, and the variation characteristics of the effect of growing season drought on spring maize yields. The research showed that: 1) The fluctuation of yields was caused by the fluctuation of precipitation in the interannual changes. The spring maize output per unit area was separated into trend yield and meteorological yield, and the separation efficiency was in a high level.The average of relative meteorological yieldwas less than 0.0028 and the standard deviation of relative meteorological yieldwas less than 0.16. Degree of drought and the years of drought in Liaoning and Inner Mongolia province were more than that in Heilongjiang and Jilin province. There was a negative correlation coefficient between the percentages of precipitation departure and suffering disaster rate by drought. The suffering disaster rate by drought during 2000 to 2010 were much heavy than any other periods in the four province. 2) There were few drought years from the 1980s to the mid 1990s while the more drought years from the late 1990s to 2015, and the variation trend of SPI6 was the same as the percentage of precipitation departure from April to September. The correlation coefficient between SPI and the percentage of precipitation was larger than 0.99 in the five years during 1999 to 2004. 3) The relative meteorological standardized yield residuals series from low values (less than -2.0) to high values (larger than 2.0) in Heilongjiang, Jilin and Inner Mongolia before 2000, which was high in the middle and later 1990s. And the SYRS was in a normal to higher level from 2010 to 2015 in Northeast China. The variation amplitude of SYRS in Liaoning was larger than that of other three provinces. 4) The correlation coefficient between SPI and the suffering disaster rate by drought was negative. Especially, the slope fitting by SPI less than or equal to -0.5 was much high than that fitting by all SPI6. The SPI6 and relative meteorological standardized yield residuals series were conformed to the downward quadratic parabola trend in the Northeast China. The largest suffering disaster rate by drought in Heilongjiang province was approximately 30%, which was much less than other three provinces, while the suffering disaster rate by drought was exceed 60% in Jilin and Liaoning. When there was normal or more precipitation, the yield would reach a high level; while the SPI6 was drought or wet, the yield would reach a low level. There was eight years of standardized yield residuals series less than -0.5, and the percentage of precipitation departure was 17% more than normal in all these eight years. Meanwhile, ≥10℃ accumulated temperature departure was -38 to -185 (℃·d) less than normal in seven years. It means more precipitation and less accumulated temperature would decrease yield loss.
drought; crops; spring maize; Northeast China; standardized precipitation index; yield
刘 维,李祎君,何 亮,宋迎波. 基于SPI判定的东北春玉米生长季干旱对产量的影响[J]. 农业工程学报,2018,34(22):121-127. doi:10.11975/j.issn.1002-6819.2018.22.015 http://www.tcsae.org
Liu Wei, Li Yijun, He Liang, Song Yingbo. Effect of growing season drought on spring maize yields in Northeast China based on standardized precipitation index[J]. Transactions of the Chinese Society of Agricultural Engineering (Transactions of the CSAE), 2018, 34(22): 121-127. (in Chinese with English abstract) doi:10.11975/j.issn.1002-6819.2018.22.015 http://www.tcsae.org
2018-04-20
2018-09-25
公益性行业(气象)科研专项(GYHY201506001),国家气象中心作物模型业务应用创新团队
刘 维,工程师,研究方向为作物模型与干旱。 Email:rainvswindvs@163.com
宋迎波,研究员,主要从事作物产量预报。 Email:songyb@cma.gov.cn
10.11975/j.issn.1002-6819.2018.22.015
S161
A
1002-6819(2018)-22-0121-07
