Analysis on Deflection Characteristics of Steel Cable-Stayed Bridge
2018-11-21,,
, ,
1.Faculty of Maritime and Transportation, Ningbo University, Ningbo 315211, P.R. China;2.School of Transportation, Southeast University, Nanjing 210096, P.R. China
Abstract: Various kinds of deflection characteristics on the steel cable-stayed bridge (Nanjing No.3 Yangtze River Bridge) are investigated by different mathematical statistical methods. Firstly, via Pearson correlation coefficient calculation, it shows good consistency between the adjacent measuring point of side span or middle span. Secondly, taking mid-span deflection as an example, the correlation analysis of deflection and temperature is conducted. They are synchronous via cross correlation coefficient calculation but not completely linear and a “hysteresis loop” phenomenon of three stages is formed. The fitting result on the monitoring data at day time is consistent with the numerical value through the application of unit temperature difference between the cable and girder and the positive temperature gradient of girder in the finite element model. And the temperature effect is considerable. Vehicle loads effect is obtained from wavelet analysis. The extracted curve can indirectly reflect the change of traffic loads. Finally, the structural damage is analyzed through the trend fusion on the deflection, cable force and visual inspection from 2006 to 2015. Relevant conclusions can provide a basis for management departments to carry out special detection.
Key words: steel cable-stayed bridge; health monitoring; deflection; characteristics analysis
0 Introduction
Girder deflection in long-span bridges is a direct and structurally significant index in bridge health monitoring systems. Changes in deflection reflect the overall response of the bridge span, which provides a reliable basis for damage localization[1]. Vertical displacement is one of the parameters that most often requires assessment.
There are many factors that cause changes in the deflection, among which temperature is the most significant[2]. In 2005, Barr et al.[3]observed temperature variations and evaluated the accuracy of calculated strains and cambers on a precast, prestressed girder bridge during the fabrication and service. Temperature and vehicle effects have been investigated for several other types of bridges as well[4-5], however, few researchers have focused on the steel cable-stayed bridge. This paper discusses the girder deflection characteristics of Nanjing No.3 Yangtze River Bridge.
1 Deflection Monitoring
Bridge deflection monitoring methods include the connecting pipes method, GPS method, inclinometer method, laser projection method, robot monitoring method, and so on[6]. Connecting pipes are installed on the bridge discussed in this paper; pipes are valuable monitoring tools as they have large monitoring range, low cost, and relatively small environmental footprint[7].
Here, we take the upstream measurement points as an example. There were initially 43 points in total, some of which varied considerably due to the wide range of longitudinal elevation across the bridge and some of which failed during the observation period. There are 29 effective measurement points remaining, as shown in Fig.1.

Fig.1 Girder deflection points
2 Deflection Characteristics Analysis
2.1 Correlation among measurement points
We first investigated the correlation among adjacent measurement points. Monitoring data from 24 January 2008 to 7 February 2008 were selected for correlation analysis among adjacent points. The resulting Pearson correlation coefficients (Eq.(1)) are shown in Fig.2.
(1)


Fig.2 Pearson correlation coefficients among adjacent measurement points
As shown in Fig.2, the correlation coefficients between adjacent points are all greater than 0.98 apart from two instances. The demarcation lines represent the south pylon and north pylon. There is close consistency between the measurement points of the side span and middle span, and the mid-span deflection is an appropriate reference point. The deflection characteristics of the mid-span girder were further investigated accordingly.
2.2 Deflection characteristics under temperature effects
Under typical operating conditions, an array of factors cause changes in deflection across the cable-stayed bridge. The main factors are temperature and vehicle load. Previous studies have extensively investigated temperature effects on deflection in other types of bridge[8], but there has been few studies on the deflection characteristics of steel cable-stayed bridges.
We conducted correlation analysis of mid-span deflection and temperature based on monitoring data from 26 March 2008 to 30 March 2008 (Fig.3). We observed a strong correlation between temperature and mid-span deflection.

Fig.3 Five-day monitoring data of mid-span deflection and temperature
The synchronization of mid-span deflection and temperature was determined according to the cross-correlation coefficientR(n), which is expressed as a measure of similarity of two series as a function of the lag in one relative to the other. The cross-correlation coefficient of a discrete signal is
n∈[-(N-1),N-1]
(2)
whereDmis themth monitoring value of mid-span deflection andTm+nthe (m+n)th monitoring value of mid-span deflection.m,nare the integer variables. Other parameters are the same as listed above.
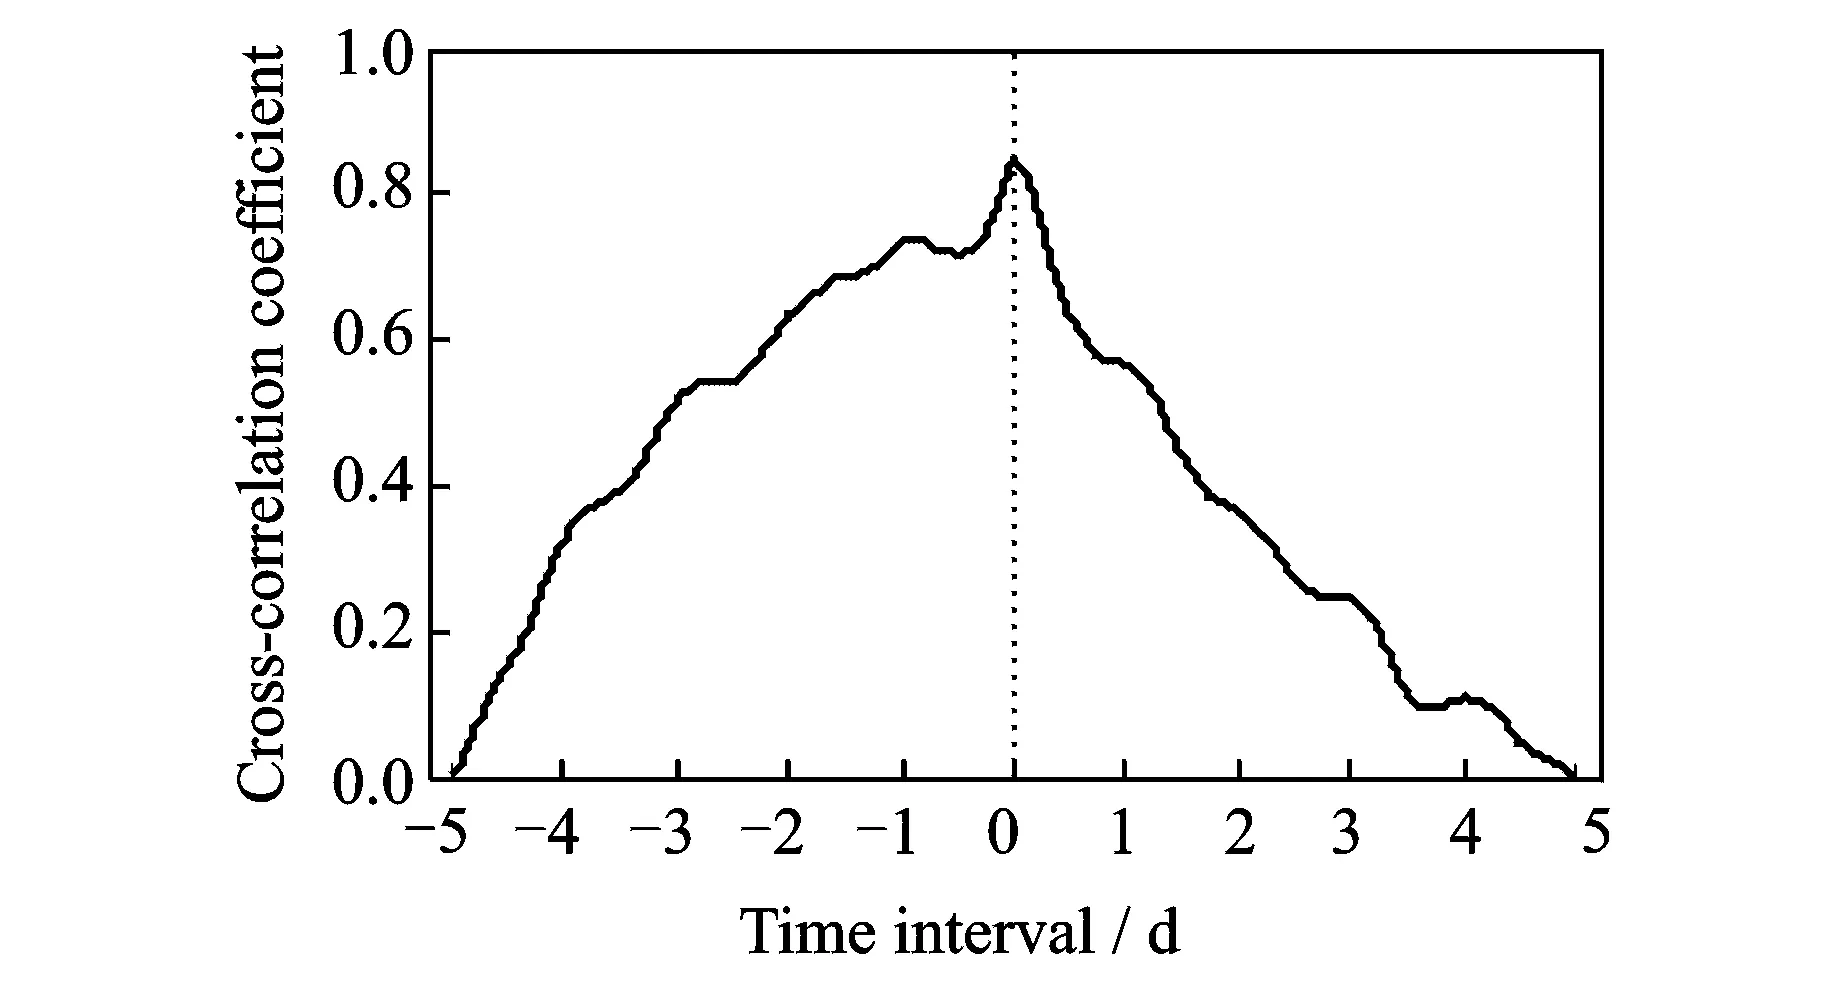
The cross-correlation relationship between deflection and temperature is shown in Fig.4.

Fig.4 Cross-correlation coefficient of deflection and temperature
The maximum cross-correlation coefficient value we calculated is 0.85, which appears at the time “0”; this indicates that deflection and temperature are synchronous. Deflection and temperature are on about a two-hour delay for concrete cable-stayed bridges in the literature. There is no hysteresis in the steel cable-stayed bridge as its materials are heat-sensitive.
Fig.5 shows the variations in mid-span deflection with temperature over a single day, where deflection and temperature are not completely linear. A “hysteresis loop” phenomenon instead formed.

Fig.5 Mid-span deflection with temperature over one day
The temperature changes in a day are divided into three stages: temperature falls, temperature rises, and temperature falls again. The mid-span deflection changes are divisible into three stages accordingly, which we define here as “A” “B” and “C” (Fig.5). The structure is in a dark environment and the temperature field is stable throughout Stage A, so the mid-span deflection values are basically unchanged. Temperature rises continually during Stage B and the change rate of mid-span deflection remains essentially stable; the fitting result on the monitoring data is approximately 5.6 mm/°C. During Stage C, the temperature falls continually and the change rate is the same as in Stage B.
To further investigate the effects of temperature on deflection, we established a finite element model for the cable-stayed bridge, as shown in Fig.6. We adopted a spatial beam element for the steel box girder, main pylon, and pier; we used a tension-only truss element to model the stay cable. Cable sag effect was only considered during nonlinear analysis. The mass of the diaphragm plate and deck pavement was imposed through nodal loads. We also modified the bridge with a combined static and dynamic model.

Fig.6 Finite element model
The mid-span deflection variations under different temperature actions[9]are shown in Table 1. The greatest contributions to deflection are the temperature difference between the cable and girder and the positive temperature gradient of the girder. The change rates in Stages B and C are controlled mainly by the relative deformation between girder and stay cables. The mid-span deflection variation under these two temperature actions is 14.27-8.98=5.3 (mm/°C), which is consistent with the monitoring fitting results discussed above. The deflection value under temperature effects is about 56 mm with a 10°C temperature difference. In other words, temperature effects are a significant aspect of any accurate assessment.
Table1Mid-spandeflectionvariationunderdifferenttemperature

Temperature actionValue applied to the model/°CMid-span deflection variation/mmTemperature rise of the whole structure1-1.60Temperature difference be- tween cable and girder0.5-8.98Positive temperature gra-di- ent of girder0.514.27Positive temperature gra-di- ent of pylon10.04
2.3 Deflection characteristics under vehicle load effects
Temperature effects cannot be eliminated by linear fitting due to the hysteresis loop. Wavelet analysis can separate the temperature effect trends from the amplitude information of vehicle load-induced deflection changes. We conducted a wavelet analysis based on the Fourier analysis technique, which has multi-resolution characteristics. Multi-resolution properties of the wavelet transform can temporarily support lower frequencies while maintain short temporal widths for higher frequencies by the scaling properties of the wavelet transform. The wavelet basis function and decomposition level are two major influencing parameters of this type of analysis. After multiple trials, we applied the decomposition of five levels by Db8 wavelet function[10-12]to the data from 26 to 30 March 2008 (Fig.7).

Fig.7 Fluctuation amplitude of mid-span deflection under vehicle load over five days
As shown in Fig.7, the fluctuation amplitude of mid-span deflection under five days of vehicle loads is about 20 mm. Vehicle load information can be readily inferred from the monitoring curve.
2.4 Damage analysis
Data from January 2007 to December 2010 (one day per month) were extracted to determine the effects of integrated temperature. We collected the average mid-span deflection and temperature from 0:00 to 1:00 per day and plugged the data into a linear simulation. Fig.8 shows the changes in mid-span deflection with temperature, which were in strongly negative correlation with a Pearson coefficient of -0.92.

Fig.8 Fitting of mid-span deflection and temperature
The monitoring structural parameters including girder deflection and cable forces can be unified to the same temperature during the completion of bridge (24°C) through linear fitting[13]. The data will accumulate and the damage will appear to be checked easily. By the information fusion on the trend of monitoring data and inspection data, the damage can be identified.
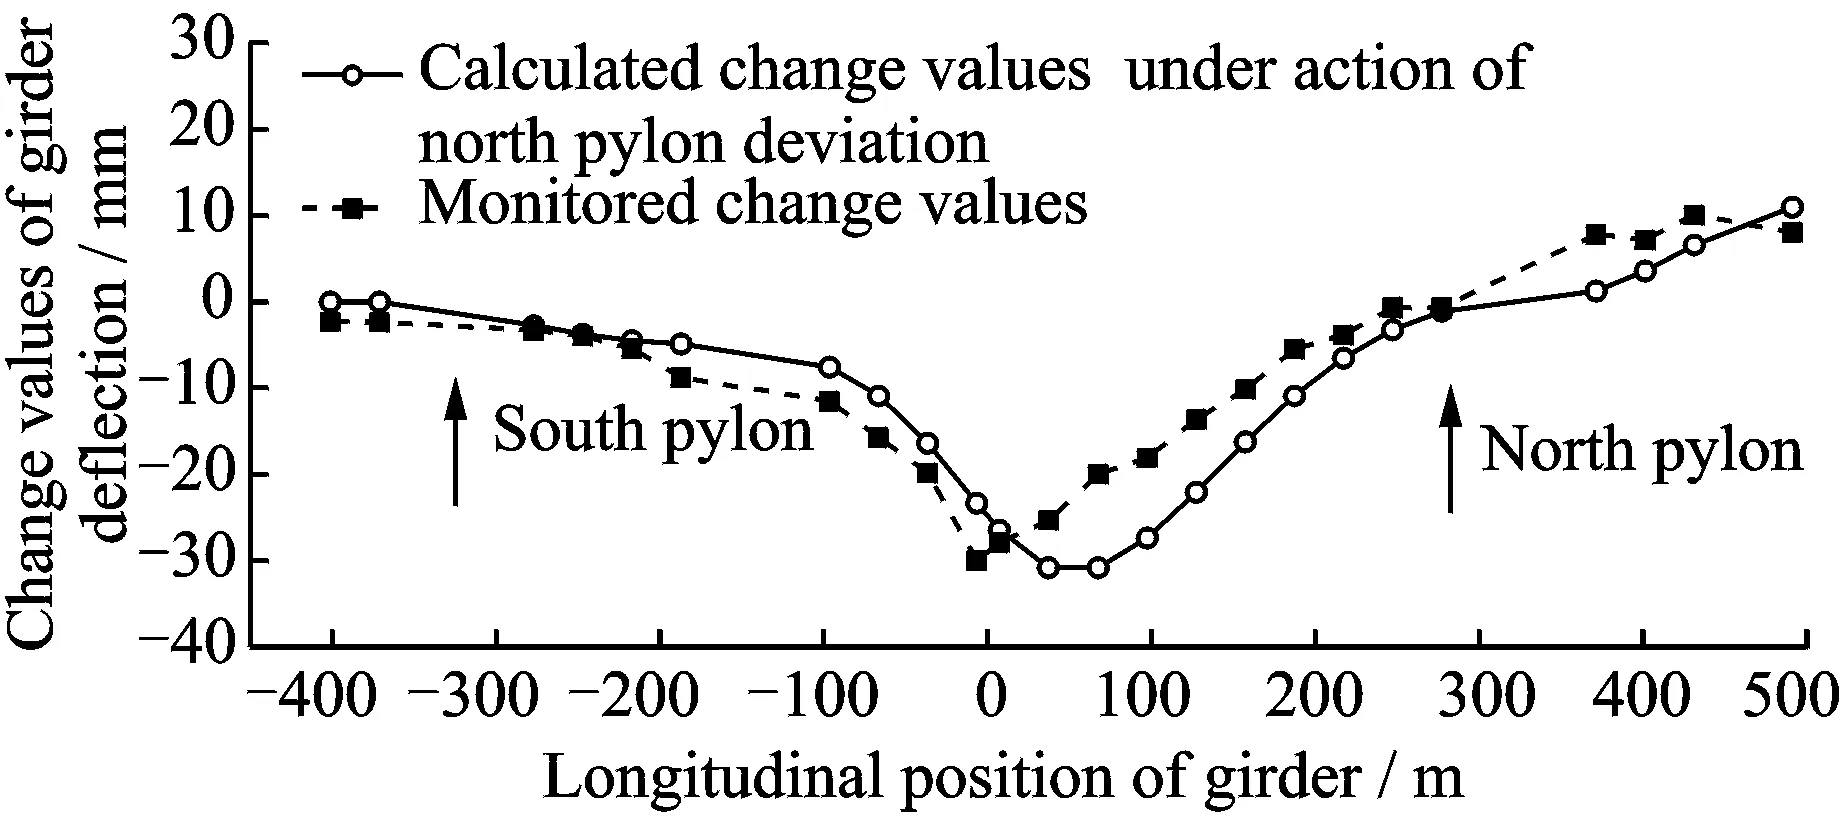
Firstly, the change values of girder deflection from March 2006 to January 2015 were marked, as shown in Fig.9[14]. According to the trend modes obtained in FEM, it was inferred the reason was north pylon deviation. The fitting value of the deviation to the middle span was 40 mm and the calculated values were similar to the monitored values.

Fig.9 Monitored and calculated change values of girder deflection in 2015
Secondly, the change values of cable forces from March 2006 to January 2015 were marked, as shown in Fig.10. The fitting value of the deviation to the middle span was 30 mm. The reason was consistent with deflection’s result.

Fig.10 Monitored and calculated change values of upstream cable forces in 2015
Finally, the cracks conditions in box girder from 2015 regular inspection report were checked[15]. Crack lengths in each box girder room were recorded and their distributions are presented in Fig.11. As shown in Fig.11, the cracks mainly occurred around the mid-span part and auxiliary piers. Moreover, the cracks around north auxiliary pier were more serious than south one. In addition, defects such as broken wire, cable corrosion or loose anchorage were not found from the visual inspection of stay cable system.

Fig.11 Crack distributions in box girder
Our results indicate that the cause of damage to the bridge is a deviation in the north pylon. The maintenance department is recommended to conduct inspection and safety assessments specifically tailored to north pylon deformation.
3 Conclusions
We obtained several conclusions based on analysis of steel cable-stayed bridge deflection characteristics.
(1) Adjacent measurement points are consistent in the side span and middle span. The mid-span deflection is an appropriate reference for investigation.
(2) Mid-span deflection and temperature are synchronous but not completely linear. The fitting change rate during Stages B and C was approximately 5.6 mm/°C, which was very close to finite element model calculation results. That means temperature effects are significant.
(3) We obtained amplitude information of vehicle load-induced deflection changes via analysis of the decomposition of five levels by Db8 wavelet function. When the vehicle loads change, relevant information can be extracted from the resulting monitoring curve.
(4) Through trend fusion analysis of deflection, cable force, and visual inspection data from 2006 to 2015, we identified significant damage to the bridge in the form of north pylon deviation. The maintenance department was recommended to focus on the north pylon accordingly.
Acknowledgements
This work was supported by the National Natural Science Foundation of China(Nos.51208096, 51808301). The help provided by Nanjing No.3 Yangtze River Bridge Co. Ltd. is also greatly appreciated.
杂志排行
Transactions of Nanjing University of Aeronautics and Astronautics的其它文章
- Random Vibration of Steel Catenary Riser Conveying Fluid Under Wave Excitation
- Failure Assessment of Aero-engine Support Structure due to Blade-off
- Nonlinear Control Method for Hypersonic Vehicle Based on Double Power Reaching Law of Sliding Mode
- Dynamic Analysis and Optimization of Pneumatic Wedge-Shaped Launcher for UAV
- Modal and Fatigue Life Analysis on Beam with Multiple Cracks Subjected to Axial Force
- Two Classes of Quaternary Codes from 4-valued Quadratic Forms
