Dynamics of soil organic carbon following land-use change:insights from stable C-isotope analysis in black soil of Northeast China
2018-10-26······
······
Abstract Intensive soil tillage is a significant factor in soil organic matter decline in cultivated soils.Both cultivation abandonment and foregoing tillage have been encouraged in the past 30 years to reduce greenhouse gas emissions and soil erosion.However,the dynamic processes of soil organic carbon(SOC)in areas of either continuous cultivation or abandonment remain unclear and inconsistent.Our aims were to assess and model the dynamic processes of SOC under continuous tillage and after cultivation abandonment in the black soil of Northeast China.Soil profiles were collected of cultivated or abandoned land with cultivation history of 0–100 years.An isotope mass balance equation was used to calculate the proportion of SOC derived from corn debris(C4)and from natural vegetation(C3)to deduce the dynamic process.Approximately 40%of SOC in the natural surface soil(0–10 cm)was eroded in the first 5 years of cultivation,increasing to about 75%within 40 years,before a slow recovery.C4above 30 cm soil depth increased by 4.5%–5% or 0.11–0.12 g⋅kg-1on average per year under continuous cultivation,while it decreased by approximately 0.34%annually in the surface soil after cultivation abandonment.The increase in the percentage of C4was fitted to a linear equation with given intercepts in the upper 30 cm of soil in cultivated land.A significant relationship between the change of C4and time was found only in the surface soil after abandonment of cultivation.These results demonstrate the loss and accumulation of corn-derived SOC in surface black soil of Northeast China under continuous tillage or cultivation abandonment.
Keywords C3photosynthesis⋅C4photosynthesis⋅Landuse change⋅Stable carbon isotopes⋅Black soil of Northeast China
1 Introduction
Soils have about three time as much carbon as the terrestrial biosphere and twice as much as the atmosphere(Batjes 1996).Soil organic carbon(SOC)concentration in a soil is influenced by many factors,including the biomass of vegetation,climatic factors,and physical soil qualities(such as parent material and clay content)(Dawson and Smith 2007).These factors have close relationships with land use.The management of land affects vegetation structure and some physical soil factors.In the 1990s,the Land Use and Cover Change program(LUCC)was launched as a core project of the International Geosphere-Biosphere Program(IGBP)to address our understanding of how anthropogenic and biophysical forces affect land use and hence land cover,and the environmental and social impacts of this change.So far,evidence increasingly shows that land-use change(LUC)can affect soil carbon content by influencing the rates of mineralization(Sun et al.2013)and soil erosion(Quine and Van Oost 2007;Van Oost et al.2007)and by providing fresh surfaces upon which vegetation can grow,sequestering CO2and delivering plant residues to soil(Sul et al.2013).LUC is a major controlling factor for the balance of SOC stocks and the global carbon cycle(Watson 2000;Poeplau et al.2011).
It is clear that LUC significantly affects soil C stock(Wang et al.2011;Smith et al.2012).As rising population has increased demand for agricultural products,the conversion of natural ecosystems to cropland and pasture has been extensive(Don et al.2011).In most cases,about 25%–42%SOC tends to be lost following the conversion of grasslands,forest,or other native ecosystems to cropland;or by draining,cultivating,or liming highly organic soil(Smith 2008;Poeplau and Don 2013).These reports about dynamics and balance of SOC after conversion are not consistent due to spatial variation in climate,chemical composition of SOC,soil type or depth,and intensity of management(Yonekura et al.2012;Wei et al.2013).Methodological inconsistencies also exist(Laganiere et al.2010;Poeplau et al.2011).SOC stock changes do not occur instantaneously,but rather over a period of years to decades after land-use conversion(Yonekura et al.2012;Wei et al.2013).For instance,Poeplau et al.(2011)reviewed 95 studies covering 322 sites in the temperate zone,and showed thatgrassland establishmentor afforestation caused a long-lasting carbon sink and that no new equilibrium was reached within 120 years,but C loss after deforestation and grassland conversion to cropland was rapid with a new SOC equilibrium being reached after 23 and 17 years,respectively,suggesting that the intensification of land use for food production has detrimental impacts on C storage in soils.
Regardless of any report on the dynamics of SOC,it is critical to observe the loss of old carbon and accumulation of new carbon to assess land-use impacts on SOC dynamics.Each production season,maize residues are returned to soil after harvest,which can help maintain soil productivity and sequester CO2.The average amount of maize residue in the world is estimated at 10.1 Mg⋅ha-1⋅year-1(Lal 2003).After a period of time,maize residues are converted into soil organic matter(SOM)through humification.Maize-derived SOM is also transformed into CO2through mineralization,and discharged into the atmosphere.Additionally,maize-derived SOM migrates downward with the movement of soil particles,or is eroded by water.Consequently,to understand the dynamics of maize-derived SOC,we must understand the parameters of the above processes.
Monitoring spatial and temporal trends in the carbon isotopic composition of SOM is a key tool used to understand the component processes of the terrestrial carbon cycle,especially when vegetation changes between C3and C4(Bernoux et al.1998;Boutton et al.1998;Wynn et al.2006).Plants with C3photosynthesis have δ13C values ranging from approximately-32‰ to-22‰ (mean-27‰),while those with C4photosynthesis have values ranging from about-17‰ to 9‰ (mean-13‰)(Griffiths 1992).These natural isotopic differences allow carbon derived from each photosynthetic pathway to be traced through aboveground and belowground food webs,and ultimately into the SOM compartment(Ehleringer et al.2000;Del Galdo et al.2003;Potthoff et al.2003).This method has regularly been applied to understand the fate of fresh organic carbon from corn,a globally-grown crop species with a C4photosynthetic pathway(John et al.2003;Dungait et al.2013).
The black soil region in northeastern China is in the North Temperate Zone and is well known for its high SOC.Cultivation in black soil can be traced back a few hundred years.Most black soil has been converted to cropland.Following LUC,the black soil layer is visibly eroded and SOC decreases rapidly(Liang et al.2009b;Xu et al.2010).However,some research has suggested SOC has stabilized during the past two decades(Yang et al.2004).Due to a lack of in situ observation,the dynamics of new and old SOC are poorly understood.In this paper,we analyzed SOC concentrations and stable C-isotope composition of soils from natural land,land cultivated with corn,and restored poplar tree belts to(i)observe the changes of SOC concentration after conversion to corn land;and(ii)assess and model the dynamic process of corn-derived SOC.
2 Materials and methods
2.1 Study sites
The black soil region in Northeast China is in the middle of Heilongjiang and Jilin provinces,and covers an area of 59,600 km2.The topography of the region is characterized by undulating slopes of 1 to 5°.The climate is semi-humid temperate with annual precipitation in the range of 500–600 mm,and mean annual temperature variation of 0.5 to 6°C.The original predominant vegetation was steppe-meadow grasses with high cover and high litter supply to soils,which resulted in the accumulation of SOM.The region has several hundred years of cultivation history,and mass cultivation occurred during the 1960s to 1980s.Traditional cropping practices in the region are continuous soybean,continuous corn,or corn-soybean rotation and most aboveground biomass is taken away as fuel or food for livestock.The main sources of organic matter to the soil are stubble and roots.Intensive cultivation has exposed the soil to the damaging forces of wind and water.To alleviate soil erosion and provide a buffer from main roads,some poplar trees have been strategically planted in crop fields as isolation belts of 10-to 20-m width.(Li 1987;Yu et al.2006;Liang et al.2009a;Liu 2009).
2.2 Field investigation and soil sampling
Soil sample profiles were taken from seven sites given over to corn and six poplar isolation belts;each poplar isolation belt was paired with a cropland site(Table 1).Sample profiles within each paired site were separated by a distance less than 200 m.Generally,the black soil can be divided into two sub-types according to the depth of the black soil layer—thick and thin.The study used thick and thin reference sites of native vegetation being used as pasture(Fig.1).The thin black soil profile was the reference for sites Nos.4 and 5,and the thick was the reference for the remaining sites.The slope angle at all sites was 0–3°.The basic parameters of all sites are listed in Table 1.Land-use history was investigated by talking with local farmers and by examining records in local documents.However,the information was vague for two sites with long cultivation history(Dehui and Jiutai counties,Jilin Province).We assumed the years of cultivation were 100 and 50 years,respectively,based on elderly farmers’descriptions,and determined by the diameter at breast height of poplar trees that the establishment of isolation belts occurred 25 and 12 years ago,respectively,for the corresponding poplar belt sites.
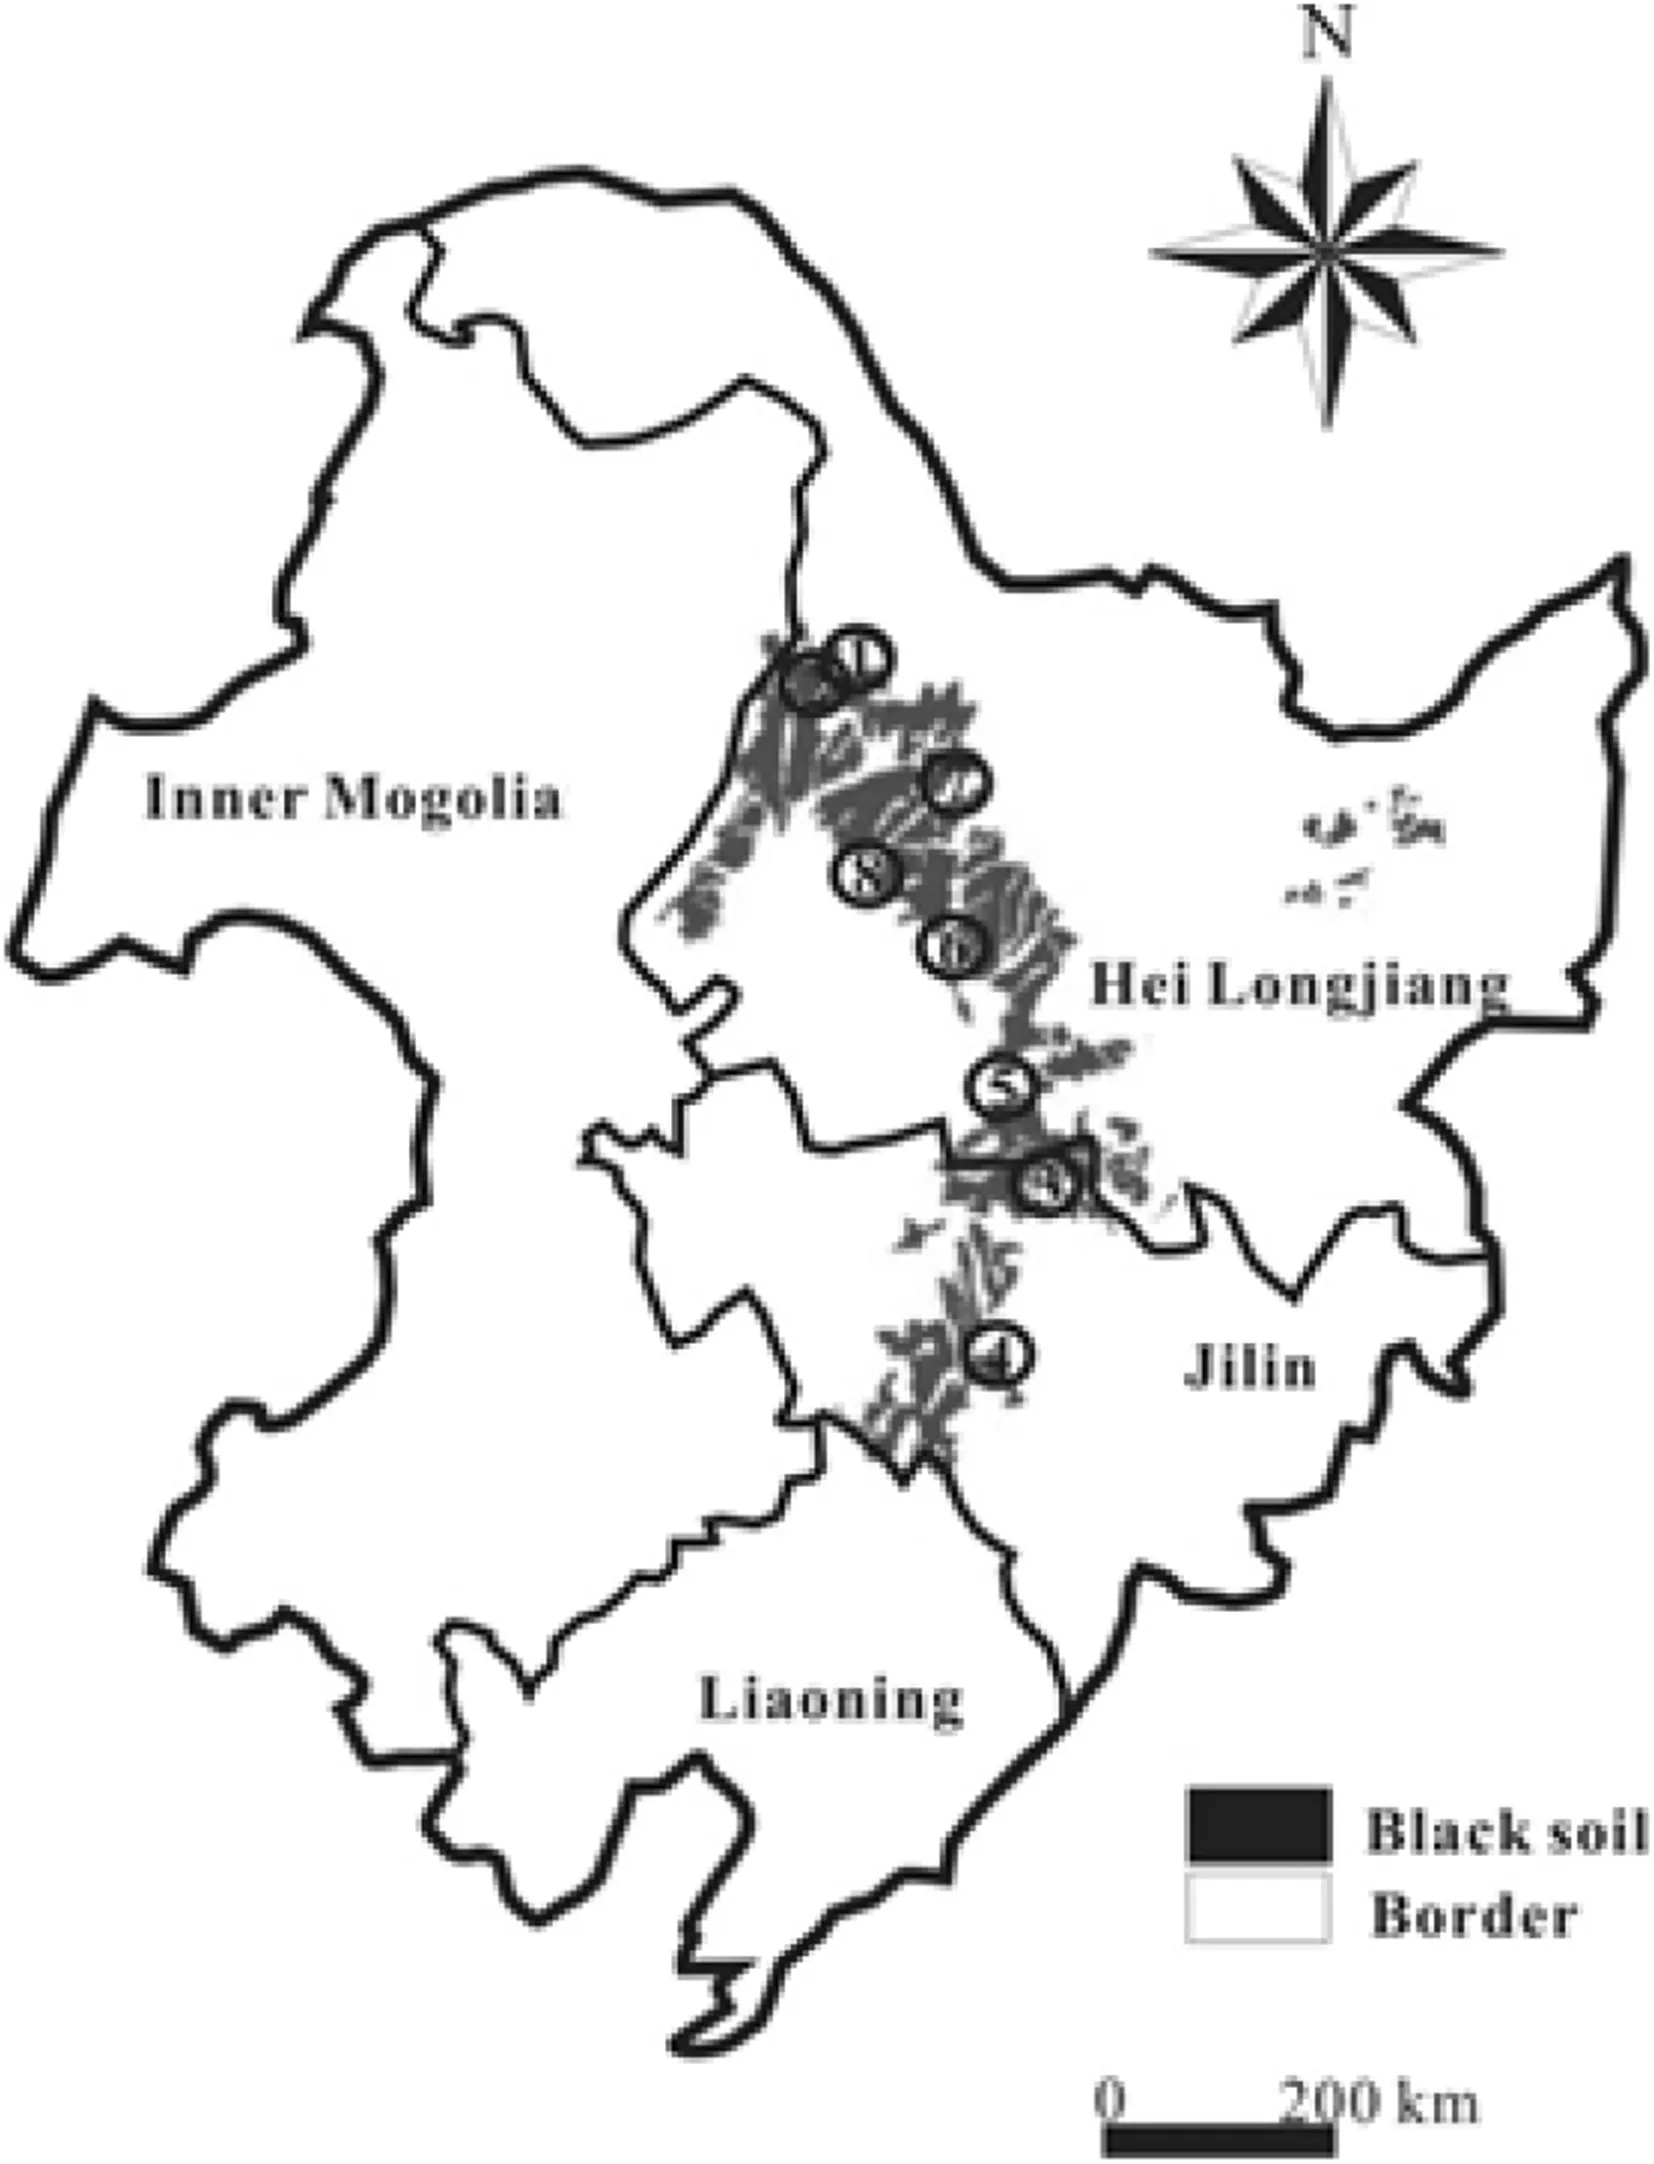
Fig.1 Distribution of sample sites in black soil regions of Northeast China
To construct a soil profile,we dug 1-m3pits,and collected soil samples at 0–10,10–20,20–30,30–40,40–60,60–80,and 80–100 cm.Each sample was about 2–3 kg in weight.Visible plant residues and roots were removed.Soil samples were divided into two parts:one part was stored at 4°C prior to analysis(fresh soil),and the other was airdried and ground to pass through a 0.154-mm(100 mesh)stainless-steel sieve.At the same time,mixed litter samples and some dominant plant leaves were collected.
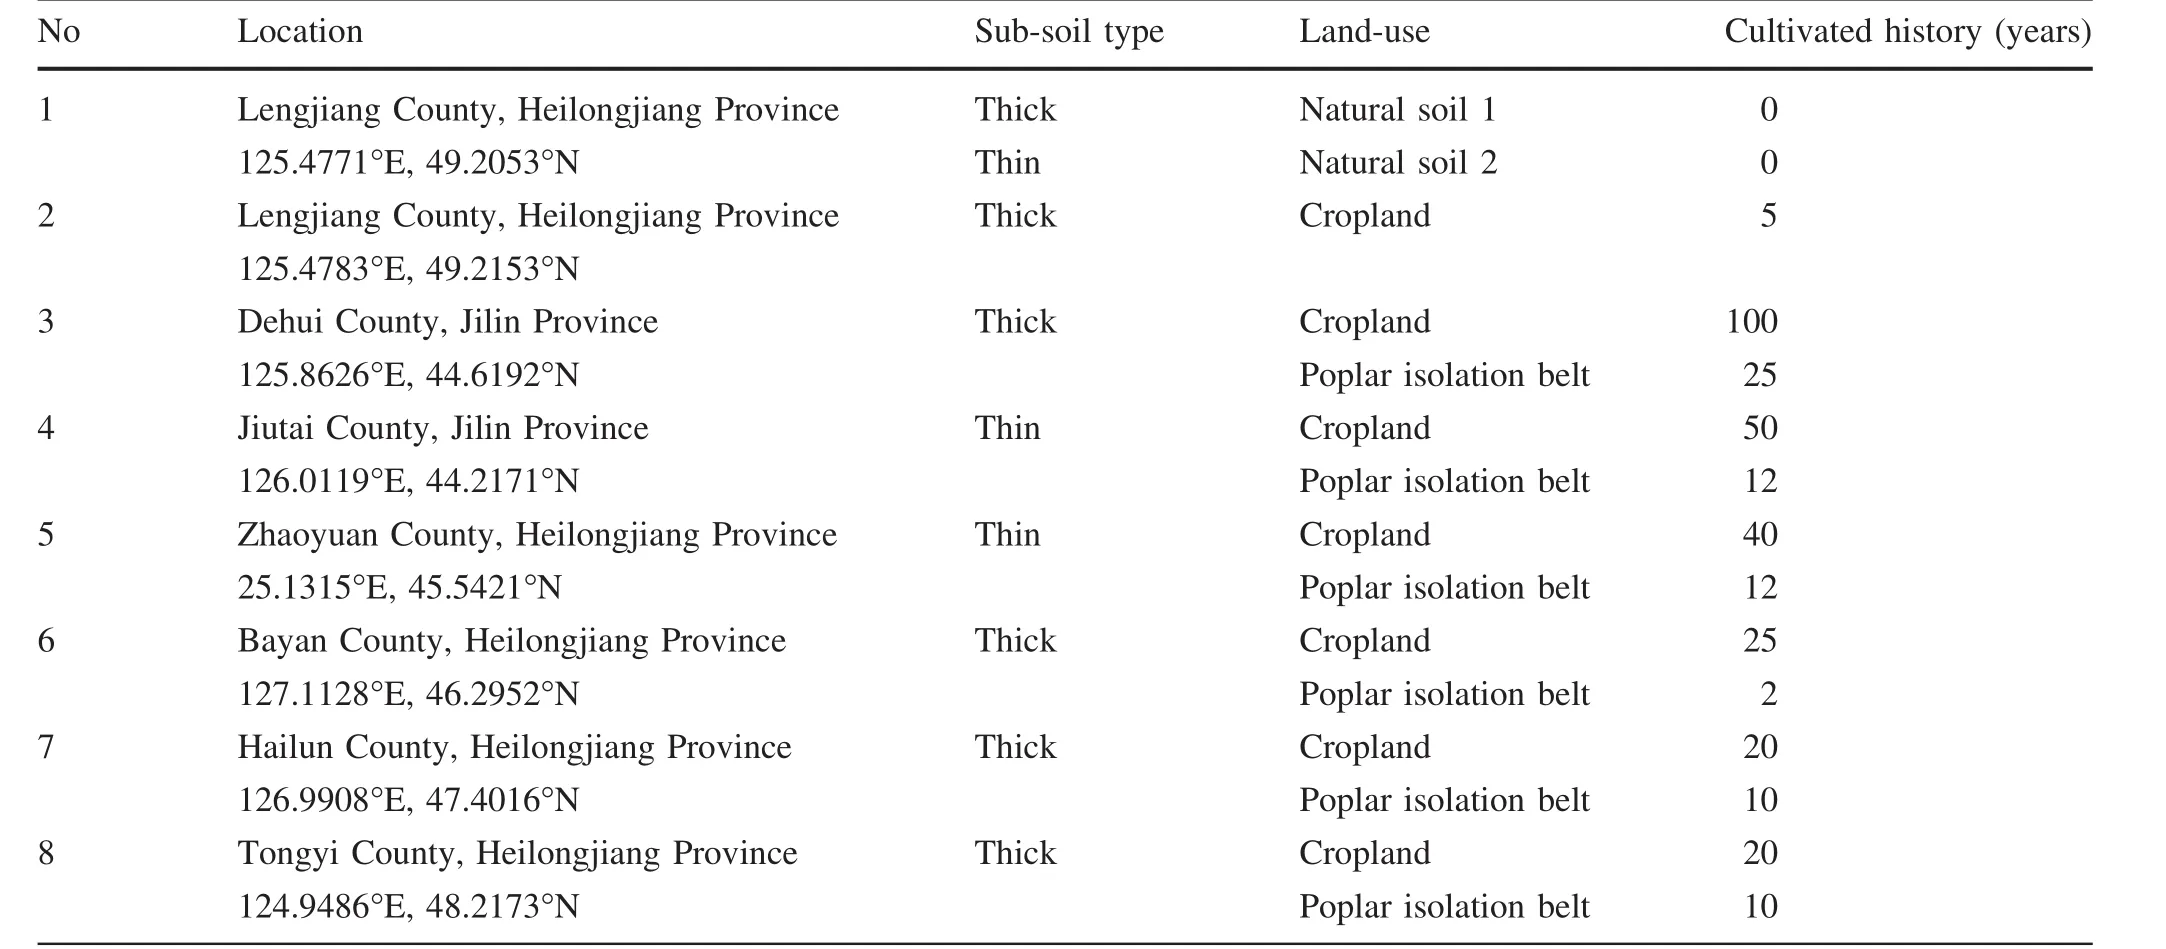
Table 1 Sample site characteristics
2.3 Soil analysis
Soil pH was measured with a pH electrode(Orion)in a ratio of 1:2.5(mass/volume)soil to de-ionized water.The bulk density of soil was calculated using the inner diameter of the core sampler cutting edge,segment depth,and the weight of soil after being oven-dried at 105°C for at least 6 h.Total SOC and nitrogen were quantified by combustion of ground samples in an elemental analyzer(PE2400 II,USA)with an analytical precision of 0.1%.Carbonate was removed before analysis by HCl-fumigation for 24 h(Harris et al.2001).
The natural abundance of heavy isotopes was expressed as parts per thousand relative to the international standard PDB(Pee Dee Belemnite)using delta units(δ).The δ13C was calculated according to Eq.(1):

where δSampleis the13C/12C ratio of sample,and δStandardis the13C/12C ratio of the reference standard(PDB).For stable isotopic analyses of SOC,a sample mass yielding 0.5 mg C was placed in a quartz tube with CuO.The sample tube was then evacuated and flame sealed.Organic carbon in the sample was oxidized to CO2at 850°C for 5 h.CO2was purified with liquid nitrogen,then measured with a Finnigan MAT252 isotope ratio mass spectrometer for carbon isotopic relative content.Three to five replicated measurements per sample were carried out,and the δ value presented is the average of these measurements.IAEA-C3(δ13C=24.91%,cellulose)was used as a correction standard for δ13C and analytical precision(n=5)was ± 0.1%.Before determination of δ13C,the inorganic C was removed by HCl-fumigation of soil for at least 24 h(Harris et al.2001).
2.4 Estimation of carbon derived from C3and C4 plants
As shown by several researchers,δ13C values can be used to estimate the distribution of C sources in soils cultivated with C4crops following deforestation of C3plants;the proportion of C3and C4carbon in the soil can be estimated according to the following isotopic dilution equation(Bernoux et al.1998;Dungait et al.2013):

where f( C4)is the proportion of C4carbon,δtis the carbon isotopic composition of the SOC,δAis the value of original plant–derived SOC(C3),and δBis the value of cornderived SOC(C4).All major original grass vegetation and poplar trees had δ13C values characteristic of C3plants.The δ13C values of original grass ranged from-30.04‰to-27.52‰.The mean δ13C value of poplar leaves was-28.67‰.The corn leaves measured in this study had more depleted13C than the corn root,with average δ13C values of-12.24‰ and-11.06‰,respectively.The main debris supplied to soil was corn root,thus the δ13C value of corn root was selected as δBfor Eq.(2).The fraction of C4lost(flost(C4))since the installation of the poplar isolation belt was calculated as follows:

where f( a)is the fraction of corn-derived SOC calculated by Eq.(2);and f( s)is the percentage of corn-derived SOC at the time of poplar isolation belt establishment,which was estimated by models developed during the analysis of corn-derived SOC dynamics after conversion of original grass land to corn land.
2.5 Data analysis
Statistical analyses were conducted using SPSS 13.0.The significant differences of soil properties between cropland and poplar isolation belts were compared by two-way t test.In all cases p<0.05 was considered to be significant.
3 Results
3.1 General soil characteristics
Descriptive statistics of the soil profiles under different land uses are listed in Table 2.The natural soil profiles,used as reference values,had high SOC.Ranges above 30 cm in thin-and thick-layer black soil were 36.62–51.92 and 44.86–52.93 g⋅kg-1,respectively.Below 40 cm,the SOC in the thin black soil decreased greatly,but in the thick soil the change was smaller.The change in nitrogen with depth displayed a similar trend,but the C/N ratio did not obey such a consistent trend.Soils were neutral pH at the surface and increasingly alkaline with depth.
In the samples from areas where natural soil(Fig.2)had been converted to cropland,SOC concentrations decreased from an average of 23.08 g⋅kg-1in the surface layer to 9.96 g⋅kg-1below 80 cm,with the majority of this decrease occurring between 0 and 60 cm(Table 2 and Fig.3).In the upper 40 cm,SOC content was consistently above 20 g⋅kg-1and accounted for nearly 80%of the total organic carbon stock.The average nitrogen content also declined from 2.17 g⋅kg-1at the surface to 1.23 g⋅kg-1below 80 cm,making C/N quite stable through the averageprofile.From 0 to 20 cm,the cropland soil became,on average,less acidic,but further down it was less variable.

Table 2 Descriptive statistics of the soil profiles under different land-use
In contrast to the cropland areas,the entire poplar isolation belt soil profile was alkaline according to average values of pH.Although the average SOC content was lower at all depths than in the corresponding soil layers of the cropland soil,the differences did not reach the prescribed significance level(p>0.05).The average nitrogen content decreased consistently with depth and was significantly(p<0.05)lower than that in the cropland at all depths.While the average C/N ratios exhibited a similar range(10.54–13.26)to the cropland soils,the variation with depth differed.Most notably,the lowest ratio(10.54)was at 20–30 cm,rather than being deep within the profile.Two-way t-tests showed significant difference(p<0.05)in pH between 0 and 20 cm,and in soil density between 10 and 20 cm,between cropland and poplar isolation belt soils.
3.2 Temporal changes in soil organic carbon contents
The strongest changes in SOC content occurred in the topsoil after conversion from natural soil to cropland.Compared with natural soil,at least 40%SOC in the surface soil(0–10 cm)was lost in the first 5 years of reclamation,but SOC contents in surface soil did not decrease with time in the seven corn land soil profiles.The lowest value(13.29 g⋅kg-1)was in the land with a 40-years cultivation history.The surface SOC contents of soils with 50-and 100-years histories were 22.12 and 24.87 g⋅kg-1,respectively.In the subsoil of corn land,almost all SOC content was lost compared with corresponding soil layers in the natural soil profile.The biggest SOC contents in corn land with 5-and 25-years histories appeared between 30 and 60 cm(Fig.3).Similar to surface soil,SOC content of subsoil above 60 cm showed a decreasing trend with time in the first 50 years as corn land.
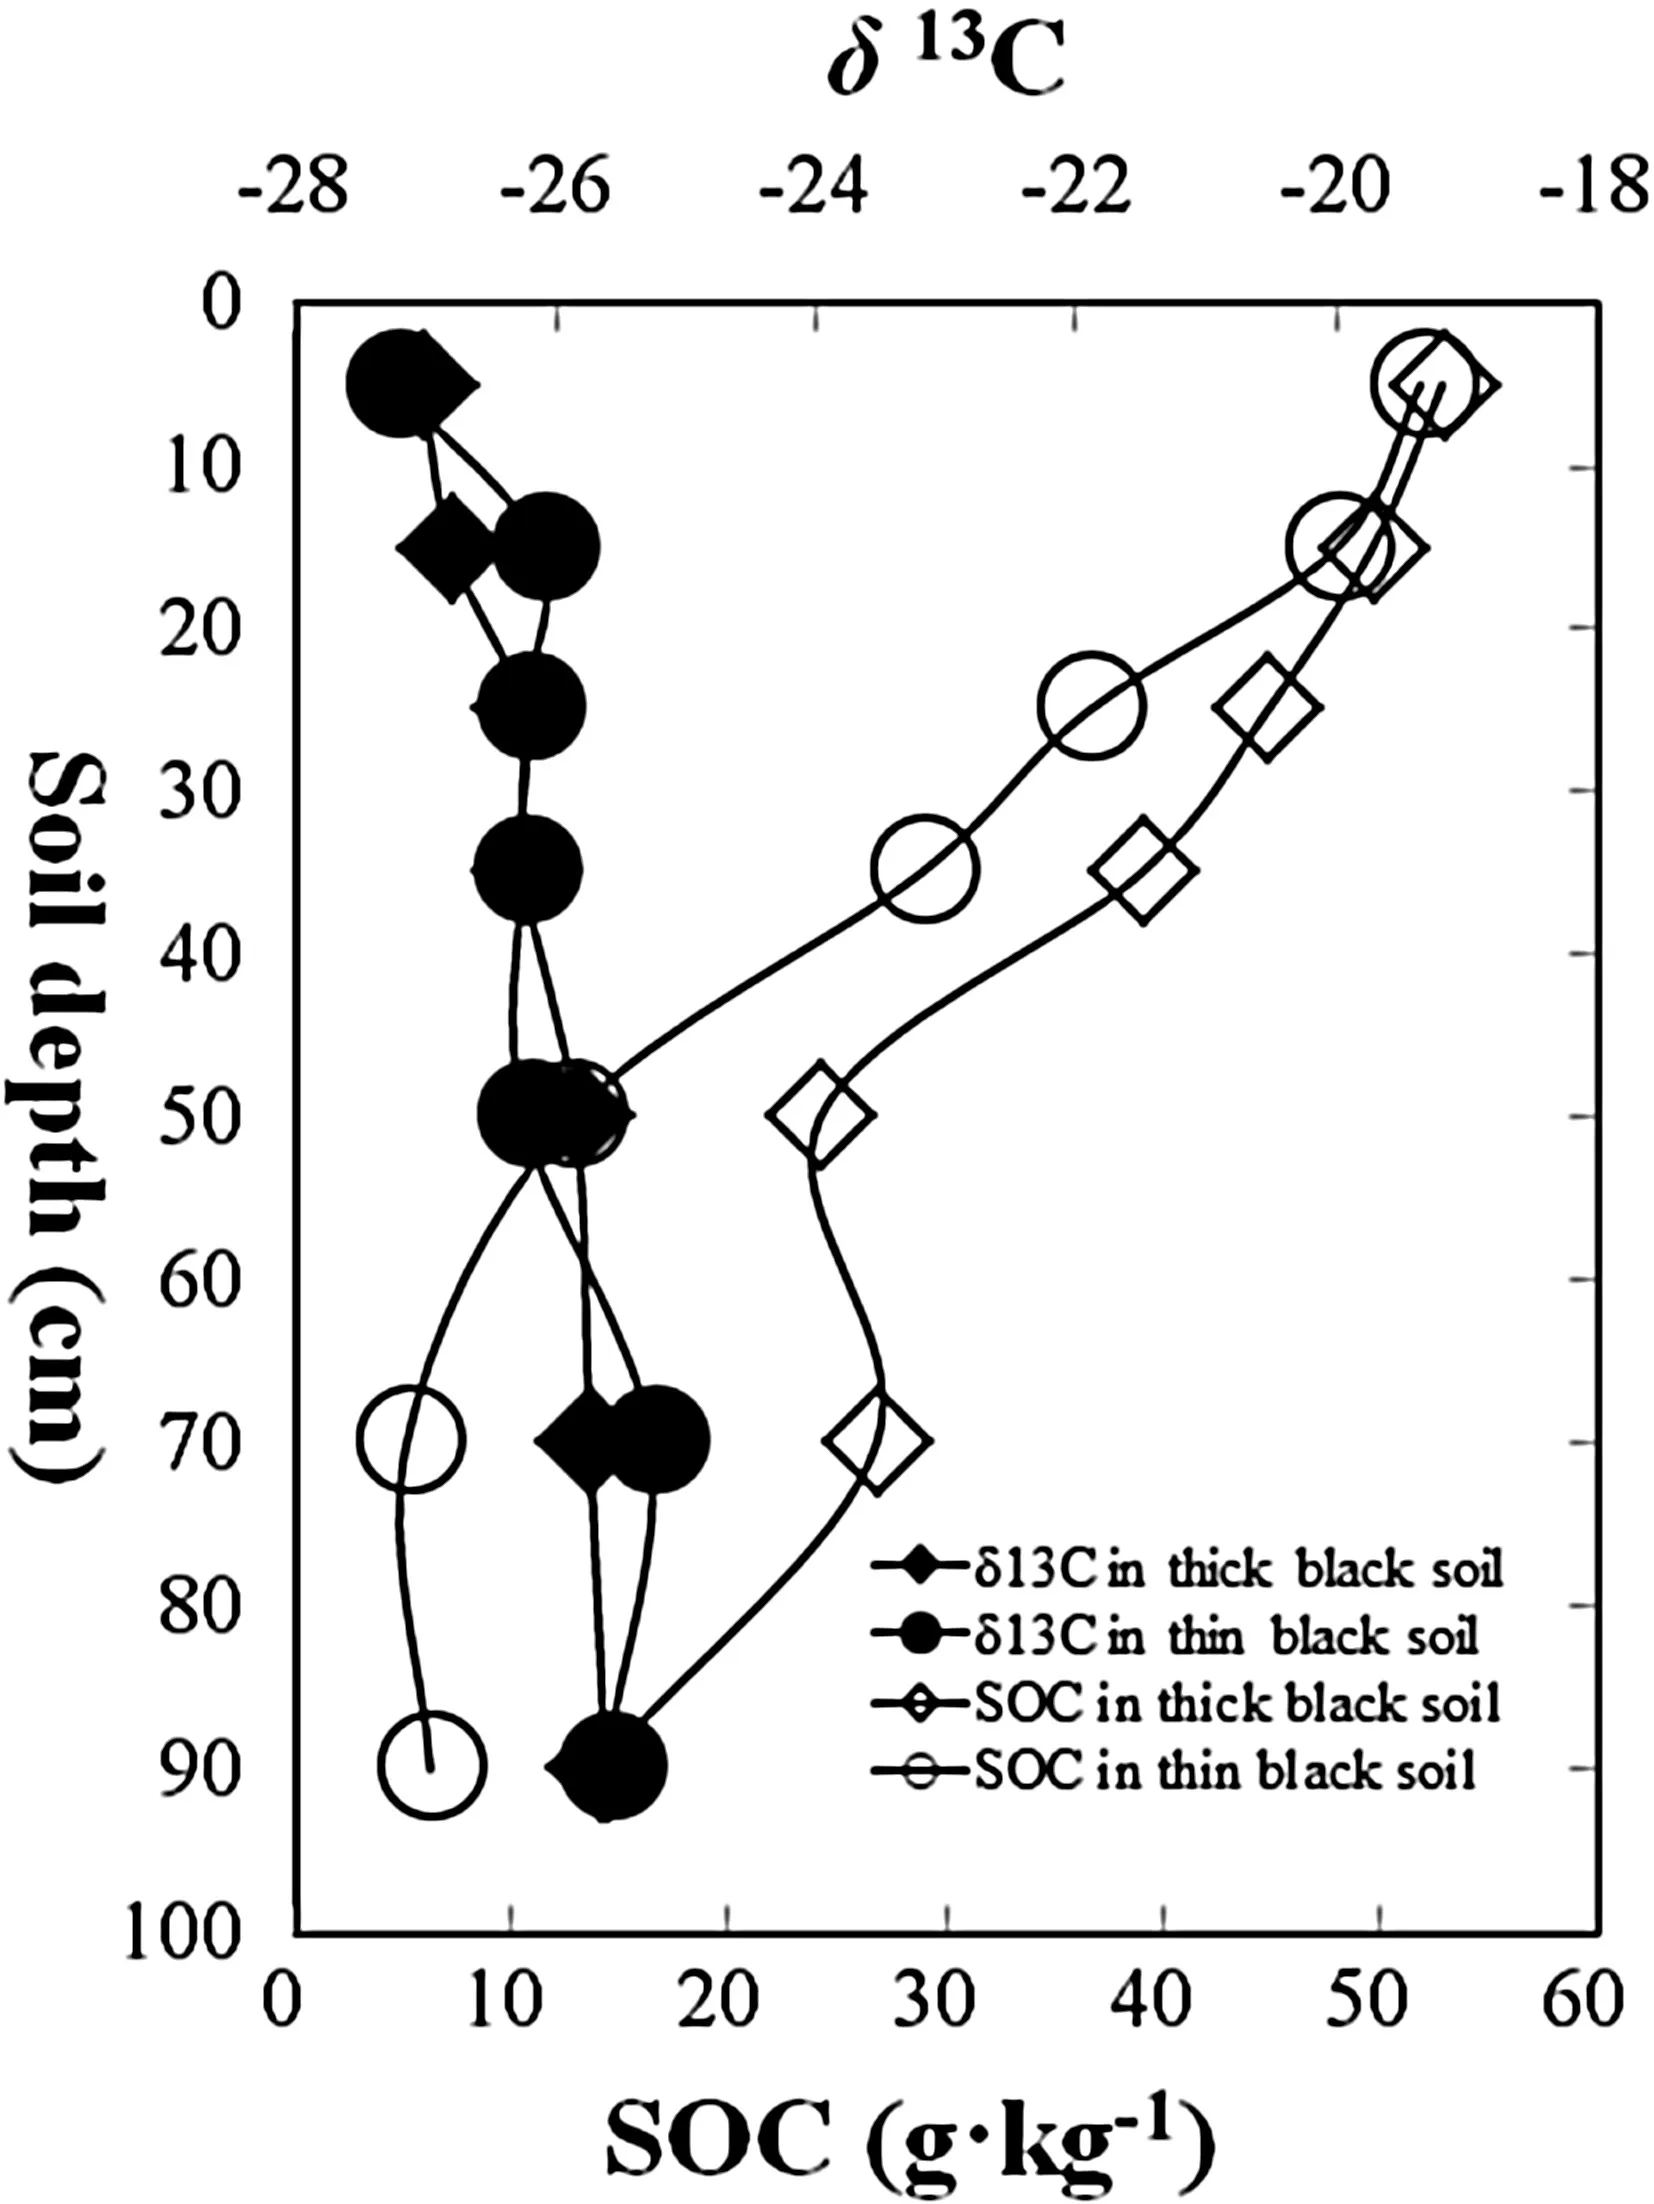
Fig.2 SOC content and δ13C values of reference soil profiles
The change of SOC content in poplar isolation belts did not reach a significant level.The surface SOC contents in three poplar isolation belts established 10 years ago were higher than the corresponding corn land,by 15%–37%.But for the poplar isolation belts with longer histories,the surface SOC content was lower.Most subsoil layers in the six soil profiles contained less SOC.Except for the 2-years old poplar belt,SOC contents decreased with soil depth.
3.3 Temporal change in carbon isotopic composition and soil organic carbon percentage derived from each source
Soils in the natural fields,corn lands,and poplar isolation belts had very different organic carbon isotopic composition patterns(Fig.3).The δ13C value of SOC in the natural soil profile ranged from-27.21‰ to-25.25‰ and became enriched in13C with soil depth.The selected corn soil profiles had different cultivation periods,significantly affecting the δ13C value of SOC.As expected,the most negative(-25.10‰)and most positive(-18.99‰)values of SOC in surface soil(0–10 cm)were found in 5-years-old and 100-years-old corn lands,respectively.The biggest difference of δ13C value between surface soil and lower mineral horizon(80–100 cm)(3.84‰)was found in the 50-years-old corn land.
Of the six poplar isolation belts,the age range was 2–25 years(Table 1).The δ13C values of SOC in each poplar soil profile show an inflection point at 20 or 30 cm(Fig.3).The δ13C values of SOC above the inflective layer became enriched in13C with soil depth,whereas below the inflective layer they became depleted.In the surface soil(0–10 cm),δ13C values were 0.83‰–2.58‰ higher than in the paired cropland soil profiles;the difference increased with time.However,in other layers,there was no relationship between the difference and established time.
According to Eq.(2),we calculated the percentage of SOC derived from corn plants in each core.In the corn land,the percentage of corn-derived SOC in the profile ranged from 2.1%to 19.3%in the 20-years-old crop profile,from 1.7%to 22.5%in the 25-years profile,from 1.6%to 35.26%in the 50-years,and from 20.9%to 50.2%in the 100-years.The percentage of corn-derived SOC in all corn land decreased with soil depth.In the 5-years-old corn land,no corn-derived SOC was present below 40 cm.There were positive linear relationships between the percentage of SOC derived from corn and cultivation time in the upper soil layers from 0 to 10 cm (R2=0.968,p<0.01),10 to 20 cm(R2=0.930,p<0.01),and 20 to 30 cm(R2=0.950,p<0.01).The average annual growth rate of corn-derived SOC in the surface soil was 0.5%throughout the 100-years period covered by the sample sites.
4 Discussion
4.1 δ13C values in soil profile
The SOC in the soil profile with original grass became enriched in13C with soil depth.To explain this phenomenon,Wynn et al.(2006)reviewed and grouped hypotheses:(1)isotopic fractionation during decomposition;(2)isotopic composition difference between surface litter and root-derived SOM;(3)preferential decomposition or stabilization of components with different isotopic composition;and(4)the terrestrial Suess effect—the decrease in the13C/12C isotopic ratio of atmospheric CO2by up to 1.4‰since the beginning of the Industrial Revolution,due predominantly to fossil fuel burning.
In the natural soil profiles of our study,the vertical trends of δ13C values were similar to other reported cases and can be explained by the four hypotheses mentioned above.The black soil region of Northeast China is in the North Temperate Zone.The average annual temperature is very low.Under this cold climate,the rate of most SOM degradation is low(Conant et al.2011)and it is easy to accumulate SOC,especially in areas with high grass coverage.Due to the slow degradation of SOC,organic carbon fractionation in the top meter of soil is smaller than in other types of soil or locations in China(Tu et al.2011;Guo et al.2013).In addition,δ13C values of SOC in the surface soil(0–10 cm)with natural plants averaged 1.6‰ lower than original grass.This can be attributed to isotopic fractionation during the decomposition of original debris.Vegetative debris consists of many organic components with different carbon isotopic compositions.Some13C-depleted organic components can preferentially accumulate during the initial stages of SOM decomposition and their concentration in some cases increases with depth and with SOM age(Wedin et al.1995;Wynn et al.2006;Tu et al.2008).This is different from southern China,where carbon isotopic fractionation increases 2.1‰–4.7‰ after transformation from plant debris to SOC(Tu et al.2011).
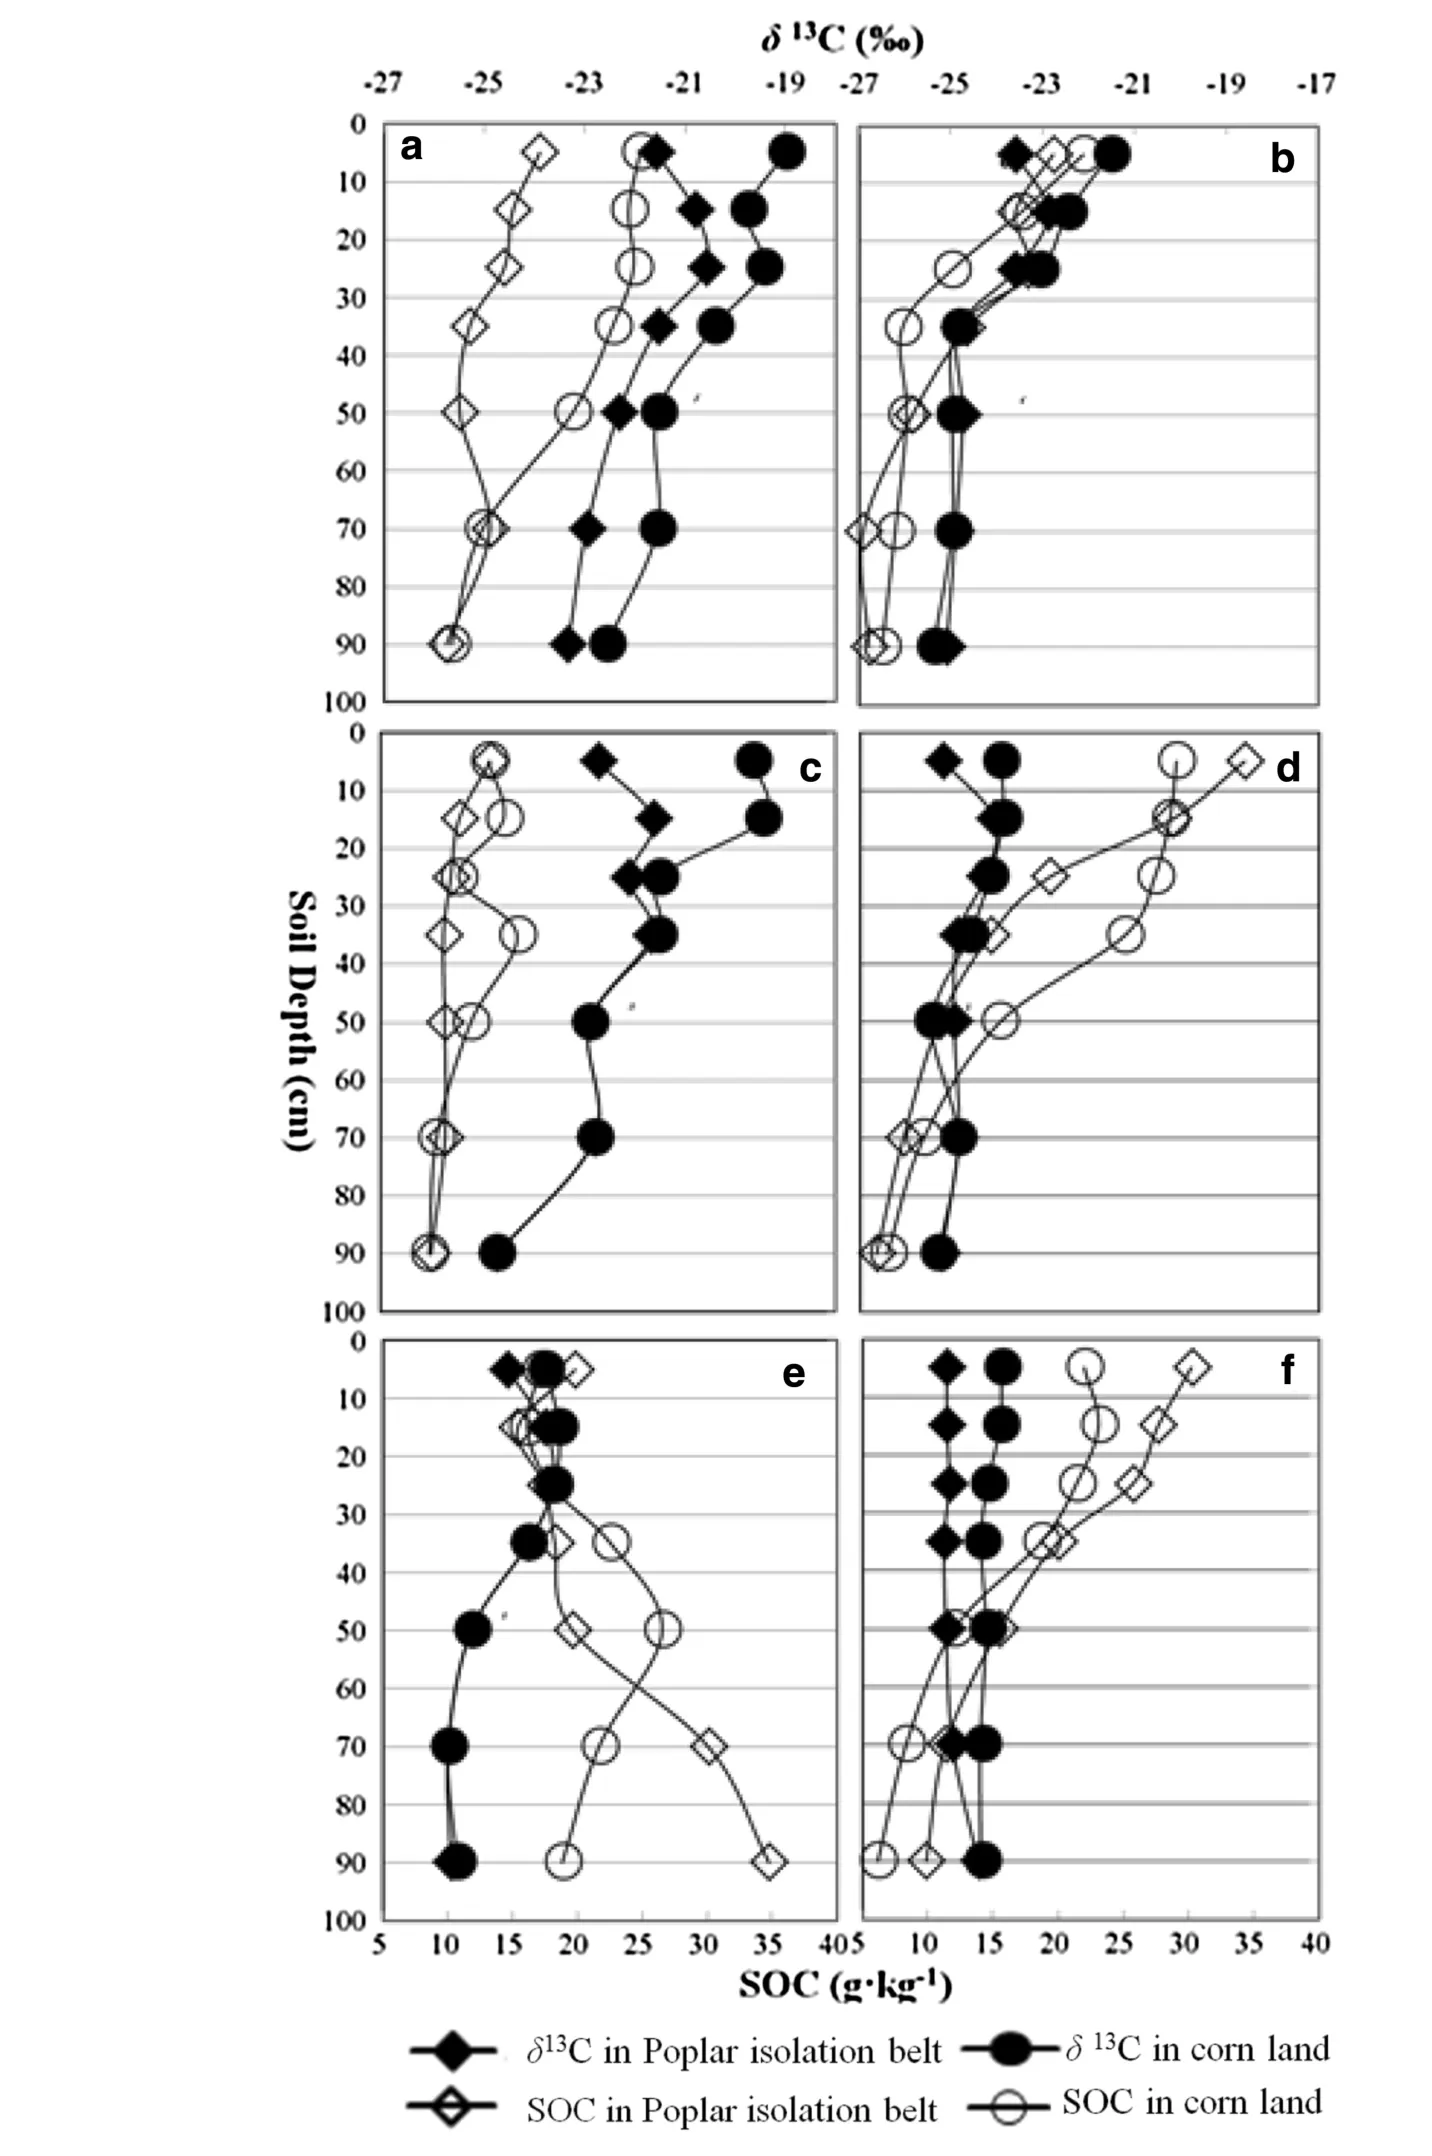
Fig.3 SOC content and δ13C of paired soil profiles.Jilin Province:a 100-years cropland and 25-years poplar isolation belt of Dehui County and b 50-years cropland and 12-years poplar isolation belt of Jiutai County;and Heilongjiang Province:c 40-years cropland and 12-years poplar isolation belt of Zhaoyuan County,d 20-years cropland and 10-years poplar isolation belt of Hailun County,e 25-years cropland and 2-years poplar isolation belt of Bayan County,and f 20-years cropland and 10-years poplar isolation belt of Tongyi County.δ13C(‰):calculated by Eq.(1)
With land-use conversion from original grass to agricultural land,the source of SOC changed.Corn has typically been the main agricultural vegetation in this region.Because corn has a different carbon isotopic composition from the original grass,the change of δ13C values can be attributed to the change of SOC source.The percentage of different sources can be estimated by using the isotope mass balance equation(Del Galdo et al.2003;Zach et al.2006).Spohn and Giani(2011)found soil became more enriched in13C with cultivation time.The main reason for this is that some labile SOC with low δ13CSOCis preferentially degraded or eroded(John et al.2005).In our research,the values of δ13CSOCshowed significant linear relationships with cultivation time(p<0.01)above 30 cm,with a mean annual increase rate of 0.06‰.This indicates that the change of SOC source is relatively steady.Compared with other reports,the values of δ13CSOChad a smaller change.Possible reasons for this include that the original organic carbon remained a high proportion of the total in spite of severe erosion and that the input of cornderived carbon was relatively small.
After the reconversion from cultivated land to poplar isolation belt,SOC gains a C3source and the δ13C values should decrease with time.In theory,the new carbon should be in continuous growth,whereas the original carbon should be in continuous consumption after LUC.However,we found the δ13C values of some soil layers in all soil profiles became more enriched in13C than their paired corn-land profile,meaning the corn-derived SOC increased in these layers.We conclude there was some corn residue that was not degraded completely and became SOC when the land use changed to poplar belts.
4.2 Soil organic carbon dynamics in corn land
To date,most reports have found SOC is lost rapidly after cultivation of former grasslands,especially soon after establishment of cropland.Zach et al.(2006)found 33%–57%loss of original bulk soil carbon within 12–18 years of continuous cultivation.Tiessen and Stewart(1983)calculated average carbon losses in grassland of the Great Plains,North America,were 30%–50%in 50–80 years after conversion.Guo and Gifford(2002)compiled research prior to 2002 and reported that about 59%of soil carbon stocks are lost after LUC from pasture to cropland before a new equilibrium is established.In our study,the maximum carbon loss occurred at 0–20 cm depth.The loss percentage from original bulk soil carbon ranged from 27%to 74.4%.Of original bulk soil carbon,37.6%was eroded in the first 5 years of cultivation.At 40 years of cultivation,eroded SOC reached the maximum.SOC concentrations then rebounded after 40 years of cultivation.These results clearly differ from Poeplau et al.’s(2011)report that deduced a new equilibrium could be reached within 17 years after conversion for 27 cm depth.Indeed,there are some conflicting reports about the change of SOC content within the last 20 years according to Chinese government and other researcher’s investigations(Yang et al.2004;Wang et al.2007).One major factor affecting SOC stocks is the close relationship of soil erosion to land use(Griffiths 1992;Quine and Van Oost 2007;Van Oost et al.2007).Don et al.(2011)considered that SOC losses were underestimated if eroded SOC was completely decomposed or overestimated if SOC was enhanced in eroded material.Additionally,around some areas with deposition of eroded material,it is very difficult to identify whether erosion decreases or increases the terrestrial carbon sink(Lal 2003;Van Oost et al.2007).
Subsoil below 20 or 30 cm depth has been largely ignored because of its low carbon content(Rumpel and Kögel-Knabner 2011).The loss percentages of SOC below 20 cm displayed no consistent trend with soil depth in all soil profiles.Overall,in most soil layers below 20 cm,the loss of SOC was enlarged.But some soil layers in 5-,25-,40-,and 50-years-old corn land contained more SOC than corresponding reference soil layers.Tillage may mix carbon-rich topsoil with the deeper horizon and result in increased SOC in subsoil after conversion(Fujisaka et al.1998;Hughes et al.2000).In this way,the loss percentage in a given layer would suddenly increase.The input of new carbon may stimulate the degradation of original organic carbon(Fontaine et al.2007)and result in decreased SOC.
From Fig.4,the amount of corn-derived SOC increased with time.Additionally,corn-derived SOC displayed a good linear relationship with time(p<0.01)above 30 cm.Equations with intercepts of 12.176,10.977,and 5.372 fit the dynamic process of corn-derived SOC at depths of 0–10,10–20,and 20–30 cm,respectively(Fig.5),with average annual growth rates of 5.0%,4.5%and 4.5%,respectively.
4.3 Soil organic carbon dynamics in poplar isolation belts
Poplar isolation belts were usually established on cropland and used to alleviate soil erosion or as a buffer from main roads.After establishment,these areas have not been cultivated again,but may have been transporting lanes for agricultural material.Overall there is no current cornderived SOC input in these areas.
Afforestation or abandonment of agricultural fields may have some important effect on the dynamics of SOC by impacting soil properties,sources,quality of SOC,and so on(Zhang et al.2010;Zhu et al.2010).Castro et al.(2010)found changes in litter decomposition rate were largely due to litter quality following abandonment.Generally SOC stock in the surface soil recovers slowly following afforestation or abandonment(Post and Kwon 2000;Silver et al.2000).But changes in SOC are not always positive,and depend on previous land use,soil type,texture and mineralogy,climate conditions,plant species,and the intensity of management(Guo and Gifford 2002;Paul et al.2002;Poeplau et al.2011).Raiesi(2012)found abandonment of cultivated fields significantly promotes SOC content growth in the 0–15 cm soil layer,with no effect in the 15–30 cm layer after 18–22 years.
In our study,the SOC in the surface soil(0–10 cm)increased slightly in the first 10 years following poplar isolation belt establishment compared with paired corn soil profiles,then decreased over the next 15 years.However,the change of SOC below 10 cm did not show any relationship with time after LUC.According to the model we developed during the analysis ofcorn-derived SOC dynamics after conversion from original grass field to corn land,the amounts and percentages of corn-derived SOC were estimated at the time when land use was converted to poplar isolation belts.The percentage loss of corn-derived SOC showed a significant linear relationship with time(p<0.01)in the surface soil(Fig.6).Average annual loss was approximately 0.34%.Due to consumption of nitrogen and the change in C/N ratio(Table 1),the decomposition rate of corn-derived SOC may gradually decline.However,there was a strange phenomenon below 10 cm:some layers returned higher values of corn-derived SOC than corresponding corn land layers in all poplar isolation belt soil profiles.We concluded there were two reasons for this:(1)presence of some high corn-derived SOC soil in these soil layers and(2)existence of some un-decomposed corn debris when the poplar isolation belts were planted.Following the establishment of poplar isolation belts,these undecomposed corn residues transformed gradually to SOC.
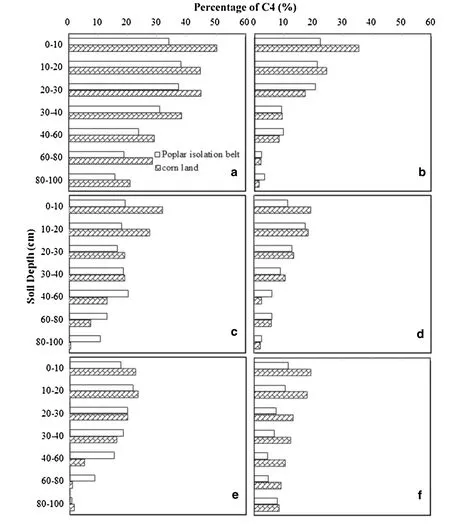
Fig.4 Change in corn-derived SOC percentage in paired soil profiles.Jilin Province:a Dehui County and b Jiutai County;and Heilongjiang Province:c Zhaoyuan County,d Hailun County,e Bayan County,and f Tongyi County.SOC:soil organic carbon;percentage of C4(%):the percentage of SOC that is corn-derived
5 Conclusions
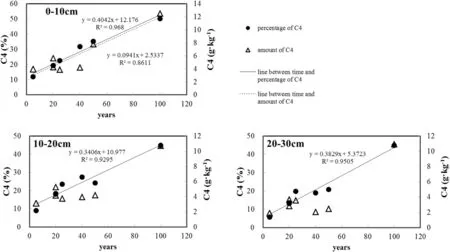
Fig.5 Relationships between amount and percentage of corn-derived carbon and cultivated time in cropland
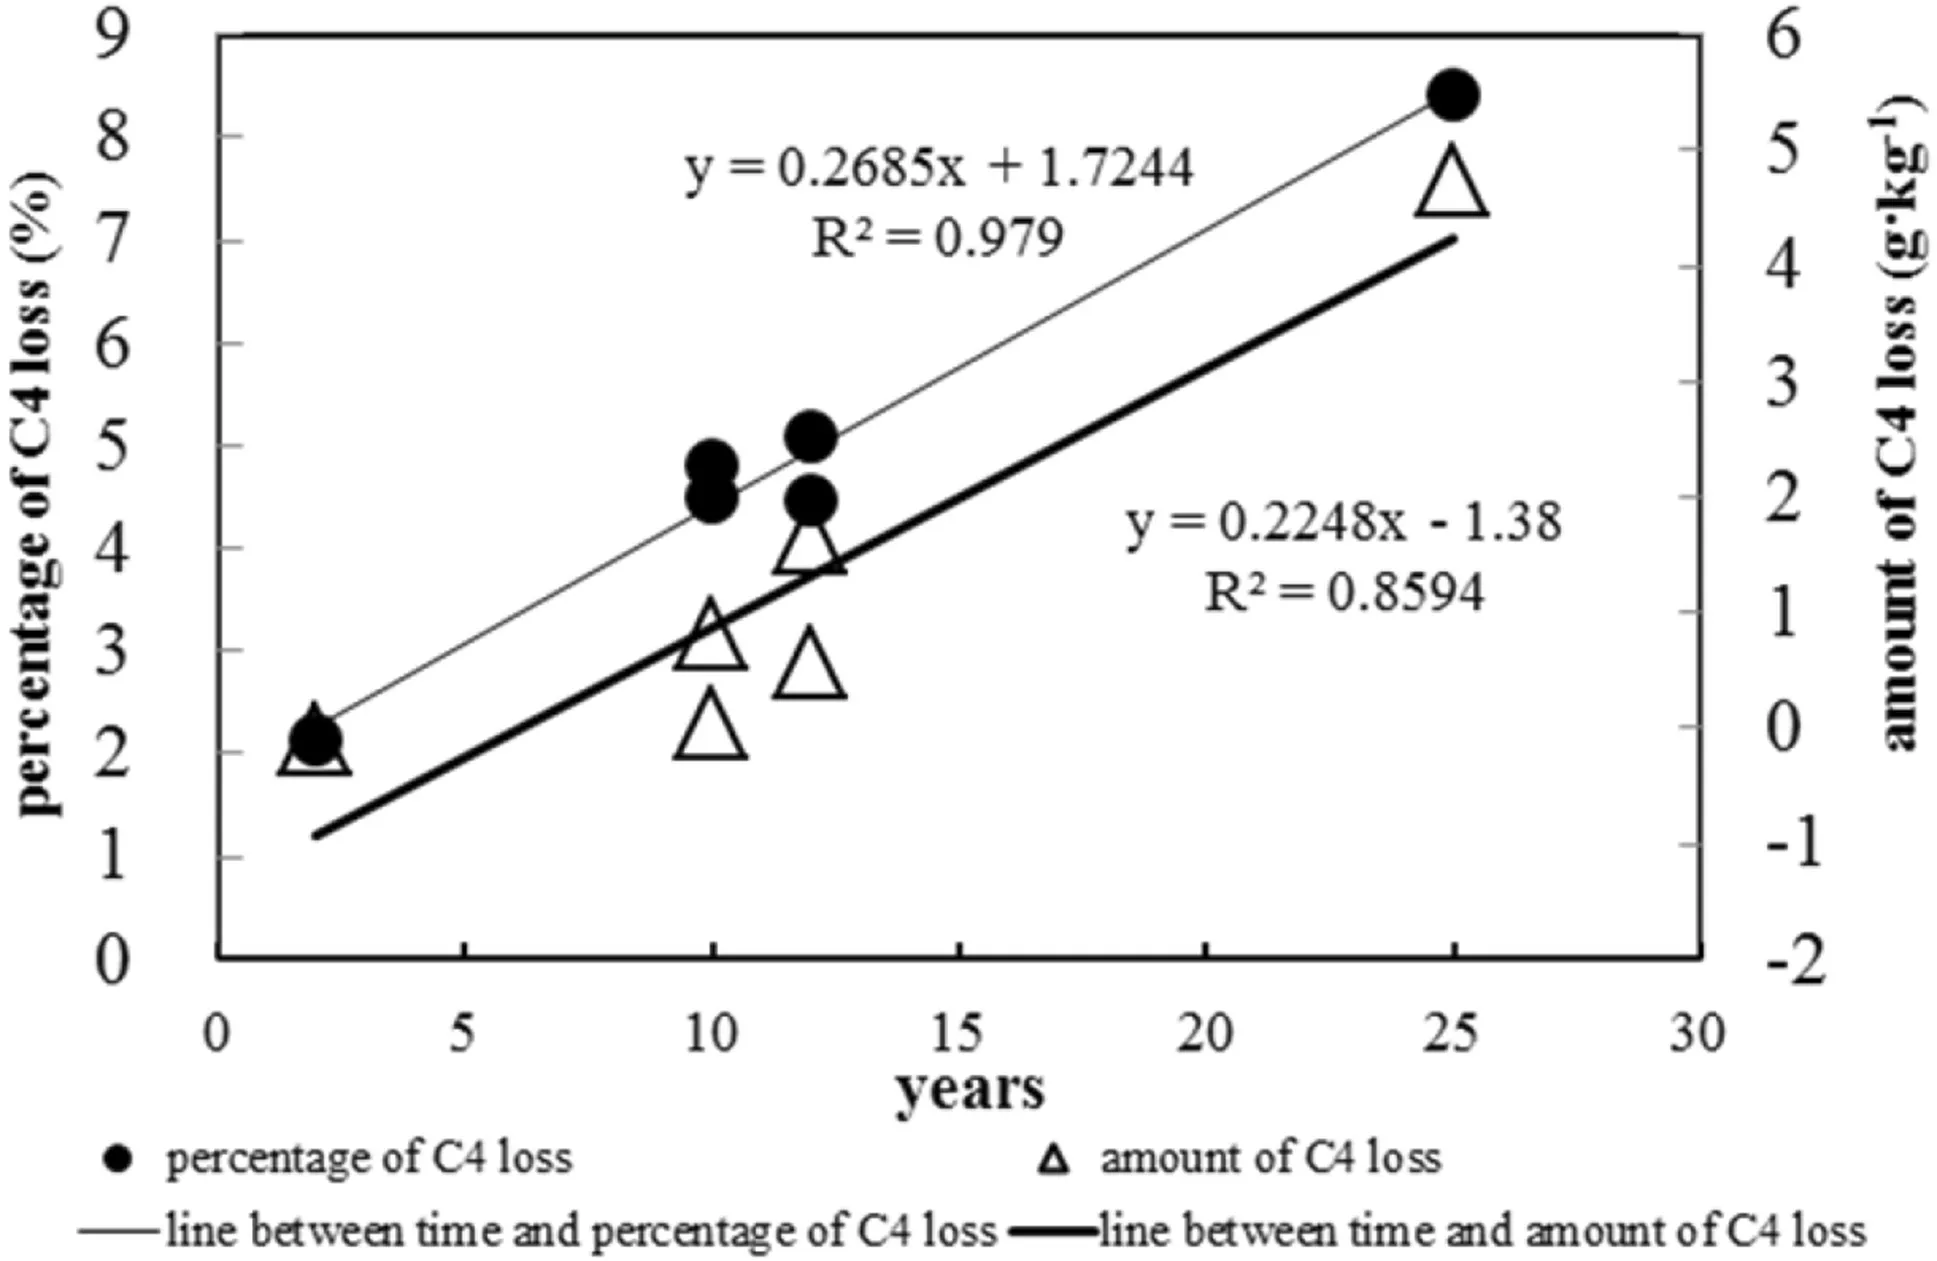
Fig.6 Relationships between amount and percentage of corn-derived carbon and cultivated time at 0–10 cm depth in poplar isolation belts
Owing to lack of in-situ observation,it is very difficult to show the dynamic processes of SOC,especially for new SOC.Since most black soils in the study area had been cultivated with similar agricultural activities for long periods,this study used space instead of time to deduce the dynamics of SOC following LUC.The main conclusions are as follows.
After land-use conversion from original grass fields to cropland,approximately 40%of total SOC in surface soil(0–10 cm)was eroded in the first 5 cultivated years and declined to about 25%of its original value in 40 years,followed by a slow recovery.The trend of SOC above 30 cm is similar to surface soil after conversion to cropland.The losses of SOC below 30 cm showed no clear relationship with cultivation time,whereas some layers showed higher SOC content than corresponding reference soil layers.
Using δ13C values,the amounts and percentages of corn-derived SOC(C4)were estimated by isotope mass balance.The amount and percentage growth of SOC have positive relationships with cultivation time after conversion from original grass fields to cropland.Above 30 cm soil depth,these relationships were significant(p<0.05),but not below 30 cm.The fit between growth of corn-derived SOC and cultivation time(p<0.05)was lower than that between percentage growth of corn-derived SOC and cultivation time(p<0.01)above 30 cm soil depth.The average annual growth rate of corn-derived SOC above 30 cm was 4.5%–5%or 0.11–0.12 g⋅kg-1over 100 years.This means that using percentage to demonstrate the change of new and old carbon was a good method and could eliminate effects of different background SOC content.
SOC increased slightly in the first 10 years of the poplar isolation belts compared with paired corn soil profiles,then decreased in the next 15 years.The percentage loss of corn-derived SOC showed a significant linear relationship with time(p<0.01)in poplar belt surface soil(0–10 cm).Corn-derived SOC as a percentage of the total SOC decreased about 0.34%on average per year in 25 years.
AcknowledgementsThis work was financially supported by the National Natural Science Foundation of China(Grant Nos.41573012;41571130041;U1612441).
杂志排行

Acta Geochimica的其它文章
- Trace element composition of magnetite from the Xinqiao Fe-S(-Cu-Au)deposit,Tongling,Eastern China:constraints on fluid evolution and ore genesis
- Theoretical calculation of equilibrium Mg isotope fractionation between silicate melt and its vapor
- Zinc isotope fractionation under vaporization processes and in aqueous solutions
- The partitioning patterns of nutrients between pods and seeds of Zanthoxylum fruits impacted by environmental factors
- Geological significance of nickeliferous minerals in the Fule Pb-Zn deposit,Yunnan Province,China
- Iron isotopic analyses of geological reference materials on MCICP-MS with instrumental mass bias corrected by three independent methods