Data modelling for crude oil migration studies using ranking method:a rapid geo-tracer technique for geochemists
2018-10-25OluwabamiseFaboyaOluwadayoSonibareOlusolaFaboyaUtkarshAgrawalZewenLiaoEkundayo
Oluwabamise L.Faboya·Oluwadayo O.Sonibare·Olusola T.Faboya·Utkarsh Agrawal·Zewen Liao·O.Ekundayo
Abstract The direction of oil charges within a fi eld in the Niger Delta,Nigeria was determined by the sum of differences ranking method of carbazole concentrations after ascertaining other possible geological constraints on their compositional variations.The principle is that the smaller the sum,the closer the well to the source kitchen.The approach makes use of carbazoles’interaction with the matrix,which leads to a reduction in their concentration with increasing distance from the source kitchen,allowing prediction of the charging direction.A wide range of compositional variations was observed for C1(806.72–2152.90 μg/g)and C2(767–2469.72 μg/g)carbazoles within the fi eld.Based on these results,we inferred a fi lling pathway orientation from west to east.This suggests that the source kitchen—the most promising region for oil exploration—is located in the western part of the oil fi eld.
Keywords Carbazoles isomers·Crude oils·Charging direction·Data modelling
1 Introduction
Understanding migration routes and distances traveled by crude oils from the source kitchen to the reservoir could signi fi cantly facilitate identi fi cation of new hydrocarbon accumulations.However,such information cannot be determined by common geological techniques such as seismic or other remote-sensing surveys.Carbazole and its derivatives in crude oils have recently received considerable attention due to their usefulness as indicators of oil migration distance and direction(Li et al.1995;Larter et al.1996).Carbazoles contain a pyrrole nucleus surrounded by two benzene rings—one on each side.They are capable of forming a hydrogen bond with the surrounding matrix through the N–H functional group of the pyrrole nucleus.For example,a hydrogen bond could form with a stronger electronegative element like the oxygen atom in organic matter or with a hydroxyl group layer on the surface of clay minerals(Li et al.2014).This matrix bonding leads to a reduction in carbazole concentration with increasing distance from the source kitchen.This is considered to be a geochromatographic process in which the predominant mechanism of action is through adsorption(Yang et al.2005).The amounts of the compounds remaining in the oils are basically the difference between the initial concentration expelled from the source rock and the amount lost during migration and accumulation(Yang and Arouri 2016).However,the abundance of these compounds in crude oil and source rocks is also in fl uenced by facies(Bakr and Wilkes 2002),thermal maturity(Zhang et al.2011;Faboya et al.2014),and biodegradation and/or water washing(Huang et al.2003).Nevertheless,authors have successfully mapped out oil migration directions and distances in some hydrocarbon basins(Terken and Frewin 2000;Hwang et al.2002;Duan et al.2013)through spatial distributions of isomeric pyrrolic nitrogen compounds present in the oils(Li et al.1995;Larter et al.1996;Hwang et al.2002;Duan et al.2013).However,when large datasets of oil samples are considered in the determination of oil charges,the process becomes cumbersome,especially when many oil fi elds are involved.
In this work,we introduce the application of the sum of differences ranking method that uses the concentrations of carbazole isomers in tracing the direction of oil charges after ascertaining other possible geological constraints to their compositional variations.
2 Materials and methods
2.1 Sampling
A total of fi fteen crude oils were sampled from well-heads in the ‘‘IK’’ fi eld in the central part of the Niger Delta Basin,Nigeria.Sample locations and well positions are shown in Fig.1.The basin covers about 75,000 km2and consists of regressive plastic sequences of 9–12 km total thickness.The sedimentary sequence is divided into three lithostratigraphic units:the Akata,Agbada,and Benin Formations(Short and Stauble 1967).The Benin Formation is the youngest(Oligocene to recent)and made up of mainly fl uviatile gravels and sands.The Agbada Formation(Eocene to recent)overlies the Akata Formation(Paleocene to Miocene)and is composed of a paralic sequence of interblended sands and shales.The principal source rock in the basin is mainly the continuous marine shale(Akata Formation),with probable contribution from the lower parts of the intercalated marine shale of the Lower Agbada Formation(Mango 1994;Ekweozor and Daukoru 1994).Crude oils are found within the sandstone reservoir of the Agbada Formation.
2.2 Crude oil fractionation
The saturated,aromatic,and polar fractions of the oil were determined using column chromatography withn-hexane,toluene,and an azeotropic mixture of dichloromethane and methanolaseluents,respectively.Carbazole-enriched fractions were obtained from the polar fractions by further fractionation using a column packed with silicic acid and eluted withn-hexane/toluene(1:1,50 mL)(Li et al.1995).
2.3 Analyses of the hydrocarbons and pyrrolic fractions

Fig.1 Sample locations and well positions in the Niger Delta
Analyses of hydrocarbon fractions and pyrrolic-enriched fractions were carried out using gas chromatography–mass spectrometry(GC–MS)and gas chromatography–tandem massspectrometry (GC–MS–MS),respectively.The instruments used and the conditions of the GC are described in Faboya et al.(2014).Carbazoles were quanti fi ed by means of 9-phenylcarbazole as internal standard.
2.4 Data analysis algorithm
A ranking algorithm was used to predict the closeness of wells to the source kitchen based on varying concentrations of methylcarbazoles (MCs) and dimethylcarbazoles(DMCs)in the oils.The theoretical basis is the sum of absolute differences of carbazole concentrations in the oil samples.The principle is that the smaller the sum,the closer the well to the source kitchen.
Four and eleven isomers,respectively,of MCs and of DMCs were detected in oil samples.The following steps were taken to determine the sum of the differences in the sample concentrations.
Step 1MC oil samples were numbered 1–15.
Step 2Samples were ranked by decreasing order of MC concentration for each isomer.A comparison with MC concentrations in the fi eld was performed.Similar to the fi rst ranking,a rank was calculated for all the isomers of MC.
Step 3The sum of ranks was computed by aggregating the ranks of all four isomers of MC.The sample with the lowest value for the sum of ranks was considered to be the closest to the source kitchen and was assigned a new rank of 1,while the one with the highest value was assigned a rank of 15.
Step 4Steps one to three were repeated for all 11 isomers of DMC in the dataset to determine which well was closest to the source kitchen.
Step 5A fi nal sum of ranks was determined from the combined sum of ranks of MCs and DMCs.
3 Results and discussion
3.1 Carbazole occurrence and distribution in crude oils
Chromatograms of the representative oil samples indicate the distribution of carbazole isomers(Fig.2).Peak identities are listed in Table 1.Absolute carbazole concentrations are presented in Table 2.Four and eleven isomers of MCs and DMCs,respectively,were identi fi ed in the oils(Fig.2).4-MC dominated the MC series.The dominance of 4-MC over other MC isomers has also been reported in lacustrine shales from China(Li et al.1995).The shielded isomers of DMC(1,8-,1,3-,1,6-,1,4-,1,5-and 1,7-DMC)were detected in relatively high amounts(except for 1,2-DMC)compared with the exposed isomers,such as 2,6-,2,7-,2,4-,and 2,5-DMC(Fig.2).This pattern has been reported for DMCs in oils and source rocks by other authors(Clegg et al.1998;Zhang et al.2000).

Fig.2 Mass chromatograms showing the distribution of Co–C2-carbazoles(m/z 167+181,195)in a representative oil from the IK fi eld

Table 1 Peak identi fi cation of carbazoles in crude oil
3.2 Source,maturity,and biodegradation assessment of carbazole distribution in crude oils
Apart from the migration-induced fractionation effect,other geological constraints such as source facies,maturity,and biodegradation have also been reported to have an effect on carbazole distribution in crude oils.These factors were examined in the oils under study prior to data modelling.

Table 2 Absolute concentration(μg/g)of carbazoles in crude oils from the IK f i eld in the Niger Delta Basin,Nigeria
Oil samples from the fi eld were generally depleted innalkanes.Representative mass chromatograms of the oils from the fi eld(IK-44 and IK-65)showing unresolved complex mixture(UCM)are shown in Fig.3,indicating that the oils have experienced some level of biodegradation.Therefore,pristane(Pr)/n-C17and phytane(Ph)/n-C18ratios were not computed for the oil samples.Pr/Ph ratios of the oil samples ranged from 1.4 to 2.2(Table 3).The carbon isotopic values of the whole,saturated,and aromatic fractions of the oil ranged from-26.8‰to-27.3‰,-27.0‰ to-27.5‰,and-26.4‰ to-26.7‰,respectively(Table 3).The isotopic differences between the whole,saturated,and aromatic fractions of the oils did not exceed 1.1‰,indicating that the crude oils were derived from the same source(Peters and Moldowan 1993).Ternary diagrams have been previously used to discriminate oils from different source rocks or facies within a source rock(Mackenzie 1984;Peters et al.2005).C27,C28,and C29regular steranes,which often vary with principal source of the organic matter,grouped together in a ternary plot,indicating a single oil source(Fig.4).
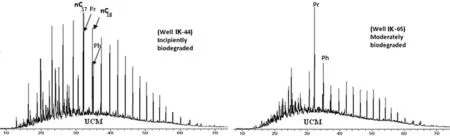
Fig.3 Total ion current(TIC)mass chromatograms of aliphatic fractions of the representative oil samples from the IK fi eld showing unresolved complex mixture(UCM)

Table 3 Source,maturity,and biodegradation parameters computed from the saturated and aromatic compounds in crude oils from central Niger Delta,Nigeria
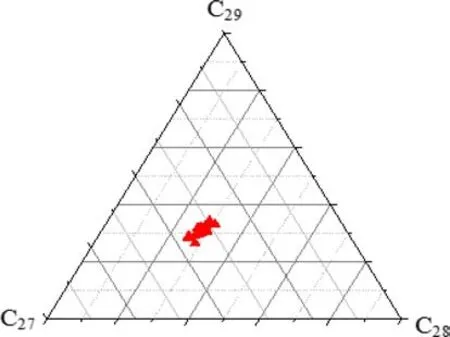
Fig.4 Ternary plot of C27–C29regular sterane distribution in the oils
The Pr/Ph ratio has been previously used to examine the effect of source facies on carbazole isomers(Hwang et al.2002).This ratio was plotted against some individual isomers of MC and DMC to determine possible in fl uence of source facies on carbazole distribution.The plots clearly show no visible trend between carbazole isomers and the source parameter(Pr/Ph)in the fi eld(Fig.5),indicating that source facies does not affect abundance of the compounds in the oils.
The values of 22S/(22S+22R)C31-hopane and 20S/20S+20R C29-sterane computed from the saturated fraction of the oils ranged from 0.51 to 0.56 and 0.35 to 0.42,respectively.These parameters are maturity indicators(Peters and Moldowan 1993),and their values fell within a narrow maturity range.Cross plots of these maturity parameters against MC-(Fig.6)and selectedDMC isomers(Fig.7)show no in fl uence of maturity on carbazole distribution.Methylphenanthrene(MPI-1 and MPI-2)values are also oil maturity indicators.MPI-1 and MPI-2 calculated from the aromatic fraction in the oils ranged from 0.71 to 0.79(Table 3).These values suggest little variation in the maturity status of the oils.The vitrinite re fl ectance(%VRc)of the oils was calculated from the MPI-1 index(Radke and Welte 1983).%VRc values ranged from 0.83 to 0.87(Table 3).These values support the narrow maturity range of the oils.The plots between carbazoles and calculated VRc in the fi eld show no linear association(Fig.8).
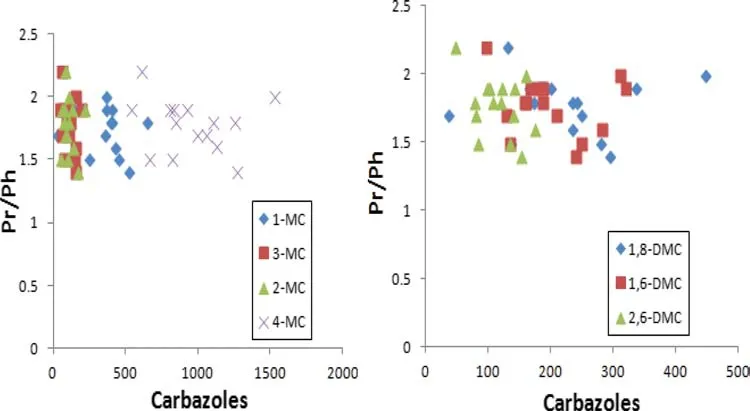
Fig.5 Source assessment parameter(Pr/Ph)plotted against carbazoles
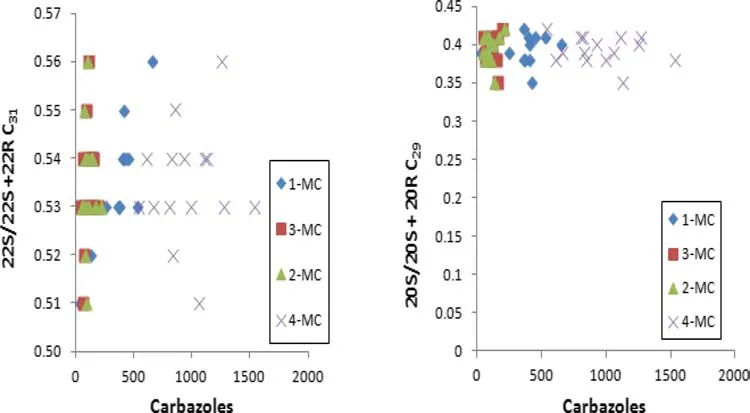
Fig.6 Maturity parameters plotted against methylcarbazoles
The biodegradation assessment parameter,C30αβ hopane/(Pr+Ph),has been used to assess the effect of biodegradation on carbazoles in oils(Huang et al.2003).The ratio of C30H/Pr+Ph in the present oils ranged from 0.04 to 0.10(Table 3).Cross plots between the parameter and carbazoles suggest no in fl uence of biodegradation on carbazole abundance in the oils(Fig.9).
Oils from this fi eld show no in fl uence of source facies,maturity,or biodegradation on carbazole distribution,indicating that the variation in carbazole abundance is due to the geochromatographic effect during oil migration and,thus,carbazoles can effectively be used as an indicator of oil migration in the fi eld.
3.3 Determination of oil charging direction
Carbazole concentrations decrease with distance of oil migration(Hwang et al.2002),and could therefore indicate the direction of hydrocarbon charging.
A histogram of the corresponding ranks as determined by MCs is shown in Fig.10.Figure 11 is a curve of the sum of the ranks for all the isomers of MCs in the fi eld.In this case,IK-43A is the lowest ranked,suggesting that it is the closest to the source kitchen.IK-32A,IK-21,IK-25,and IK-44 ranked very close behind,indicating a similar distance of oil migration.Sample IK-59 is ranked the highest and is thus presumed to be the farthest from the source kitchen based on MCs.IK-19 and IK-1 ranked near IK-59,suggesting similar migration distance.The fi nal sum of ranks computed from the combined sum of ranks of MCs and DMCs is pictorially depicted(Fig.12).This shows that IK-32A is the closest to the source kitchen,with IK-44,IK-43A,and IK-21 nearby.The same three wells had the highest MC-DMC ranking as had the highest MC ranking:IK-19 had the highest DMC ranking,with IK-1 and IK-59 closely following.Samples IK-32A and IK-32B were taken from the same well at different depths,likewise IK-43A and IK-43B.The variations in the concentrations might have resulted from differences in the routes taken to their respective habitats.
A location map of the IK fi eld and the well positions(Fig.1)clearly shows that IK-43,IK-44,IK-21,and IK-25 are all in the western part of the fi eld while IK-59 and IK-1 are in the far eastern part.This arrangement supports what is inferred in the results of the sum of ranks of MCs,indicating a fi lling pathway orientation from west to east.This agreement is quite instructive and shows that MC distribution in oils from the Niger Delta,Nigeria may be better oil migration indicators than DMCs.

Fig.7 Maturity parameters plotted against selected dimethylcarbazoles

Fig.8 Maturity parameter(VRc)plotted against carbazoles

Fig.9 Biodegradation assessment parameter(C30H/Pr+Ph)plotted against carbazoles
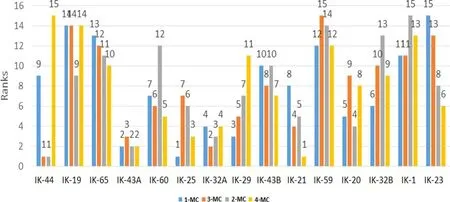
Fig.10 Ranking of individual methylcarbazoles in oil samples

Fig.11 Plot showing sum of the ranks of methylcarbazoles in the oil samples
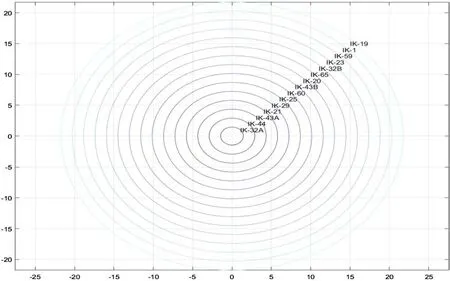
Fig.12 Plot showing total sum of the ranks of methylcarbazoles and dimethylcarbazoles in the oil samples
4 Conclusion
A ranking algorithm of the concentrations of carbazole isomers was combined with knowledge of oil-well positions to determine the charging direction of oils in a fi eld from the Niger Delta Basin,Nigeria.Based on this integrated approach,a west-to-east fi lling pathway is inferred.The source kitchen is believed to be located in the western part of the fi eld,making that the most promising region for oil exploration.
AcknowledgementsThe authors deeply appreciate the Third World Academy of Sciences and Chinese Academy of Sciences for providing the fi rst author(OLF)a postgraduate fellowship toward this research work.
Compliance with ethical standards
Con fl ict of interestThe authors declare that they have no con fl ict of interest.
杂志排行

Acta Geochimica的其它文章
- The effects of clay minerals and organic matter on nanoscale pores in Lower Paleozoic shale gas reservoirs,Guizhou,China
- Age and geochemistry of Early Ordovician A-type granites in the Northeastern Songnen Block,NE China
- Origin and genetic family of Huhehu oil in the Hailar Basin,northeast China
- Genesis of fahlore in the Tianbaoshan lead–zinc deposit,Sichuan Province,China:a scanning electron microscopy–energy dispersive spectroscopy study
- The morphological characteristics of gully systems and watersheds in Dry-Hot Valley,SW China
- State of rare earth elements in the rare earth deposits of Northwest Guizhou,China