The effects of clay minerals and organic matter on nanoscale pores in Lower Paleozoic shale gas reservoirs,Guizhou,China
2018-10-25YuantaoGuQuanWanWenbinYuXiaoxiaLiZhongbinYu
Yuantao Gu·Quan Wan·Wenbin Yu·Xiaoxia Li·Zhongbin Yu
Abstract In organic-rich gas shales,clay minerals and organic matter(OM)have signi fi cant in fl uences on the origin,preservation,and production of shale gas.Because of the substantial role of nanoscale pores in the generation,storage,and seepage of shale gas,we examined the effects of clay minerals and OM on nanoscale pore distribution characteristics in Lower Paleozoic shale gas reservoirs.Using the Niutitang and Longmaxi shales as examples,we determined the effects of clay minerals and OM on pores through sedimentation experiments.Field emission–scanning electron microscopy combined with low-pressure N2 adsorption of the samples before and after sedimentation showed signi fi cant differences in pore location and pore size distribution between the Niutitang and Longmaxi shales.Nanoscale pores mostly existed in OM in the Longmaxi shale and in clay minerals or OM–clay composites in the Niutitang shale.The distribution differences were attributed largely to variability in thermal evolution and tectonic development and might account for the difference in gas-bearing capacity between the Niutitang and Longmaxi reservoirs.In the nanoscale range,mesopores accounted for 61–76%of total nanoscale pore volume.Considerably developed nanoscale pores in OM were distributed in a broad size range in the Longmaxi shale,which led to good pore connectivity and gasproduction.Numerous narrow pores(i.e.,pores<20 nm)in OM–clay composites were found in the Niutitang shale,and might account for this shale’s poor pore connectivity and low gas production ef fi ciency.Enhancing the connectivity of the mesopores(especially pores<20 nm and those developed in OM–clay composites)might be the key to improving development of the Niutitang shale.The fi ndings provide new insight into the formation and evolutionary mechanism of nanoscale pores developed in OM and clay minerals.
Keywords Nanoscale pore·Clay minerals·Organic matter·OM–clay composites·Pore distribution characteristics·Pore connectivity
1 Introduction
The shale gas boom has spread,and large unconventional gas reserves are being explored worldwide.Among the three main unconventional sources(i.e.,shale gas,coalbed gas,and tight gas)that have been exploited commercially,the reserve of shale gas is the largest at 456 × 1012m3—49%of the abovementioned unconventional gas reserves(Zou et al.2013).The proportion of shale gas production among all types of natural gas is likely to increase rapidly in the near future.According to statistics from the U.S.Energy Information Administration(EIA),shale gas production as a proportion of all types of natural gas in the United States increased from 1%in 2000 to 20%in 2010,and the EIA estimates that this fi gure will exceed 50%by 2040(EIA 2011,2012).Shale gas will clearly play an important role in energy over the next few decades.
China has been identi fi ed as having the largest shale gas reserves in the world.Of the fi ve regions with shale gas,the Upper Yangtze and Dian-Qian-Gui area has the most reserves(Zhang et al.2012b).In this region,two marine shales[the Lower Cambrian Niutitang Formationand the Upper Ordovician Wufeng–Lower Silurian Longmaxi Formation(O3w-S1l)]are widely developed and are considered promising shale gas reservoirs(Dong et al.2016).Comparison studies of the characteristics of these two shale reservoirs have been conducted by many scholars,and much signi fi cant advancement have been obtained(Fu et al.2011;Fan et al.2015;Xu et al.2015;Wang et al.2016a).There are many similarities between the two reservoirs.For example,both formations are organic-rich marine shales with similar total organic carbon(TOC)content and a high thermal maturity(Ro).The brittle mineral contents of both formations are also similar(Fu et al.2011;Dong et al.2016).In addition,the main productive layers are in the lower portions of the two strata because of the high TOC,which may be the result of the sedimentary environment(Xu et al.2015).However,there exists a big difference in gas-bearing capacity between the two reservoirs.The O3w-S1l shale,mostly distributed in the Sichuan Basin,has been exploited commercially in the Jiaoshiba shale gas fi eld,with cumulative production from this formation exceeding 60×108m3in 2015(Dong et al.2016).However,so far,successful commercial gas production has not been obtained from mostshale gas wells,which have mostly been developed along the outer edge of the Sichuan Basin(Fan et al.2015;Tian et al.2015;Zhao et al.2015).The gas-bearing capacity of theshale reservoir is in the range of 0.50–6.02 m3/t and the average capacity(1.29 m3/t)is about half that of the O3w-S1l shale(2.68 m3/t)(Dong et al.2016).The two reservoirs primarily differ in three aspects:reservoir physical properties,thermal evolution,and structural movement.First,the porosity and permeability of theshale are both inferior to those of the O3w-S1l shale(Fan et al.2015;Dong et al.2016),indicating that the O3w-S1l shale may have a larger storage capacity and a better recovery ef fi ciency than theshale.Second,the formation time of theshale(570 Ma)was approximately 122–132 Myr earlier than that of the O3w-S1l shale(448–438 Ma)(Zou et al.2015),which could have resulted in a difference in thermal evolution.Theshale has Ro>3.0%,which may result in the reduction of organic matter(OM)pores and the cessation of hydrocarbon generation(Chen and Xiao 2014;Fan et al.2015;Dong et al.2016).The Roof the O3w-S1l shale is mostly between 2.0%and 3.2%,a range in which OM could still generate hydrocarbon and pores(Fan et al.2015).Therefore,thermal evolution may be one of the reasons for the difference in gas-bearing capacity between the two formations.Lastly,in the evolutionary process,tectonic movement has an important effect on the preservation of shale gas(Guo and Liu 2013;Liu et al.2016b).Tectonic movement can cause fractures in reservoirs.Such fractures allow migration and loss of shale gas;at the same time,the fractures could promote transformation of the reservoir and improve the performance of hydraulic fracturing.The network-like fractures caused by multi-period detachment zones and tectonic movement in the lower S1l are critical factors for the enrichment and high-yield production of shale gas.The sandy mudstone of the upper S1l and limestone of the upper O3provide favorable vertical storage conditions for S1l shale gas accumulation(Guo and Liu 2013).In contrast,the older formation time of theshale means that these reservoirs are more complex.Due faults and denudation in theshale,large amounts of shale gas have been lost(Wang et al.2016b).Additionally,the development of dolomite in the strata underlying then formation is not conducive to the storage of shale gas.
Pore distribution characteristics,especially those of nanoscale pores,can re fl ect the evolution of shale gas reservoirs.Besides pore characteristics,various factors may affect the development of shale gas,including TOC content,kerogen type,Ro,mineral composition,tectonic movement,etc.The fundamental importance of nanoscale pores in shale gas research has been rationalized by their strong association with the above factors.In fact,nanoscale pores have been shown to be the main space for the generation,storage,and seepage of shale gas(Loucks et al.2009;Nelson 2009;Chalmers et al.2012;Curtis et al.2012).Thus far,there is a consensus that there are two main types of nanoscale pores:those in OM and those in clay minerals(Slatt and O’Brien 2011;Loucks et al.2012;Kuila et al.2014;Yang et al.2016).There are great differences between these two types of pores.First,their origins are different.Shale gas mostly comes from the thermal maturation and conversion of OM(Loucks et al.2009).During this transformation,numerous pores are generated in OM.Clay mineral pores mostly originate from the stacking of clay layers.There is a great difference in the gas-bearing capacity of these two types of pores.Due to their genesis,OM pores should be the main spaces for the generation and storage of shale gas.In addition to the above two types of pores,there is another kind of pore developed in OM–clay composites(Kennedy et al.2014;Yang et al.2016).Due to the catalysis of clay minerals,these pores may show certain particularity in the generation and storage of shale gas.In general,for the OM–clay composites,OM and clay minerals play different roles during the exploitation of shale gas.As the origin and carrier of hydrocarbon,OM provides a favorable material base for hydrocarbon generation,but high content of clay mineralscould be a disadvantage during hydraulic fracturing due to the strong water sensitivity of clay minerals(Ding et al.2012;Ju et al.2014;Wu et al.2014).
At present,it is still not entirely clear how the three types of pores(OM,clay mineral,and OM–clay composites)are distributed in shale reservoirs,how the distribution formed,or how the distribution in fl uences the reservoir gas-bearing capacity and the stimulation of the reservoir.To answer these questions,combining the intrinsic differences between S1l andshales,this study examined the distribution characteristics of nanoscale pores in clay minerals and OM using low-pressure N2adsorption and fi eld emission-scanning electron microscopy(FE-SEM).Based on our results,we assessed the reasons for the distribution of pores and discussed the signi fi cance of the distribution on the exploration and development of shale gas.The results of this work provide valuable information for the exploitation of shale reservoirs.
2 Samples and methods
2.1 Samples
According to previous studies on theand Sl shale
1reservoirs(Yang et al.2012;Zhang et al.2012a;Lu et al.2015;Zhao et al.2016),the lower strata of both theand S1l formations contain high contents of brittle mineral and TOC and are favorable for shale gas exploration and development.Thus,two shale samples from the lowerwere collected from an outcrop section in Zunyi and a borehole in Kaiyang,Guizhou Province;and two shale samples from the lower S1l were obtained from a shallow hole in Xishui,Guizhou Province.The four samples were compared in terms of pore distribution characteristics,TOC content,Ro,mineralogical composition,low-pressure N2adsorption,and FE-SEM.Figure 1 shows sampling site locations and the regional geology.
2.2 Sedimentation experiments
To better analyze pore distribution in clay minerals,sedimentation experiments were conducted on the four samples.First,we weighed 5 g of powdered sample in a beaker and added deionized water to soak the powder.Then,the sample was agitated and ultrasonicated to disperse the powder adequately.The suspension was allowed to stand for 8 h before the upper layer of the suspension(10 cm)was extracted via siphon.After the extraction,a volume of deionized water equal to that extracted was added to the beaker,and the agitation and resting procedures were repeated twice.Next,the extracted suspension layer was centrifuged at 7000 r/min to remove the water,and the solid was dried in an oven at 40°C(Ding et al.2013).TOC content analysis,mineralogical composition analysis,and low-pressure N2adsorption were conducted on these four extracted suspension samples.
2.3 Organic geochemical analyses
The TOC of each sample was measured using a vario MACRO cube organic element analyzer following the Chinese Oil and Gas Industry Standard GB/T19145-2003.Before the measurement was taken,inorganic carbon in the sampleswaseliminated by the addition ofdiluted hydrochloric acid at a ratio of HCl:H2O=1:7(V/V).
Due to the absence of vitrinite in the Lower Paleozoic marine shale,bitumen re fl ectance(Rb)was measured to determine Roof samples.Through previous research on thermalmaturity,laserRamanspectroscopyhasbeenshown to be a suitable method to calculate bitumen re fl ectance(Kelemen and Fang 2001;David 2013;Chen et al.2015).A Renishaw Invia Re fl ex Laser Raman Spectrometer was usedtomeasuretheRbvaluesofallsamples.Inthiswork,the calculation of Rbfollowed the equation:Rb=0.0537 d(G-D)-11.21(Liu et al.2012),whereG,D,andd(G-D)denote peak positions of graphitic carbon,and disordered carbon,and the inter-peak intervals between G and D,respectively(Kelemen and Fang 2001;Liu et al.2012).The relation Ro=(Rb+0.2443)/1.0495 was used to calculateRoaccordingtotherelationshipbetweenRbandRo(Schoenherr et al.2007).
2.4 Mineralogical composition
A PANalytical Empyrean X-ray diffractometer(XRD)was used to determine the mineralogical composition of the samples.The testing angle ranged from 5°to 80°.The samples were crushed and ground to 200 mesh,and the results were analyzed quantitatively following the Chinese Oil and Gas Industry Standard(SY/T)5163-2010.
2.5 Field emission–scanning electron microscopy
Before SEM observation,all samples were polished by a Technoorg SC1000 argon ion polisher operated at an 8-kV acceleration voltage to obtain a smooth surface.Then,the samples were sputter coated with gold.A FEI Scios FESEM was used to characterize the distribution of nanoscale pores in shale samples.
2.6 Low-pressure N2adsorption
Low-pressure N2adsorption experiments were conducted on a Quantachrome Autosorb-iQ2automatic gas absorption analyzer.To remove the free water and small amounts of volatile impurities,all samples were outgassed at 150°C for 4 h before adsorption measurements.The N2adsorption isotherms were obtained at 77 K(-196°C),and the relative pressure(p/p0)ranged from 10-6to 0.99.The speci fi c surface area(SBET)was calculated using the multi-point Brunauer–Emmett–Teller(BET)method.The pore volume was acquired using the nonlocal density functional theory(NLDFT).
3 Results
3.1 Composition of shale samples
The TOC and Roof all samples are shown in Table 1.Theshale samples had a higher TOC than the S1l shale samples.Both of the1n shale samples were in a state of over-maturation with an Roof more than 3.0%,while the S1l shale samples were in a high-maturity state with an Roranging from 2.4%to 2.7%,highly consistent with the description in the literature(Chen and Xiao 2014;Fan et al.2015;Dong et al.2016).
XRD was used to semi-quantitatively estimate the mineralogical composition of the four samples(Table 1).Considering the accuracy of the(SY/T)5163-2010 quantitative method,we suspect that certain errors exist in the calculation of mineral content.However,the mineral content trends can still be trusted.Dominant minerals in the S1l samples included quartz,illite,kaolinite,and plagioclase,and minor minerals included pyrite,dolomite,and calcite.The similarity between the components of the S1l-1 and S1l-2 samples may be because the sampling sites are so geographically close that the sedimentary environment is similar.For the1n shale,the two samples presented quite different mineral compositions perhaps due to differences in sedimentary environment.The1n-1 sample contained an extremely high content of quartz and a small amount of clay minerals.In contrast,a much lower quartz content and higher contents of illite,kaolinite,plagioclase,and dolomite were detected in1n-2.
To evaluate the effect of clay minerals and OM on pore distribution,sedimentation experiments were performed to extract clays and OM.The TOC and mineralogical composition of the suspension samples were also tested(Table 1).The TOC values of the suspension samples were greater than those of the corresponding primary samples because of the low density of OM.For all the samples,we found that the brittle mineral(quartz,plagioclase,calcite,and dolomite)contents of the suspension samples were less than that of the primary samples.The clay mineral content of the suspension samples,principally illite,was generally much greater than that of the primary samples.The differences in mineralogical composition between the primary and suspension samples could be attributed to the smaller particle size and the lower density of the clay mineral content relative to that of brittle minerals.

Table 1 Mineralogical composition and total organic carbon of the primary and suspension samples
3.2 Nanoscale pore characteristics from lowpressure N2adsorption
Low-pressure N2adsorption is one of the most common techniques used to characterize nanoscale pore structures in shale gas reservoirs as it can provide a reliable assessment of surface area,pore volume,and pore size distribution(PSD).Low-pressure N2adsorption–desorption isotherms for the four samples are shown in Fig.2.According to a re fi ned International Union of Pure and Applied Chemistry(IUPAC)grouping method(Sing et al.1985;Rouquerol et al.1994,1999),the isotherms of all the primary samples can be classi fi ed as Type IIb.The sharp increase in adsorption volume at extremely low relative pressure(P/P0< 0.01)is most likely the result of micropore(< 2 nm)fi lling.The monolayer-multilayer adsorption on mesopore(2–50 nm)walls occurs at intermediate P/P0.The existence of macropores(>50 nm)results in the absence of a plateau(as in mesoporous Type IV isotherms)and a steep slope in the P/P0range of 0.98–1.00(Rouquerol et al.1994,1999).Both the S1l samples exhibited an apparently similar type H3 hysteresis loop,and the twosamples presented an inconspicuous type H3 hysteresis loop.This hysteresis loop shape indicates that our samples contained composites of plate-like particles(e.g.,clay minerals)and non-rigid slit-shaped pores(Rouquerol et al.1999).
Table 2 shows the pore structure parameters of the four samples,including SBET,pore volume,and average pore diameter.The average SBETof the S1l and1n samples was 32.3 and 37.1 m2/g,respectively,and the average total pore volume(Vtotal)was 0.055 and 0.056 cm3/g,respectively.The mesopore volume(Vmesopore)accounted for 61–76%of the total pore volume in the four samples,while micropore volume(Vmicropore)accounted for 7–14%of the total pore volume.
Low-pressure N2adsorption was conducted on the suspension samples to analyze the nanoscale pore characteristics.The N2adsorption–desorption isotherms of the suspension samples are shown in Fig.2.Similar to the primary samples,all the suspension samples presented Type IIb isotherms and an inconspicuous type H3 hysteresis loop,indicating little difference in the pore types between the primary and suspension samples.However,there was a large difference in adsorption volume.At low P/P0(<0.01),the adsorption volumes of the S1l shale primary samples were larger than those of the suspension samples,which may be due to fewer micropores and small mesopores in suspension samples.However,for theshale,the two samples presented different patterns of adsorption volumes before and after extraction,which means the changes of micropores and small mesopores were different forand(see Sect.4.1.2).The variation in adsorption volumes at low P/P0between suspension samples and primary samples is probably caused by the pores developed in OM.From Figs.3 and 4,OM pores developed much more in S1l shales than inshales and the OM pore size of S1l shales was much larger than that ofshales.Because adsorption volumes at low P/P0mainly depend on micropores and small mesopores,the variation in adsorption volumes at low P/P0may be attributed to the higher TOC in suspension samples.At high P/P0(0.98–1.00),the adsorption volumes of the suspension samples were much larger than those of the primary samples for both the S1l andshales.The large increase of adsorption volumes at high P/P0for S1l shales can be ascribed to the abundant macropores in suspension samples,and the macropores may stem from the stacking of clay-sized particles and from primary pores formed in OM(Fig.3)during evolution.Due to the absence of primary macroporesinshales (Fig.4),increased adsorption volumes at high P/P0are thought to primarily be from the macropores created manually during extraction.
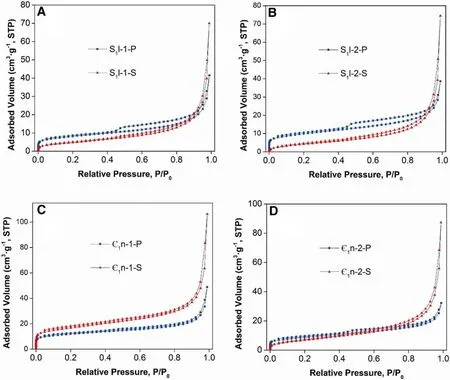
Fig.2adsorption–desorption isotherms of primary samples(P)and suspension samples(S).a,b present the shale,c,d present theshale
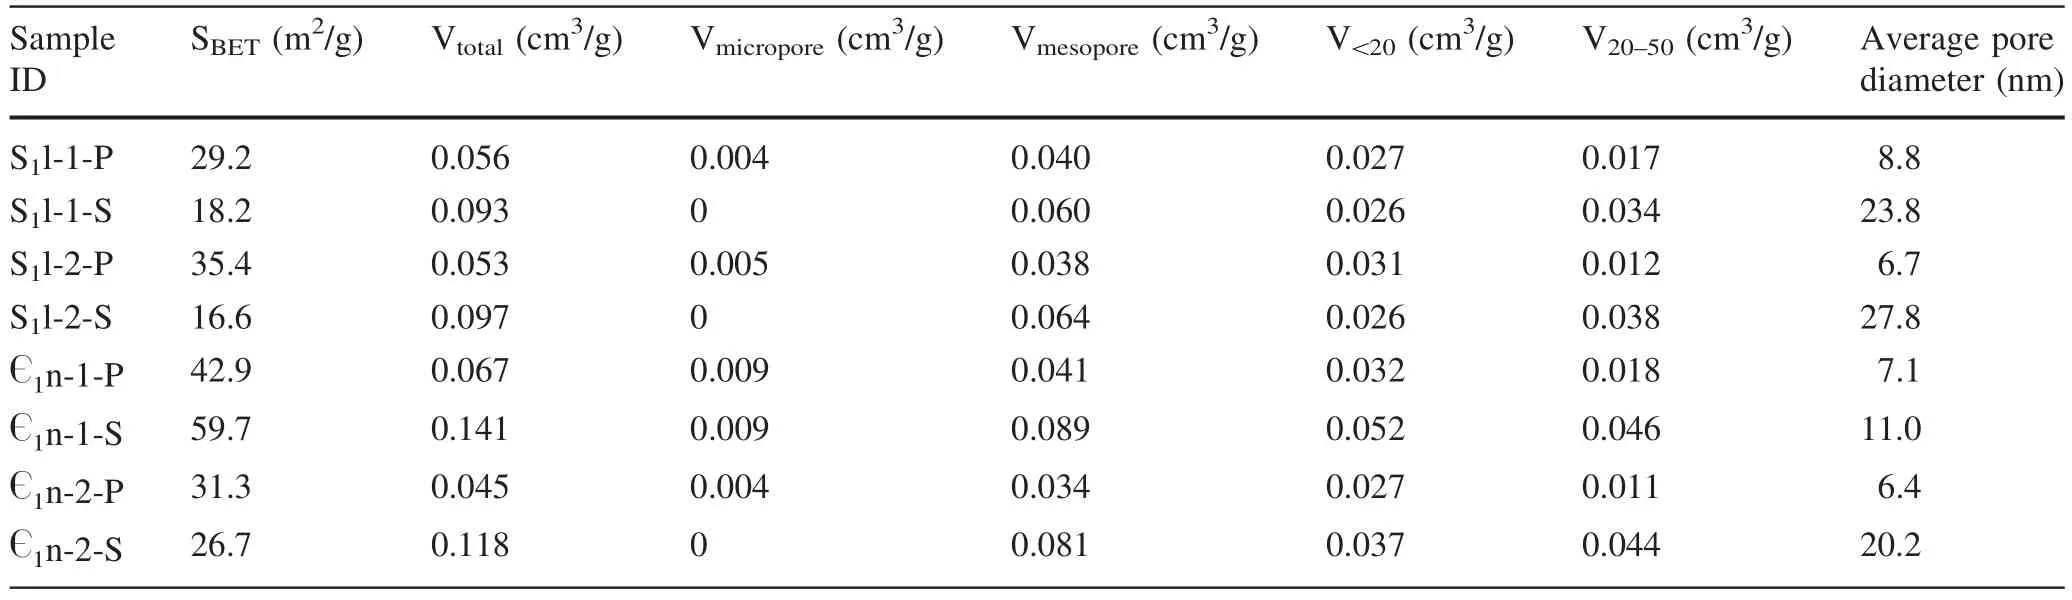
Table 2 Pore structure parameters of primary and suspension samples

Fig.4 Field emission–scanning electron microscopy images for the shale.a–d and e–h present the microstructure characteristics of
To more clearly understand the difference in PSD between the primary samples and suspension samples,pore structure parameters including SBET,pore volume,and average pore diameter were measured.Compared with the primary samples,the SBETof the suspension samples was lower except forthis anomaly was likely because there were still micropores in-1-S(Table 2).In addi-tion,the difference in SBETbetween-2-P and-2-S was less than that between the S1l primary samples and suspension samples.There were few micropores in the suspension samples except in,perhaps due to the long period(approximately 8 h)for which the samples were soaked in water during sedimentation.It is very likely that water molecules could occupy sorption sites in the micropores and that pore throats could be blocked by dispersed or dissolved clay because of the strong water sensitivity of clay minerals(Chalmers and Bustin 2007;Ju et al.2014).In,the micropore volume was approximately twice that of the other three samples,and the clay mineral content was much less than that of the other three samples,which could result in insuf fi cient blocking of the micropores.As seen in Table 2,the Vtotaland Vmesoporeof all the suspension samples were signi ficantly greater than those of the primary samples,likely due to the greater illite content and TOC.In addition,claysized particles in suspension samples facilitated creation of new nanopores during extraction,meaning that partial pore volume(especially for Vtotaland Vmesopore)in suspension samples probably derived from the stacking of clay particles.Furthermore,the average pore diameter(the pore volume at the highest P/P0divided by SBET)of the suspension samples was consistently greater than that of the primary samples,which may be the result of fewer micropores and more macropores.
3.3 Nanoscale pore characteristics from fi eld emission–scanning electron microscopy
To further clarify the nanoscale pore characteristics of the four shale samples,FE-SEM was used to directly observe the pore structures and to evaluate the distribution position of pores.The pores of shale samples can be classi fi ed as OM pores,interP pores(pores between particles or crystals),intraP pores(pores within particles),and microfractures(Loucks et al.2012;Yang et al.2016).Figure 3 shows the microstructure characteristics of the S1l shale,including widely developed OM pores and interP(intercrystal)pores.In this shale,there were few OM–clay composites and few pores in clay minerals.In addition to pore characteristics,microfractures found between mineral grains and OM grains could have important effects on the storage and permeable migration of shale gas(Hartman et al.2011;Slatt and O’Brien 2011).Images of theshale are presented in Fig.4.Theshale was very different from the S1l shale;few OM pores were found in eithersample,while pores in clay mineral or OM–clay composites were well developed and the composites seemed to have a preferred orientation.This arrangement may be attributed to the function of strata pressure and the formation and evolution of OM–clay composites.Microfractures developed much better in theshale than in the S1l shale.This phenomenon may be closely associated with the development of tectonic movement and the high over-maturation of theshale(Chen and Xiao 2014).The sedimentary environment,evolution process,and tectonic movement may explain why the distribution of pores in the S1l shale andshale are so different.A detailed discussion is presented in Sect.4.2.
4 Discussion
4.1 Nanoscale pore distribution regularities of different pore sizes in clay minerals and organic matter
4.1.1 Occurrence nanoscale pores
FE-SEM images of the two shales indicate that nanoscale pores occur in different substrates in theshale and S1l shale.In the S1l shale,nanoscale pores were mostly observed in OM,while in theshale,nanoscale pores were mainly observed in OM–clay composites and clay minerals.As the most important pore components,the location of mesopores has a signi fi cant effect on the storage,seepage,and exploitation of shale gas.Mesopore volume dominated all samples,and Vmesoporeof suspension samples was much greater than that of primary samples.However,there are different reasons for the greater Vme-soporein the suspension samples for theshale and S1l shale.The Vmesoporeof the suspension samples was approximately 2.2–2.4 times that of the primary samples for theshale.Considering that TOC increased only a little after sedimentation,the greater Vmesoporemay be because of the much greater illite content in the suspension samples,consistent with FE-SEM observations(Fig.4)of well-developed pores in OM–clay composites,and suggests OM–clay composites are the main substrates for mesopores.For the S1l shale,Vmesoporeof the suspension samples was approximately 1.5 times that of the primary samples.By coincidence,the TOC of the suspension samples was also approximately 1.5 times that of the primary samples.In combination with FE-SEM results(Fig.3)showing well-developed OM pores,it can be speculated that the greater Vmesoporeis due to greater TOC in the suspension samples,suggesting that mesopores have mainly developed in OM.
4.1.2 Pore size distribution characteristics
The PSD(NLDFT)results for the primary samples and suspension samples are shown in Fig.5.The primary samples were dominated by micropores and mesopores,and the plot presents a clear bimodality with two peaks near 1 and 2–10 nm.The PSD curves for the primary samples and suspension samples are similar except for the micropore distribution,indicating that the pore types in the primary and suspension samples are consistent with each other.There were two main differences in PSD between the primary and suspension samples.First,in contrast with the primary samples,micropores were relatively scarce in the suspension samples.Second,mesopores and macropores were more prevalent in the suspension samples than in the primary samples.The above two points may be why the average pore diameters of the suspension samples were much larger than those of the primary samples(Table 2).The exaggerated peak of the small mesopores in theshale suspension samples compared to the S1l shale suspension samples may the result of higher thermal evolution and greater pressure in theshale.
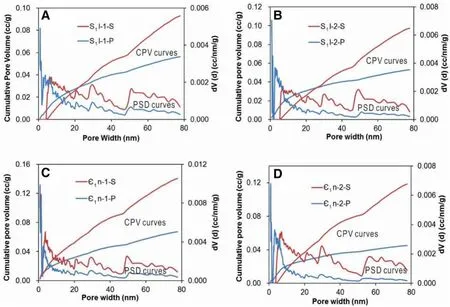
Fig.5 Pore size distribution of primary(P)and suspension(S)preparations for all samples.a,b present the shale,c,d present the shale.CPV cumulative pore volume,PSD pore size distribution
The consistent intersection of the cumulative pore volume curves for the primary samples and suspension samples(Fig.5)indicates that the pore volumes of primary samples are larger than those of the suspension samples when the pore size is less than the intersection value.When the pore size is greater than the intersection value,the pore volumes of the primary samples are lower than those of the suspension samples.The intersections for the S1l shale are>20 nm,while those for theshale are<15 nm.To quantitatively compare variations in pore volume lower and higher than the intersection,20 nm was selected as a boundary to analyze the pore volume variation of different pore sizes(V<20and V20–50)between the primary and suspension samples(Table 2).For all primary samples,the average pore diameters(6.4–8.8 nm)fell within the small mesopore range,and V<20was almost 1.5–2.6 times more than V20–50.Small mesopores are clearly the dominant pore component in both the Sl andshale samples.In
1contrast with the primary samples,the V<20and V20–50of the suspension samples presented different variation trends between theand S1l shales,as shown in Fig.6.For theshale,both the V<20and V20–50of the suspension samples were much greater than the primary samples for two reasons: fi rst,the contents of clay minerals(including illite in OM–clay composites)in the suspension samples were higher than in the primary samples(Table 1);second,many mesopores were observed in clay minerals and OM–clay composites(Fig.4).The S1l shale exhibited different characteristics from theshale.In contrast with primary samples,the V<20of suspension samples was relatively low,which may be attributed to fewer micropores and small mesopores in the suspension samples(Fig.5).The V20–50of the suspension samples was clearly larger,as in theshale,which may be caused by higher TOC content in the suspension samples and the abundant large mesopores in OM(Figs.3,5).Thus,for the S1l shale,sedimentation caused a weak decrease in V<20and a large increase in V20–50.

Fig.6 Pore volume variation for different pore sizes for the primary(P)and suspension(S)samples.a Presents the variation in pore volume for pores<20 nm,b presents the variation in pore volume for pores between 20 and 50 nm
4.2 Effects of evolution process and tectonic movement on pore distribution
According to previous studies,theand S1l shales were deposited under an epicontinental sea sedimentary environment(Liang et al.2009).The lower strata of theand S1l shales—the main production layers of gas—were deposited in a deep-water shelf environment(Yang et al.2012;Zhang et al.2012a;Lu et al.2015;Zhao et al.2016),in which high contents of silica and OM foster the formation of shale gas reservoirs.
The formation and evolution process of shale gas reservoirs can be divided into two stages:the hydrocarbon generation stage and hydrocarbon expulsion stage.In the f i rst stage,large amounts of hydrocarbons are generated,resulting in the development of OM pores and possibly the formation of overpressure(Liu et al.2016a).According to previous studies,theshale—with a maximum burial depth>9000 m(Liu et al.2016b)—reached over-maturity in the Late Permian(250 Ma)(Jiang et al.2015).Later,theshale entered into the hydrocarbon expulsion stage,and many tectonic events occurred(such as the Indosinian,the Yanshan,and the Himalayan),which may have caused a series of folds and fractures.During this stage,OM pores developed well and could have been connected by the microfractures that often accompany other tectonic features.Faulting and denudations could cause gas in the OM pores to migrate along the microfractures and dissipate out of the source rock.Subsequently,it is likely that pores in the over-mature OM could not stand the great pressure of overlying strata and would have become severely compacted(Tian et al.2015).The combined action of gas dissipation and pore compaction may explain the observation of less-developed or smaller OM pores in the lower strata of theshale reservoir(Fig.4).Most of the OM–clay composites observed in this shale were lenticular(Fig.4)and may have formed more tightly sealed compartments for the gas in the pores,either because the clay minerals provided barriers,or because the shape was less subject to leakage.The pores in the composites are not easily connected with outside regions because of the blockage of clay layers and the formation of aggregate seals.Consequently,it may be more dif fi cult for hydrocarbons in OM–clay aggregate pores to migrate outward,which could help maintain a local overpressure and prevent pores in the OM–clay composites from being compacted(Fig.4).
For the S1l shale gas reservoir,the maximum burial depth is approximately 6500 m,considerably less than in theshale(Liu et al.2016b);however,the S1l shale is also in a high-over-maturity stage(Table 1).According to previous studies,the S1l shale reached peak thermal evolution in the Late Cretaceous(approximately 80 Ma)(Cao et al.2015).Prior to reaching peak thermal evolution,tectonic events(such as the Indosinian and Yanshan)were relatively strong in and around the Sichuan Basin.In this period,the S1l shale may have still been in the hydrocarbon generation stage.With increasing thermal maturity,more and more hydrocarbons are generated and accumulated in OM pores,which may be the reason why the S1l shale has a very high-pressure coef fi cient(1.0–2.1)(Dong et al.2016).After reaching peak thermal evolution,greater tectonic stability and the favorable vertical storage condition of the S1l shale prevented large amounts of hydrocarbons from dissipating(Guo and Liu 2013).The overpressure in OM pores could thus be maintained,preventing the OM pores from being compacted by the pressure of overlying layers,and perhaps providing a home for great reserves of hydrocarbons(Fig.3).These conditions also mean that the second stage,i.e.,the hydrocarbon expulsion stage,exhibited a moderate dissipation of hydrocarbons in the S1l shale gas reservoir.
The two shale reservoirs exhibit a large difference in tectonic development,perhaps due to the spatial–temporal distribution of the strata.Theshale is mostly in the southeast of the Sichuan Basin,where many faults have been observed(Fig.1),while the S1l shale is primarily within and along the margins of the Sichuan Basin,where there are fewer faults and the strata are in a relatively stable tectonic environment(Fig.1)(Liu et al.2016b).This difference could result in a more ef fi cient hydrocarbon expulsion in theshale than in the S1l shale.The thermal evolution and the spatial–temporal distribution of tectonic movement could be the most important reasons for the difference in present-day gas-bearing capacity between the S1l andshales.
4.3 Relationship between pore distribution characteristics and the exploitation of shale gas
Hydraulic fracturing is the core technology for the exploration and development of shale gas.The technology primarily aims to connect more pores and promote the seepage of shale gas.Based on the comparison of pore characteristics discussed earlier,it is reasonable to conclude that the OM pores are more accessible than the pores in OM–clay composites.The extensive development of OM pores in S1l shale implies that the S1l shale has better pore connectivity than theshale,substantiating previous research(Wang et al.2016a;Sun et al.2017)and making successful exploitation of the S1l shale more likely.However,for theshale,although natural fractures are common between minerals grains and OM grains(Fig.4),the nanoscale pores developed in OM–clay composites are not as easily connected by fractures because of the obstruction of clay layers.Furthermore,numerous small mesopores(e.g.,pore size<20 nm)developed in suspension samples(Figs.5c,d,6a).Solving the problem of connecting these small mesopores in OM–clay composites or clay minerals may lead to successful commercial exploitation of theshale.
At present,it is dif fi cult to access the nanoscale pores(especially those pores<20 nm)in OM–clay composites using hydraulic fracturing;this dif fi culty may be the result of the sensitivity and expandability of clay minerals.Due to their sensitivity to water,clay mineral particles block pore throats as they migrate with the injected hydraulic fracturing fl uid(Chen et al.2010;Ju et al.2014).The expandability of clay minerals means that their high concentration is not conducive to the formation of net-shaped fractures(Ju et al.2014).Thus,the invention of new exploitation methods may be needed to connect nanopores and improve the recovery ef fi ciency of shale gas in theshale(Ju et al.2014).
5 Conclusions
Given the different roles of clays and OM in shale gas reservoirs,we studied the control of clay minerals and OM on nanoscale pore distribution characteristics from two aspects.The fi rst aspect focused on the location of nanoscale pores.In the S1l shale,nanoscale pores were mostly found in OM,while for theshale,nanoscale pores in clay minerals or OM–clay composites were the most common and there were few OM pores.The distribution differences depended largely on the thermal evolution and tectonic development of the reservoirs,which might be the primary reasons for differences in gas-bearing capacity between theand S1l shale reservoirs.The second aspect was concerned with differences in the total pore volumes of different pore size ranges.For both theshale and the S1l shale,mesopores were the most important components of the three kinds of pores(micropores,mesopores,macropores).Combining FE-SEM with N2adsorption,OM was found to be the main medium for mesopores in the S1l shale,while mesopores developed much better in OM–clay composites in theshale,especially for pore size<20 nm.
The location of pores with different pore size ranges could affect pore connectivity,and,consequently,have signi fi cant in fl uence on the performance of hydraulic fracturing.Because of the good connectivity of OM pores,most OM pores could be accessed by fracturing in the S1l shale.However,in theshale,the numerous pores<20 nm in OM–clay composites are dif fi cult to access using current technology because of the protection offered by clay layers.We suggest that the difference in the distribution characteristics of the three types of pores(OM,clay mineral,and OM–clay composite)between theshale and S1l shale might be one of the reasons the production ef fi ciency of the S1l shale is much better than that of theshale.The exploitation of mesopores,especially for pores<20 nm and developed in OM–clay composites,may be important for the exploration and development ofshale.
AcknowledgementsThis work is supported by the Chinese Academy of Sciences(‘‘Hundred Talents Program’’),the National Natural Science Foundation of China(41473064),and the State Key Laboratory of Ore Deposit Geochemistry(SKLODG-ZY125-09).
杂志排行

Acta Geochimica的其它文章
- Age and geochemistry of Early Ordovician A-type granites in the Northeastern Songnen Block,NE China
- Origin and genetic family of Huhehu oil in the Hailar Basin,northeast China
- Genesis of fahlore in the Tianbaoshan lead–zinc deposit,Sichuan Province,China:a scanning electron microscopy–energy dispersive spectroscopy study
- The morphological characteristics of gully systems and watersheds in Dry-Hot Valley,SW China
- State of rare earth elements in the rare earth deposits of Northwest Guizhou,China
- Does bicarbonate affect the nitrate utilization and photosynthesis of Orychophragmus violaceus?