Origin and genetic family of Huhehu oil in the Hailar Basin,northeast China
2018-10-25YaoPingWangFanZhangYanRongZouZhaoWenZhanYulanCai
Yao-Ping Wang·Fan Zhang·Yan-Rong Zou·Zhao-Wen Zhan·Yulan Cai
Abstract The Huhehu Sag is one of the most important oil and gas depressions in the Hailar Basin.However,the origin of Huhehu oil is still controversial.Previous studies on source rocks have mainly focused on the Nantun Formation(K1n);a few studies have investigated the Damoguaihe Formation(K1d).Based on the Rock–Eval pyrolysis parameters,172 drill cutting samples from the Huhehu Sag were analyzed to evaluate their geochemical characteristics.Based on the Rock–Eval data,the mudstones from the fi rst member of the Damoguaihe Formation(K1d1)and the second member of the Nantun Formation(K1n2)have moderate to high hydrocarbon generation potential,while mudstones from the fi rst member of the Nantun Formation(K1n1)have poor to good hydrocarbon generation potential.Additionally,both the K1n1and K1n2coal members have poor to fair hydrocarbon generation potential,but the K1n2 coal member has a better generative potential.Fifteen Huhehu oils were collected for molecular geochemical analyses to classify the oils into genetic families and to identify the source rock for each oil using chemometric methods.The Huhehu oils were classi fi ed into three groups with different maturity levels using hierarchical cluster analysis and principal component analysis.Group A oils(high maturity)are characterized by relatively moderate ratios of Pr/Ph,Pr/n-C17,and Ph/n-C18,as well as an abundance of C29steranes,mainly derived from the K1n2 and K1n1mudstone members.In comparison,group B oils(moderate maturity)have relatively low Pr/Ph ratios,moderate Pr/n-C17and Ph/n-C18ratios,and low concentrations of C29steranes.Group C oils(low maturity)show relatively high ratios of Pr/Ph,Pr/n-C17,and Ph/n-C18,as well as high concentrations of C29steranes.Furthermore,group B oils derived from the K1d1mudstone member and group C oils derived from the K1n2coal member were also identi fi ed by principal component analysis score plots.Correlation studies suggest a major contribution from the K1n mudstone Formation and the K1d1mudstone member to the oils of the Huhehu Sag.So,the Nantun Formation and relatively shallow strata of the Damoguaihe Formation(e.g.,the K1d1member)represent important targets for future oil-reservoir exploration in the Huhehu Sag.
Keywords Hailar Basin·Huhehu Sag·Biomarkers·Chemometrics ·Oil–oil and oil–source rock correlations
1 Introduction
The Hailar Basin is the second largest continental petroliferous basin in the Daqing oil area in China and forms within a Paleozoic fold basement(Wang et al.2009;Fig.1a).By the end of 2014,the Huhehu Sag,located in the southeastern part of the Hailar Basin(Fig.1b),had three low-yield oil wells(Chen 2014).In addition,the Huhehu Sag has received a great deal of attention due to its high quality of source rocks and the large potential of coalbed gases(Cui et al.2007;Yang et al.2008;Zhang 2014).

Fig.1 Maps of a the Hailar Basin,and b Huhehu Sag,and c well distribution in the study area(Chen et al.2011).I:southeast steep slope zone,II:south depression zone,III:central salient zone,IV:north depression zone,V:north slope zone,and VI:northwest gentle slope zone
Previous studies have con fi rmed that the study area has three sets of source rocks:the K1d1member(the fi rst member of the Damoguaihe Formation),the K1n2member(the second member of the Nantun Formation),and the K1n1member(the fi rst member of the Nantun Formation)(Li et al.2009;Lu et al.2010;Wu and Li 2012).These source rocks are all Cretaceous(Fig.2).Only limited oil–source rock correlation studies have been conducted in the Huhehu Sag,and the origin of Huhehu oil remains controversial(Lu et al.2010;Chen 2014).Lu et al.(2010)found that the Huhehu oils have a good correlation with the K1n2member(both mudstone and coal),while H Chen(2014)suggested that the Huhehu oils are mainly derived from the K1n2coal member and the K1n1mudstone member.Many publications have documented the Nantun Formation in detail in terms of molecular characteristics(Cao et al.2010;Lu et al.2010),organic matter enrichment,and kerogen type(Dong et al.2011;Wu and Li 2012),but little is known about the quality of the Damoguaihe Formation.Accordingly,the present study aimed to comprehensively evaluate the source rocks of the Huhehu Sag(including the K1d1,K1n2,and K1n1members)in terms of organic matter enrichment,kerogen type,depositional environment,and thermal maturity.In addition,chemometric methods were applied to determine detailed oil–oil and oil–source rock correlations.The methods used[mainly hierarchical cluster analysis(HCA)and principal component analysis(PCA)]have been widely employed in the fi eld of environmental science for analyzing water chemistry data(Amiri et al.2017;Ding et al.2017)and have proven reliable in analyzing oil–oil and oil–source rock correlations(Telnæs and Cooper 1991;Chakhmakhchev et al.1996;Zumberge et al.2005;Peters et al.2007,2008,2013,2016;Hao et al.2009,2010,2011;He et al.2012;Wang et al.2016,2018;Brito et al.2017).
2 Geological setting
The Huhehu Sag,a secondary tectonic unit of the Hailar Basin(Cao et al.2010;Chen et al.2011),extends northeast and has a large potential for hydrocarbon exploration(Wu and Li 2012).The Huhehu Sag is bounded by the Xilinbeier Salient,Bayan Mountain Uplift,Yimin Sag,and Tamtsag Basin of Mongolia,which lie to the east,west,south,and north,respectively(Li et al.2010).The Huhehu Sag can be further divided into:the southeast steep slope zone(I),south depression zone(II),central salient zone(III),north depression zone(IV),north slope zone(V),and northwest gentle slope zone(VI)(Chen et al.2011;Fig.1c).
The Huhehu Sag covers an area of 2500 km2at a maximum burial depth as high as 4600 m(Li et al.2010).The Huhehu Sag has undergone three stages in tectonic evolution(Fig.2):the extensional faulted-depression stage,the thermal subsidence fault-depression stage,and the late depression stage(Chen et al.2007).The Huhehu Sag is mainly fi lled with a Cretaceous sediment sequence,which from bottom to top is as follows:the Tongbomiao Formation(K1t),Nantun Formation(K1n),Damoguaihe Formation(K1d),Yimin Formation(K1y),and Qingyuangang Formation(K2q).A detailed lithology of these different formations is shown in Fig.2.The Qingyuangang Formation is composed of mudstone interbedded with sandy conglomerate.This sequence unconformably overlies the Yimin Formation.The Yimin Formation is characterized by sandstone and coal interbedded with mudstone in the lower part,and sandy conglomerate interbedded with sandstone and mudstone in the upper part(including the K1y3and K1y2members).The Yimin Formation conformably overliesthe Damoguaihe Formation.The Damoguaihe Formation is composed of coal,sandstone,and sandy conglomerate in the upper part,and dominated by mudstone in the lower part.The Damoguaihe Formation displays an unconformable contact with the underlying Nantun Formation.An argillite-dominated lithology comprising mudstone,sandstone,coal,and sandy conglomerate constitutes the Nantun Formation.The Nantun Formation conformably overlies the Tongbomiao Formation.The Tongbomiao Formation consists of sandstone,sandy conglomerate,and mudstone.
3 Samples and methods
3.1 Samples
We collected 155 mudstone and 17 coal samples for Rock–Eval pyrolysis.The samples were from the K1d1(45 samples),K1n2(62 samples),and K1n1(65 samples)members exposed in nine wells distributed throughout the sag.Additionally,15 oil samples,collected from the He-2,He-6,and He-9 wells,were analyzed using gas chromatography–mass spectrometry(GC–MS)to assess their molecular characteristics.
3.2 Rock–Eval pyrolysis and bitumen extraction of source rocks

Fig.2 Generalized stratigraphic column for the Huhehu Sag(Wu and Li 2012)
Before the Rock–Eval analysis and bitumen extraction,all drill cutting samples were cleaned using redistilled water.The samples were subsequently dried at 60°C and crushed into powder.The powder samples were analyzed(using IFP Rock–Eval 6)for total organic carbon(TOC),hydrogen index(HI),and hydrocarbon generation potential(S1+S2).The powder samples were initially heated to 300 °C for 3 min to yield the Rock–Eval S1peak that represents the amount of free hydrocarbons,and then heated to 650 °C at a rate of increase of 25 °C/min to produce the Rock–Eval S2peak that represents the hydrocarbons generated from kerogen cracking.The temperature(°C)at which the maximum hydrocarbon yield generated from kerogen cracking occurred is Tmax.Following pyrolysis,the pyrolyzed samples were heated from 300 to 850 °C at a rate of 20 °C/min in an oxidation furnace of the Rock–Eval 6 instrument to obtain the residual organic and inorganic carbon content.Bitumen was extracted from source rocks using a Soxhlet apparatus for 72 h with dichloromethane(DCM)mixed with methanol(93:7).All extracts and oils were separated into saturated,aromatic, and resin fractions using column chromatography.
3.3 Gas chromatography–mass spectrometry
GC–MS analyses were performed for the saturated fraction in the oils and source-rock extracts using a Thermo Fisher Trace GC Ultra gas chromatography coupled to a DSQ II mass spectrometer,equipped with a capillary column(60 m × 0.25 mm × 0.25 μm).The carriergas was helium.The GC oven was initially kept at 60°C for 1 min,then increased to 220 °C at a rate of 8 °C/min,then to 300 °C at a rate of 2 °C/min,and fi nally held at 300 °C for 25 min.
The mass spectrometer was operated at an ion source temperature of 230°C and ionization energy of 70 eV.The analysis was conducted using mode-combining selective ion monitoring(SIM)with full-scan detection with a scan range of 50–550 Da.
3.4 Chemometric analysis
In this study,chemometric methods including HCA and PCA were applied to oil–oil and oil–source rock correlations in the Huhehu Sag.HCA and PCA are two common techniques used for chemometric exploratory data(Peters et al.2005).Additionally,biomarker parameters,such as tricyclic terpanes,pentacyclic terpanes,and regular steranes(Peters et al.2007,2013),are commonly used in HCA and PCA.This study used nine source-related biomarker parameters for HCA and PCA,mainly including pentacyclic terpanes and regular steranes such as Pr/Ph,Ts/(Ts+Tm),H29/H30,C35/C34,Ga/C31R,S/H,%C27,%C28,and%C29,owing to the low abundance of tricyclic terpanes.These selected parameters are less likely to be affected by biodegradation,thermal maturity,and migration(Seifert and Moldowan 1978),similar to previous studies(Peters et al.2007,2013;Wang et al.2016,2018).Both HCA and PCA were completed using a commercial chemometrics program(Pirouette 4.5,Infometrix Inc.,Woodinville,WA,USA).HCA was performed by range scale preprocessing,Euclidean metric distance,and incremental linkage.The PCA simpli fi ed multiple variables into a few new independent variables.Before PCA,the data were also range scaled as for HCA.The selected biomarker parameters for PCA were the same as those for HCA.
4 Results and discussion
4.1 Hydrocarbon potential and kerogen type of source rocks
The TOC contents of the mudstone samples for the K1d1,K1n1,and K1n2members ranged from 1.46 to 4.27 wt%(45 samples,mean=2.22 wt% and standard deviation=0.66),0.16 to 9.80 wt%(61 samples,mean=1.71 wt%and standard deviation=1.79),and 0.65 to 9.08 wt%(49 samples,mean=2.82 wt% and standard deviation=1.74),respectively(Tables 1,2,3).The TOC contents of the K1n1and K1n2coal members are in the range of 12.11–40.57 wt% (4 samples,mean=28.72 wt% and standard deviation=11.70)and 23.00–73.30 wt% (13 samples, mean=49.99 wt% and standard deviation=16.37),respectively(Tables 1,2 and 3).The TOC contents of most K1d1and K1n2mudstone samples are>2 wt%,while those of the K1n1mudstone samples are generally between 1 and 2 wt%.The genetic potential(S1+S2)is mostly between 2 and 6 mg HC/g rock for the K1d1and K1n2mudstone members,but is generally<2 mg HC/g rock for the K1n1mudstone member.It is noteworthy that the Huhehu Sag is a coal-rich basin,and the source rocks of the K1d and K1n Formations belong to typical coal-bearing strata(Chen 2014;Zhang 2014).Some criteria have been established for evaluating hydrocarbon generation potential of organic matter in coal measures in China(Huang and Xiong 1996;Chen et al.1997;Wang 1998).The criteria from Huang and Xiong(1996)and Wang(1998)for the assessment of hydrocarbon-generating potential of coal-bearing strata are based mainly on two Rock–Eval parameters:TOC and hydrocarbon generative potential(S1+S2).However,Chen et al.(1997)found that a plot of HI versus hydrocarbon generative potential(S1+S2)is more effective for describing coal-bearing source rock.The criteria from Huang and Xiong(1996)and Wang(1998)are based only on a small number of samples and study areas,while the criteria from Chen et al.(1997)are based on over 23,000 rock samples from coal measure strata in northwestern China.Therefore,the standard established by Chen et al.(1997),which is probably more accurate for evaluating hydrocarbon-generating potential in coal-bearing strata and has been widely accepted(Jianget al.2014;Meng et al.2014;Song et al.2015;Zhang et al.2016),was used in this study.These data indicate that the mudstone samples from the K1d1and K1n2members are fair to good source rocks,while the mudstone samples from the K1n1member have poor source rock characteristics(Figs.3a–c;Chen et al.1997).
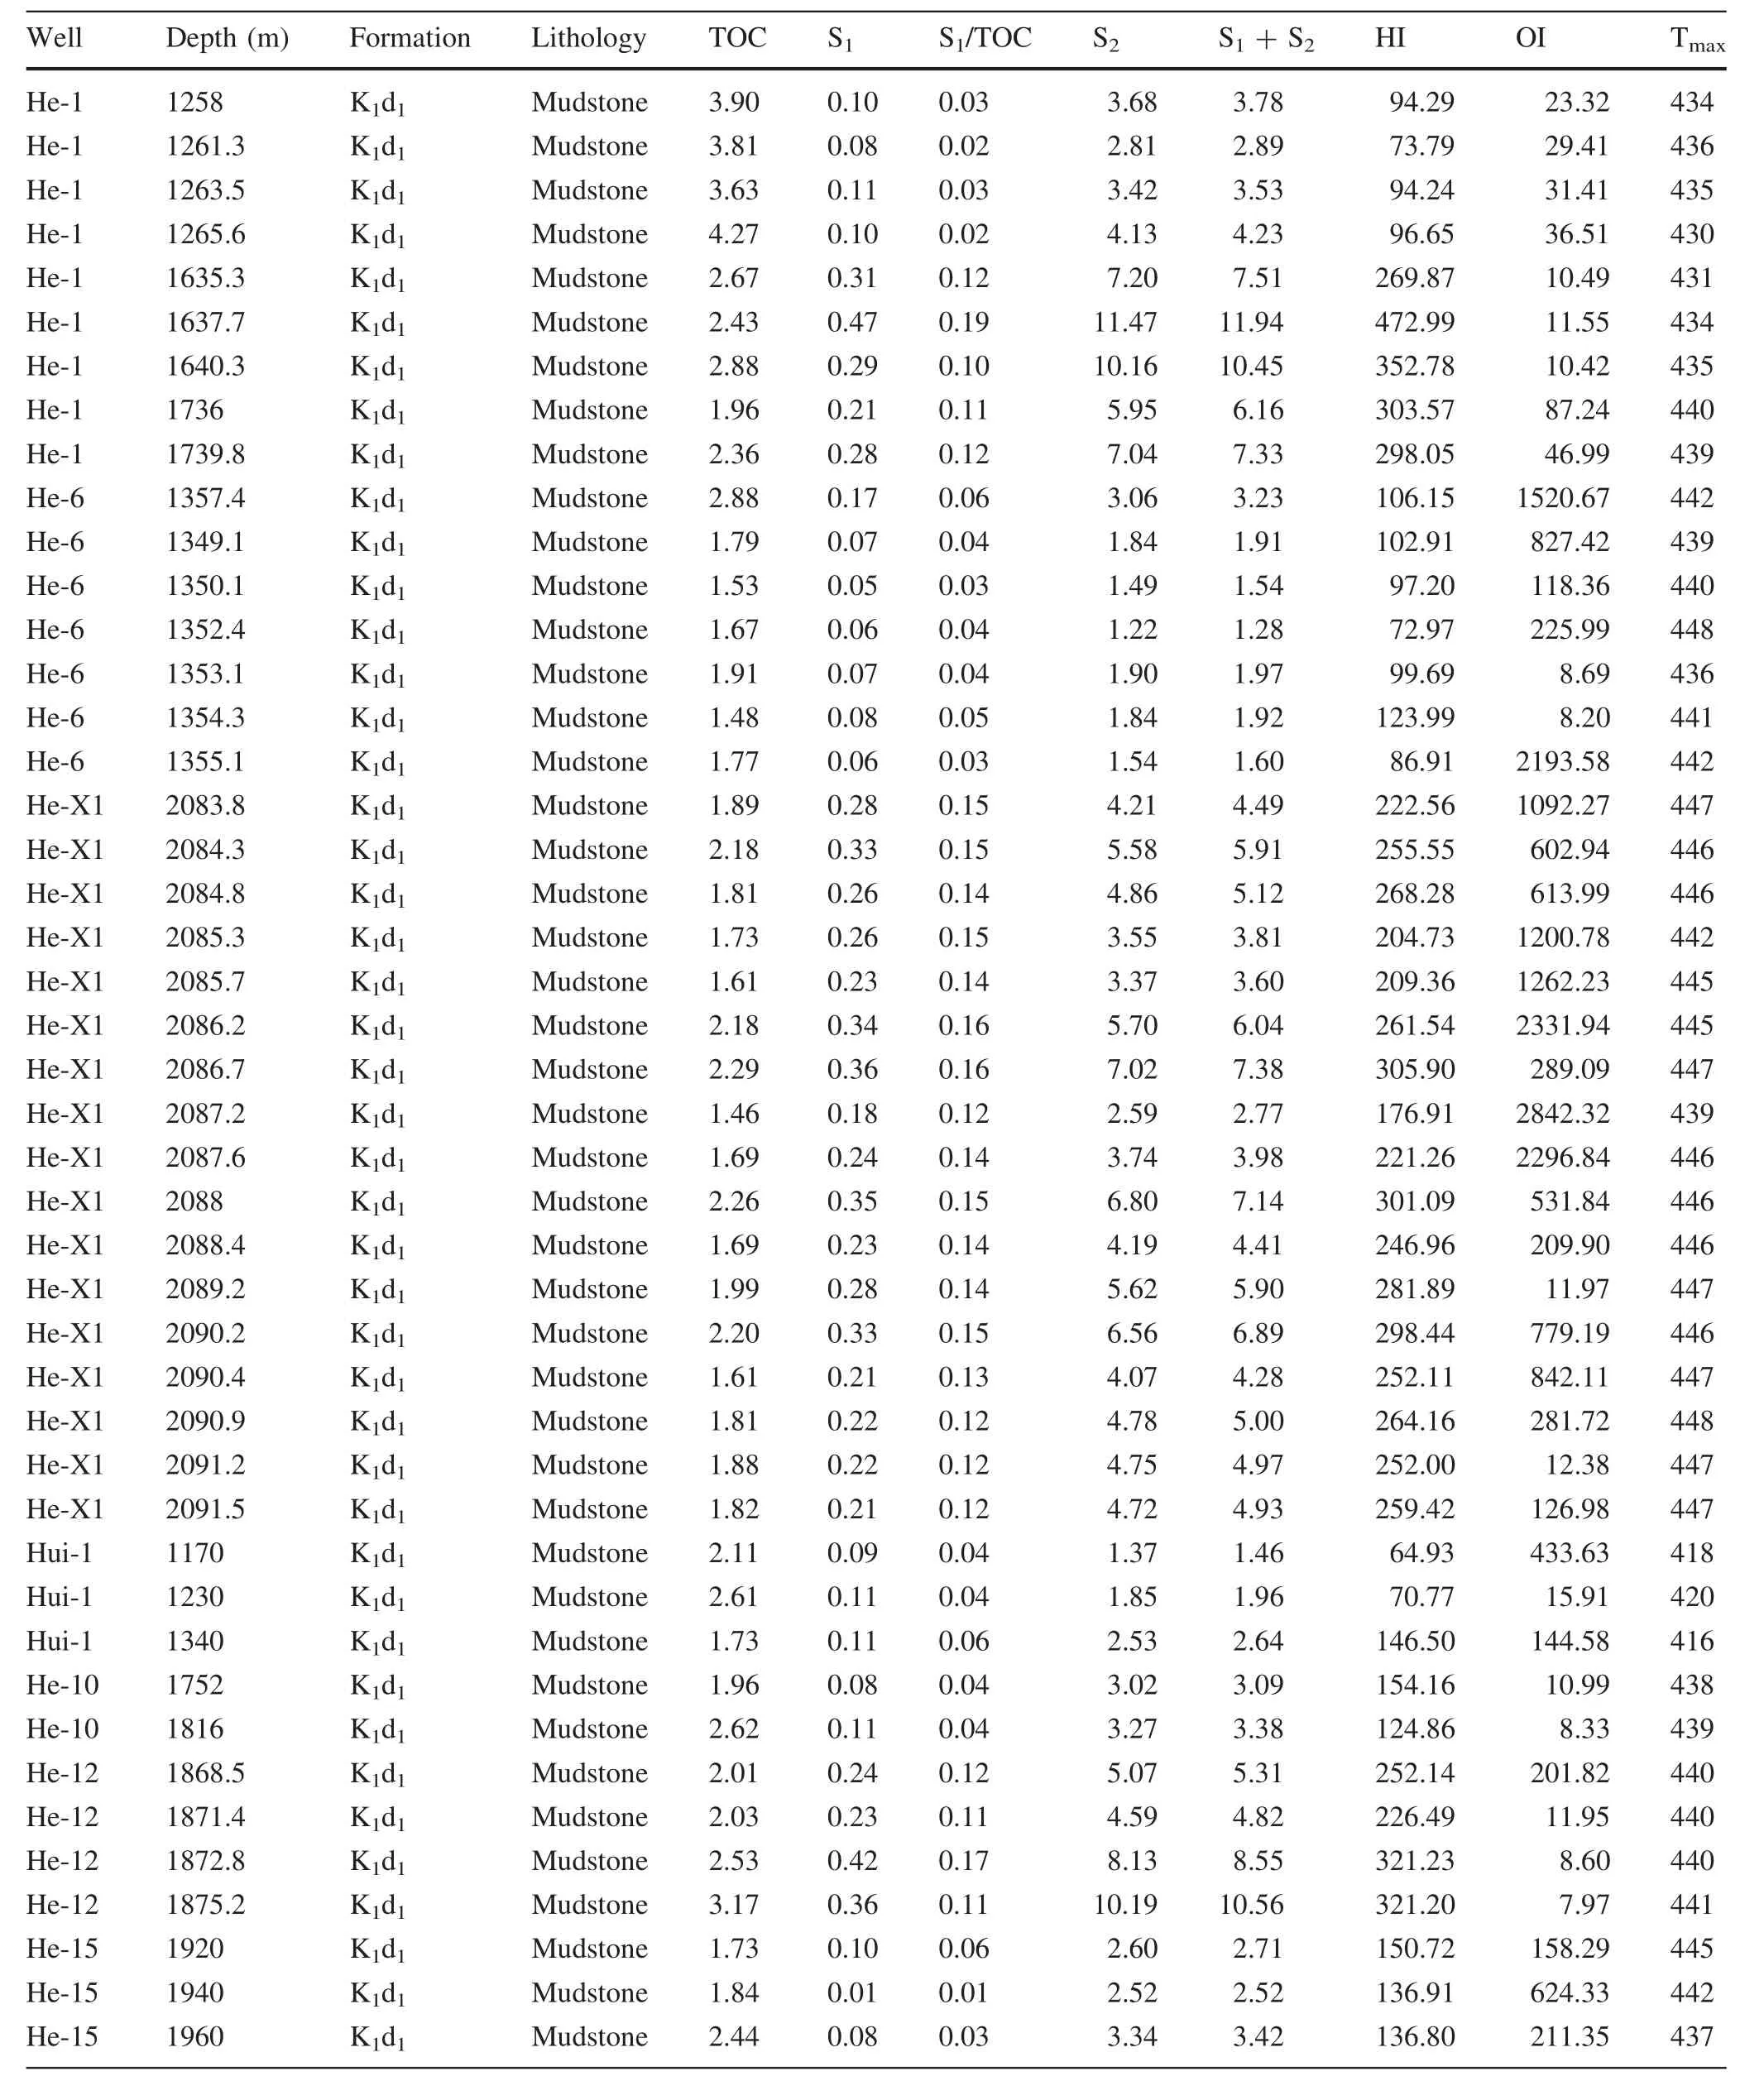
Table 1 Rock–Eval data for the K1d1member

Table 2 Rock–Eval data for the K1n2member

Table 2 continued
Based on the analysis of a large number of coal samples in China,Chen et al.(1997)found that a combination of HI and S1+S2can better estimate the hydrocarbon-generating potential of coal.The hydrocarbon generative potential of the coal samples from the K1n1and K1n2members ranged from 12.90 to 81.08 mg HC/g TOC(mean=43.45 mg HC/g TOC)and from 57.33 to 271.38 mg HC/g TOC(mean=138.76 mg HC/g TOC),respectively;HI values are in the range of 50.83 to 186.91 mg HC/g TOC(mean=136.61 mg HC/g TOC)and 161.36 to 375.64 mg HC/g TOC(mean=256.62 mg HC/g TOC),respectively(Tables 2 and 3).These data indicate that the K1n1coal members have poor hydrocarbon potential,and the K1n2coal member has poor to good hydrocarbon potential(Fig.3d).The cross plot of HI versus Tmax(Fig.4)indicates that the Huhehu source rocks are primarily type II2kerogen,with some samples falling in the zone of type II1and III kerogen.The Rock–Eval parameters S1and TOC are useful in distinguishing between the indigenous and nonindigenous organic matter present in the studied source rock samples(Hunt 1996).A migration index (S1/TOC)<1.5 indicates that samples have not been affected by migrated hydrocarbon(e.g.,Mashhadi et al.2015).All the studied source rocks exhibit S1/TOC ratios<1.5,indicating that the studied samples were not contaminated by migrated hydrocarbon.
4.2 Molecular characteristics of source rocks
The gas chromatogram shows front-end biased distribution and enrichment of low molecular compounds,typically atn-C17ton-C23(Figs.5 and 6).No apparent odd-over-even predominance was observed other than in coal.A low Pr/Ph ratio(<1)indicates an anoxic depositional environment,whereas a higher Pr/Ph ratio(>1)indicates oxic depositional conditions(Didyk et al.1978).Additionally,extremely high values of the Pr/Ph ratio(>3)are believed to be associated with terrigenous organic matter inputs under oxic depositional settings(Peters et al.2005).The Pr/Ph ratios for the source rock from the K1d1,K1n1,and K1n2members are in the range of 1.25 to 2.39(mean=1.77,16 samples),2.24 to 3.24(mean=2.74,2 samples),and 1.43 to 4.07(mean=2.52,13 samples)(Table 4),respectively,suggesting oxic depositional conditions for these source rock members.Furthermore,the mean values of Pr/Ph increase as follows:K1d1<K1n2<K1n1members,probably indicating relatively oxic depositional conditions.
Sterane mass chromatograms(m/z 217)of the representative source rocks are shown in Figs.5 and 6.The relative abundances of C27,C28,and C29steranes for the source rocks are in the range of 12.27%–41.51%,8.16%–24.56%,and41.98%–74.11%,respectively (Table 4).Previous work observed that C27sterols(steranes)dominate in marine organic matter,while C29sterols(steranes)dominate in terrigenous organic matter(Huang and Meinschein 1979).Our data suggest a dominant contribution of terrigenous organic matter input(Fig.7).In addition,sterane/hopane ratios for the source rocks range from 0.07to 0.54,indicative of terrigenous or microbially reworked organic matter(Tissot and Welte 1984).

Table 3 Rock-Eval data for the K1n1member

Table 3 continued
Terpane mass chromatograms(m/z 191)of the representative source rocks are characterized by a high abundance of pentacyclic terpanes relative to tricyclic terpanes(Figs.5 and 6),consistent with coal-bearing source rocks in northwestern China(J Chen et al.1998).The C35/C34ratios for the source rocks range from 0.19 to 0.39,indicating oxic depositional conditions(Peters and Moldowan 1991).The gammacerane/C31R ratios in the source rocks are in the range of 0.01 to 0.23,indicating a lack of strati fi cation because a high gammacerane/C31R ratio is usually expected both with strati fi cation and with reducing depositional conditions(Fu et al.1986;Sinninghe Damstéet al.1995).
4.3 Maturity of source rocks
To evaluate the thermal maturity of the source rocks,several maturity indicators,including Rock–Eval pyrolysis and biomarker parameters were used.The Rock–Eval pyrolysis parameter,Tmax,preferred by type II/III organic matter(Tissot et al.1987),is a reliable index for evaluating thermal maturity of source rocks(Tissot and Welte 1984).Based on Tmaxvalues in the source rock members(Peters 1986),the K1d1mudstone member is at immature to peak stage,ranging from 416 to 448°C,and the K1n2mudstone member is at early to late stage,ranging from 432 to 479°C.It is noteworthy that the K1n1mudstone member has the highest maturity level,while coals from the K1n1and K1n2members are mostly at an immature or early mature stage(Peters 1986).In general,the thermal maturity of the source rock members increase as follows:K1d1-<K1n2<K1n1members(Tables 1,2,3).
With increasing maturity,three biomarker ratios—C32homohopanes 22S/(22S+22R), C29steranes 20S/(20R+20S),and C29ββ/(αα + ββ)—increase from 0 to approximately 0.6,0–0.5,and 0–0.7,respectively(Seifert and Moldowan 1980,1986).The values of C32homohopane 22S/(22S+22R)ratios for the Huhehu source rocks are in the range of 0.57–0.61(Table 4),indicating that most of the source rocks have reached or even surpassed the oil window.The ratios of C29steranes 20S/(20R+20S)and C29ββ/(αα + ββ)in the Huhehu source rocks are in the range of 0.20–0.55 and 0.30–0.53(K1d1member),0.29–0.62 and 0.41–0.50(K1n2member),and 0.40 to 0.55 and 0.44 to 0.49(K1n1member)(Table 4).These data suggest that most of the studied samples are mature,which is consistent with the Tmaxvalues.
4.4 Oil-oil correlation
When the similarity line was placed at a similarity coef ficient value of slightly greater than 0.6,the Huhehu oils were divided into three groups:A,B,and C(Fig.8).This is consistent with PCA results(Fig.9).
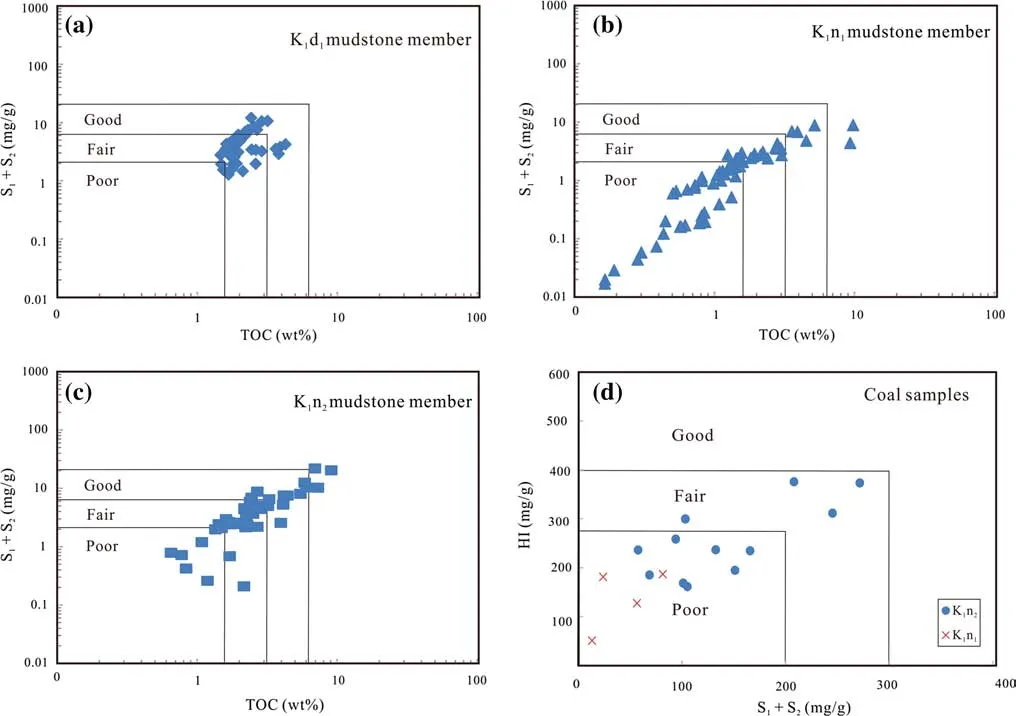
Fig.3 Plots of the Rock–Eval parameters total organic carbon(TOC)versus S1+S2for source rocks from the K1d1,K1n2,and K1n1mudstone members(a–c),and S1+S2vesrus hydrogen index(HI)for source rocks from the K1n2and K1n1coal members(d)
4.4.1 Bulk physical properties of crude oils
The physical characteristics of the Huhehu oils have been reported by Lu et al.(2010),and include low density(0.80 g/cm3), viscosity (1.93 mPa s), freezing point(19°C),and wax content.These physical properties suggest that the Huhehu oils belong to light crude oil with a low wax content and freezing point(Lu et al.2010).
4.4.2 Molecular characteristics of crude oil
Gas chromatograms of the representative Huhehu oils are shown in Fig.10,and the related parameters are listed in Table 4.Then-paraf fi n distribution of the oil has a wide distribution(n-C14–n-C35)with a maximum at aboutn-C19ton-C21.The high abundance of low-weight molecularnalkanes in the oil suggests a lack of signi fi cant biodegradation.Low values of Pr/n-C17and Ph/n-C18ratios also support that the oils are non-biodegraded(Table 4).The plot of Pr/n-C17and Ph/n-C18indicates that the oils can be divided into three families(Fig.11).The Pr/Ph ratios for the oils are in the range of 1.57–4.53,with an average of 2.94,probably indicating a dominant contribution of terrigenous organic matter input deposited under oxic depositional conditions.The group A oils have moderate values of Pr/Ph,ranging from 2.04 to 3.13.The group B oils display relatively low values of Pr/Ph,ranging from 1.57 to 2.02.The group C oils are characterized by high values of Pr/Ph,ranging from 3.24 to 4.53.These data may indicate that group C oils were deposited under more oxic depositional conditions in comparison with group A and B oils.
Figure 12 shows mass chromatograms of the steranes(m/z 217)of saturated hydrocarbon fractions from the representative Huhehu oils.Although the oils from different categories varied in the distribution of regular steranes(C27–C29),all the oils show high concentrations of C29steranes,which is indicative of a dominant contribution of terrigenous organic matter(Fig.13).This is consistent with low hopane/sterane ratios,which often infer terrigenous or microbially reworked organic matter input(Tissot and Welte 1984).In comparison with the oils from the two other groups,the group C oils have relatively high concentrations of C29steranes,probably indicating more terrigenous organic matter input.

Fig.4 Plot of hydrogen index(HI)versus Tmaxfor the Huhehu source rock showing hydrocarbon generative types
Figure 12 displays m/z 191 mass chromatograms of saturated hydrocarbon fractions from the representative Huhehu oils,which clearly display a dominant abundance of pentacyclic terpanes relative to tricyclic terpanes.The low values of C35/C34ratios for the studied crude oils,ranging from 0.05 to 0.45(Table 4),indicate oxic depositional conditions(Peters and Moldowan 1991).The gammacerane/C31R ratios of the oils indicate a lack of strati fi cation during source rock deposition.
4.4.3 Thermal maturity of crude oil
The C32homohopane 22S/(22S+22R)ratios for the oils are in the range of 0.50–0.60,indicating that the oils have reached equilibrium(Seifert and Moldowan 1980).Group A oils have high ratios of C29steranes 20S/(20R+20S)and C29ββ/(αα + ββ)(ranging from 0.44 to 0.47 and from 0.45 to 0.53,respectively),indicating that they are mature(Seifert and Moldowan 1986).In comparison,the group C oils have relatively low values of C29steranes 20S/(20R+20S)and C29ββ/(αα + ββ)(ranging from 0.32 to 0.40 and from 0.32 to 0.42,respectively);and the group B oils have moderate values of C29steranes 20S/(20R+20S)and C29ββ/(αα + ββ)(0.35–0.43 and 0.43–0.49,respectively).Thermal maturity of the crude oils in all the groups decreases overall in the following order:A>B>C(Fig.14).
4.5 Oil–source rock correlation
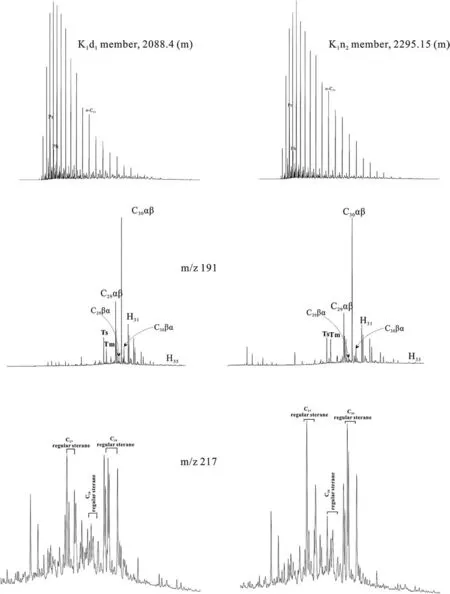
Fig.5 Representative TIC,hopane(m/z 191),and sterane(m/z 217)mass chromatograms for the source rocks from the K1d1and K1n2members
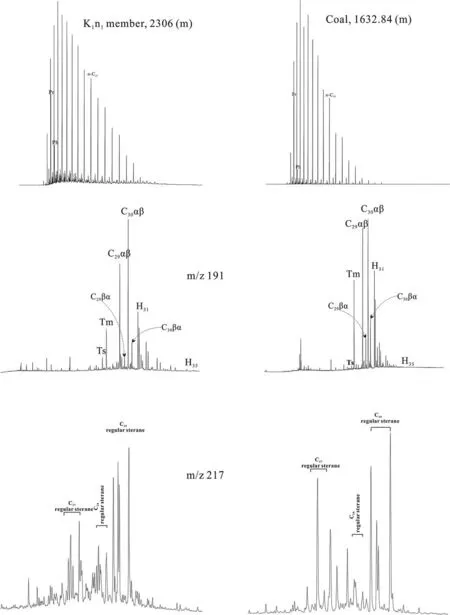
Fig.6 Representative TIC,hopane(m/z 191),and sterane(m/z 217)mass chromatograms for the source rocks from the K1n1member and coal samples

Fig.7 Ternary diagram showing relative abundance of the C27,C28,and C29regular steranes in the saturated fraction of the Huhehu source rock extract
The three-dimensional view of PCA was used to identify the relationship between the oils and the candidate source rocks using range scale preprocessing,Euclidean metric distance,and incremental linkage in Pirouette®(Infometrix,Inc.).The fi rst three components of the PCA(PC1,PC2,and PC3)account for 90%of the total variance in the original dataset.As shown in Fig.15a,three genetic oil families were determined.Group A oils show strong af fi nity to the K1n2and K1n1mudstones members.The K1d1mudstone member is related to the group B oils,and the group C oils is linked to the K1n2coal member(Fig.15a).Figure 15b shows the relative contribution from each of the 11 biomarker ratios to PC1,PC2,and PC3.The biomarker ratios of Ts/(Ts+Tm)and C35/C34have large positive loadings on PC1.PC1 could be interpreted as an indicator of more reducing depositional conditions since the Ts/(Ts+Tm)ratio is a source-related parameter at lower maturity(Wang et al.2018),and the C35/C34ratio generally re fl ects anoxic depositional conditions(Peters and Moldowan 1991).The loadings on PC2 are dominated by a positive correlation with C29hopane/C30hopane and C3122R/C30hopane ratios and a negative correlation with%C27,which is indicative of more marine organic matter input(Huang and Meinschein 1979;Peters et al.2005).The loadings on PC3 mainly show a positive correlation with Pr/Ph and%C29and a negative correlation with%C27.Thus,PC3 indicates more oxic depositional conditions(Didyk et al.1978)and terrigenous organic matter input(W Huang and Meinschein 1979).

Fig.9 Separation of the Huhehu oils into three different genetic oil families based on the principal component analysis(PCA)of nine source-and age-related biomarker ratios
Geological evidence also provides support for geochemical oil-source correlations in the Huhehu Sag.For example,the discovered oils are mainly distributed in wells He-2 and He-6(Table 4).The burial depths of the coal seams in He-2 and He-6 are in the range of 570 to 1600 m and 570 to 1550 m(Qu 2005),respectively.Such evidence indicates that group A oils are mainly derived from the K1n mudstone Formation rather than from the coal formation because oils from group A have greater embedded depths(>1600 m).In contrast,the depth of the group C oils is within the coal seam distribution.Accordingly,the group C oils have good correlation with the coal extracts from the K1n2member.

Fig.8 Separation of the Huhehu oils into three different genetic oil families based on the hierarchical cluster analysis of nine source-and age-related biomarker ratios

Fig.10 Whole oil gas chromatograms of the Huhehu oils showing the relative distribution of n-paraf fi ns

Fig.11 Plot of Pr/n-C18versus Ph/n-C17for the Huhehu oils showing genetic oil categories and depositional conditions
The oil–source rock correlation results are consistent with the thermal maturity of the Huhehu oils and source rocks(Fig.11).For example,the group A oils have relatively high maturity and show a strong af fi nity to the relatively high maturity source rocks of the K1n2and K1n1mudstone members.Similar observations could be made for the group B and group C oils.

Fig.12 Mass chromatograms(m/z 191 and 217)for the representative Huhehu oils

Fig.13 Ternary diagram showing the relative abundance of the C27,C28,and C29regular steranes in the saturated fraction of the Huhehu oils

Fig.14 Plots of C29steranes ββ/(αα + ββ)versus C29steranes 20S/(20R+20S)(a)and C32homohopane 22S/(22S+22R)versus C29 steranes 20S/(20R+20S)(b)showing thermal maturity level of the Huhehu oils
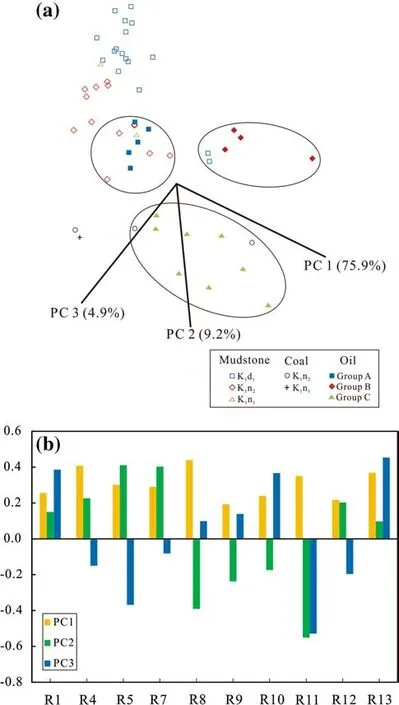
Fig.15 The three Huhehu oil families(scores)and biomarker variables(loadings)employed in the principal component analysis.R1=pristane/phytane;R4=Ts/(Ts+Tm);R5=C29hopane/C30 hopane;R7=C3122R/C30hopane;R8=C35/C34homohopanes;R9=gammacerane/C31 22R hopane; R10=steranes/hopanes;R11=%C27 (e.g., %C27=%C27/(%C27–%C29); R12=%C28;R13=%C29
As discussed earlier,the K1d1and K1n2mudstone samples have moderate to high hydrocarbon generative potential,while the K1n1mudstone member and K1n2and K1n1coal samples are relatively less promising and show poor-to-good and poor-to-fair hydrocarbon generation potential,respectively.The K1n2coal member has a certain hydrocarbon-generating potential,butthe K1n1coal member is less promising,which is consistent with a previous study(Liu 2010).Therefore,the hydrocarbon generation potential of the source rocks supports the results of the oil–oil and oil–source rock correlations in the present study.Future assessment of petroleum potential or exploration of the Huhehu Sag can be assisted by considering the proposed genetic relationship between the crude oils and source rocks.The results of oil–oil and oil–source rock correlation in the Huhehu Sag suggest that the K1n Formation and K1d1member are promising for future exploration.
5 Conclusions
Based on Rock–Eval pyrolysis data,mudstones from the K1d1and K1n2members have moderate to high hydrocarbon generating potential,while the K1n1mudstone member and coals from the K1n2and K1n1members in this region have relatively less potential.
Based on chemometric analysis and biomarker characteristics,we divided the Huhehu oils into three groups.Group A oils have relatively high maturity and are characterized by moderate values of Pr/Ph,low values of Pr/n-C17and Ph/n-C18,and moderate concentrations of C29sterane,while group B oils have moderate maturity,low values of Pr/Ph,moderate values of Pr/n-C17and Ph/n-C18,and low concentrations of C29sterane.Group C oils have low maturity;relatively high values of Pr/Ph,Pr/n-C17,and Ph/n-C18;and low concentrations of C29sterane.The oil–source rock correlation based on PCA analysis suggests group A oils are derived from the K1n2and K1n1mudstone members,while group B oils can be ascribed to the K1d1mudstone member,and group C oils to the K1n2coal member.These results suggest that not only the K1n Formation,but also the K1d1member,are good prospects for hydrocarbon exploration.
AcknowledgementsThis study was funded by the Natural Science Funding Council of China(Grant Nos.41273059),GIGCAS 135 project(Grant No.Y234021001)and Earmarked Fund of the State Key Laboratory of Organic Geochemistry(Grant No.sklog2016-A01).The authors are deeply indebted to two anonymous reviewers who provided constructive reviews in our original manuscript.We also wish to acknowledge managing editor Wang Binbin for the timely handling with the manuscript.
Compliance with ethical standards
Con fl ict of interestThe authors declare that they have no con fl ict of interest.
杂志排行

Acta Geochimica的其它文章
- The effects of clay minerals and organic matter on nanoscale pores in Lower Paleozoic shale gas reservoirs,Guizhou,China
- Age and geochemistry of Early Ordovician A-type granites in the Northeastern Songnen Block,NE China
- Genesis of fahlore in the Tianbaoshan lead–zinc deposit,Sichuan Province,China:a scanning electron microscopy–energy dispersive spectroscopy study
- The morphological characteristics of gully systems and watersheds in Dry-Hot Valley,SW China
- State of rare earth elements in the rare earth deposits of Northwest Guizhou,China
- Does bicarbonate affect the nitrate utilization and photosynthesis of Orychophragmus violaceus?