The morphological characteristics of gully systems and watersheds in Dry-Hot Valley,SW China
2018-10-25ZhenXuFachaoQinBinZhangQingchunDengHuiLiuJieJinLiangtaoShi
Zhen Xu·Fachao Qin·Bin Zhang·Qingchun Deng·Hui Liu·Jie Jin·Liangtao Shi
Abstract Gully systems and watersheds are geomorphic units with clear boundaries that are relatively independent of basin landscapes and play an important role in natural geography.In order to explore the morphological characteristics of gully systems and watersheds in the Dry-Hot Valley[South West(SW)China],gullies are interpreted from online Google images with high resolution and watersheds are extracted from digital elevation model at a scale of 1:50,000.The results show that:(1)There are 17,382 gullies(with a total area of 1141.66 km2)and 42 watersheds in the study area.(2)The average gully density of the study area(D)is 4.29 km/km2,gully frequency(F)is 14.39 gullies/km2,the branching ratio(B)is 5.13,the length ratio(L)is 3.12,and the coef fi cient of the main and tributary gullies(M)is 0.06.The degree of gully erosion is strong to extremely strong,the main development intensity of gully erosion ranges from intense to moderate,and the type of gully system is tributary.(3)The watershed areas(A)are between 0.39 and 96.43 km2,the relief ratio(R)is from 0.10 to 0.19,the circularity ratio(C)is from 0.30 to 0.83,the texture ratio(T)is from 0.82 to 39.35,and the dominant geomorphological texture type is fi ne.(4)There is a quantitative relationship between F and D:F=0.624D2(R=0.84)and T is closely related to D,F,M(R2>0.7).A,R and C are related to M(R2>0.5).The development of gully systems is the result of coupling effects between multiple factors.In this area,the degree of erosion and the condition of the main and tributary gullies can be controlled by the degree of topographic breakage in the watershed,which provides some theoretical basis for the evaluation of gully erosion by the latter.In addition,the scale,relief,and shape have a signi fi cant impact on the locations of the main and tributary gullies.For tributary gullies,attention should be paid to the interception and control of runoff and sediment in the small con fl uence branches in order to prevent gully expansion and head advance.These features can inform the development of targeted measures for the control of soil erosion.
Keywords Morphological characteristics·Quantitative relationships·Gully system ·Watershed·Dry-Hot Valley
1 Introduction
A gully is a common landform in mountainous and hilly areas and is formed by surface erosion as a result of temporary water concentration(Vanacker et al.2003).Among the various factors affecting gully systems,the watershed morphology is an important non-zonal factor that affects the rate,scale,and quantity of gully erosion(Zhang 2014).In turn,watershed morphology in fl uences the process of soil erosion(Goudge et al.2016;Qu 2017).
In its early stages,watershed morphology in fl uences the development of river networks.According to analyses of 461 rivers in the world,there is a clear linear relationship between the watershed area(the earliest employed morphological parameter)and the mainstream length,especially for watersheds with an area of fewer than 104km2(Hack 1957;Langbein 1947;Leopold et al.1995).With the development of quantitative geomorphological methods,further studies have divided river network parameters into linear scale measurement parameters(including the length of the stream channels and drainage density)as well as dimensionless ones(including stream order numbers,stream length and bifurcation ratios etc.).Analysis reveals that the relationship between the watershed area and various parameters has an in fl uence on the linear scale measurementparametersbutnoton the dimensionless parameters.Rivers originating from the undulating terrain and high-altitude areas of the alpine valley have led many scholars to extend their research to the topographic relief factors affecting river development.As an important eigenvalue of the watershed topographic relief,the concept of the relief ratio was fi rst adopted in 1957.Topographic relief was found to affect the development of the river network.(Strahler 1957).The mean value of the drainage area at each level forms a geometric series,based on the Horton River system law.Schumm(1971)suggested that the size of the river network and watershed is determined by the feeding area and that the topographic ratio is another major factor controlling the topography of the watershed.When compared with other parameters,the concept of watershed shape appeared relatively recently and the shape of the debris fl ow gully(which was applied in a narrow range),was mainly analyzed through the shape of the watershed(Hou 2006).In summary,the concept of watershed morphology has signi fi cantly promoted the study of river networks and indicates that there is a strong relationship between watershed morphology and river network development.
There is an abundance of information on the relationship between watershed morphology and river networks but the relationship between gully systems and watersheds emerged recently in the 1980s.In the beginning,gully density was used as a typical indicator of the gully system and an equation relating to gully density,watershed area and height difference was formulated(Chen 1986).Since indicators such as watershed area and slope were primarily re fl ected in the study of channel morphology,it was found that the watershed area is positively correlated with the gully length(Li et al.2017).As one of the important topographic factors affecting the development of the gully system,watershed slope has a strong nonlinear correlation with the gully density.In the case of Meihekou City,Jilin Province,China,the gully density was maximized when the slope was greater than 8°(Xu et al.2014).In recent years,with the relationship between the watershed area and the gully system development is becoming widely recognized.Dissmeyer and Foster(1981)found that the watershed area develops towards the establishment of the relevant erosion assessment model,and the effect of the slope on gully system development was re fl ected in the USLE model at an early stage.At present,the relationship between the watershed shape and the gully system is still at an exploratory stage.Since the commonly-used indicators are the circularity ratio(Chen and Jiang 1986)and the ratio of length to width(Hou 2006)etc.,the type of the watershed shape is divided according to each indicator.The degree of gully system development is then analyzed based on the different types.In general,watershed morphology plays an important role in the development of the gully system and cannot be ignored under the background of large-scale soil erosion(Abdulfatai et al.2014;Luffman et al.2015).
The literature presenting the morphological relationship between gully systems and watersheds is quite old;however,the relevant research mainly focuses on watershed morphology.The systematic analysis of the in fl uence of watershed shape on the development of the channel system(based on the watershed perspective)is insuf fi cient and the impact of its development deserves further exploration.The objective of this study is to reveal the morphological characteristics and relationships between gully systems and watersheds in the Yuanmou Dry-Hot Valley.The results will be helpful in understanding the developmental mechanisms of gullies and watersheds.
2 Study area
The Yuanmou Dry-Hot Valley is located in the Chuxiong Yi Autonomous Prefecture in the Yunnan Province of SW China in the northern part of the Central Yunnan Plateau,between geographical coordinates 101°35′E,26°06′N and 102°06′E,25°23′N(Deng et al.2015)(Fig.1).The valley belongs to the central section of the Kang-Dian Anticline,which is a tectonic fault of Cenozoic age with subsidence and deposition in its center.,the middle part of the valley is a basin between 980 and 1400 m above sea level,surrounded by hills and low mountains(Fig.1).The geological strata in the area is mainly comprised of sandstone,mudstone,granite,schist,gneiss,and phyllite(Zhang et al.2009).Soils in the area are mostly xerothermic soils and vertisols.The valley has low vegetation coverage and is dominated by trees and shrubs,such asHeteropogoncontortus,Agave sisalana,Xanthium sibiricum,Acacia farnesiana,Dodonaea viscoseandBombax ceiba(Dong et al.2013).The sparse vegetation distribution provides the initial conditions for the generation of gullies(Mu et al.2015).Frequent human activities,including agricultural production and building construction,have resulted in very active gully development and the gullies throughout the area crisscross each other and are densely distributed(Lin et al.2017).
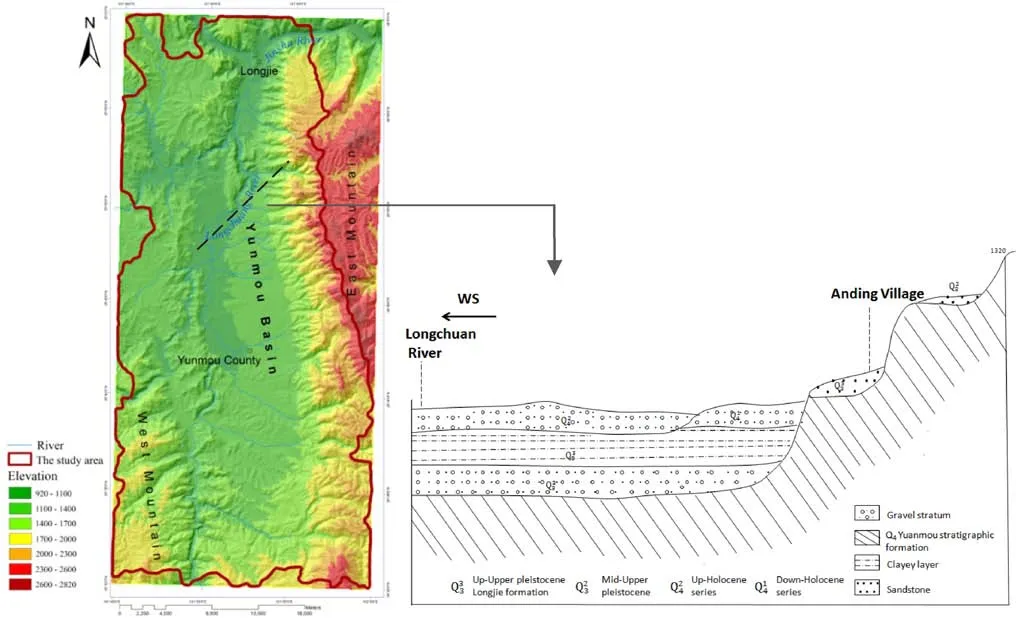
Fig.1 DEM of the study area and the geological section from Anding Village to Longchuan River.From Quaternary Geology and Ancient Humanity(Qian 1991)
3 Data and methods
3.1 Data sources
The data were mainly obtained from ArcGIS 10.2 online Google images,with a resolution of about 0.5×0.5 m and the 1:50,000 scale DEM.
3.2 Watershed division
The DEM was loaded into the SWAT toolbox in ArcGIS(version 10.2)using the WGS_1984_World_Mercator coordinate system.Four drainage area thresholds were tested:2000,1500,1000,and 500 hm2.Comparing the statistical information for different drainage area thresholds(Table 1),the number of watersheds,drainage density,and the time required to extract the watershed decreased as the area threshold increased.However,when the area threshold was greater than or equal to 1500 hm2,the statistical information tended to stabilize,so 1500 hm2appears to be the best drainage area threshold.Therefore,the study area can be divided into 42 watersheds.
3.3 Gully interpretation
In order to identify gullies,rivers,and tributaries in the study site,Google Earth images of the gully systems and rivers were vectorized.The gullies located in the northwest of the study area are shown in Fig.2:yellow lines represent the gully systems and blue lines represent the Longchuan River and its tributaries.The Length fi eld was then added to the attribute table(Fig.3)and the gullies were graded according to the dividing principle of Strahler channelordering(Horton 1945;Strahler 1954).
3.4 Morphological parameters
Table 2 shows the parameters that describe the morphological characteristics of the watersheds and gully systems.The morphology of a watershed can be characterized by the parameters of scale,topographic relief,shape,and geomorphological texture.The scale parameter indicates the area of the watershed(A),the topographic relief parameter is indicated by the relief ratio(R),the shape parameter is indicated by the circularity ratio(C),and the geomorphological texture parameter is indicated by the texture ratio(T).The morphological characteristics of gully systems include the developing situation,the degree of development,and the situation of the main and tributary gullies.The developing situation is comprised of the branching ratio(B)and length ratio(L),the degree of development includes the gully density(D)and gully frequency(F),and the situation of the main and tributary gullies refers to the coef fi cient of main and tributary gullies(M).

Table 1 The statistical table of different drainage area threshold

Fig.2 The gully system
3.4.1 Watershed morphology parameters
(1) The area of the watershed
The area of the watershed(A)determines the catchment capacity of the watershed and the hydrodynamic conditions required for gully generation(Apitz and White 2003),which can be acquired from ArcGIS.

Fig.3 The gully systems and watersheds
(2) Texture ratio
Smith(1950)proposed the concept of texture ratio(T),which is the ratio of the number of contour bends to the perimeter of the watershed.Based on substantial data analysis,geomorphological texture can be classi fi ed into a coarse texture(T<4.0),medium texture(4.0≤T<10.0)and fi ne texture(T≥10.0)(Zhang et al.2007).Tcan re fl ect the roughness/ fi neness of geomorphological texture within the watershed and embodies the lithology,soil property,surface permeability and developmental stage of topography to some extent.In areas without vegetation protection or with soft strata,a fi ne-textured topography is generated;in areas with strong erosion resistance,roughlytextured topography is generally formed;and in areas with vegetation coverage and identical lithology,the topography is fi ner for humid climate areas than for dry areas.The equation for T is shown below:

whereNis the number of gullies andPis the perimeter of the watershed.
(3) Circularity ratio
The circularity ratio(C)represents the near-roundness of the watershed shape.The closer the value ofCis to 1,the closer the watershed shape is to a circle.Since the shape of a watershed is produced by nature and will not comprise simple shapes and straight lines,Cis always less than 1(Gregory and Walling 1973;Miller and Kahn 1962).The formula for C is as follows:

whereAbis the area of a circle equal to the watershed perimeter andAis the area of the watershed.
(4) Relief ratio
Schumm(1954)created the concept of the relief ratio(R)which indicates the average total slope of the watershed topography,a signi fi cant index of topography.The equation for R is shown below:

whereHis relative height,which is the differential value
between highest elevation and lowest elevation of the watershed,andLwis the length of the watershed.
3.4.2 Gully system morphology parameters
(1) Gully density
Gully density(D)re fl ects the topographic undulation and soil erodability of watersheds to some extent(Gawrysiak and Harasimiuk 2012).Depending on the degree of occurrence and development intensity of gully erosion,gullies are graded as follows:ifDis between 1 and 2 km/km2,the erodability is mild and the erosion intensity is intense;ifDis between 2 and 3 km/km2,the erodability is moderate and the erosion intensity is extremely intense;ifDis between 3 and 5 km/km2,the erodability is strong and the erosion intensity is intense;ifDis between 5 and 7 km/km2,the erodability is extremely strong and the erosion intensity is moderate;and ifDis>7 km/km2,the erodability is violent and the erosion intensity is mild(Zhang 2014).Generally,the main variation range ofDis between 3 and 5 km/km2,as shown in Fig.5.The equation for D is shown below,

Table 2 Parameters to describe the morphological characteristics of watersheds and gully systems

whereLtis the total length of gullies andAis the area of the watershed.
(2) Gully frequency
Gully frequency(F)is an important and useful index of gully intensity in a watershed and can re fl ect the current situation and development potential(Kheir et al.2008).The larger the value ofF,the greater the number of gullies per unit area.In other words,Fis the ratio between the number of gullies and area of the watersheds.The formula of F is as follows:

whereNis the number of gullies andAis the area of the watershed.
(3) Branching ratio and Length ratio
Gravelius(1914)was the fi rst to advocate for dividing of the size of the water channel according to the dividing principle of channel-ordering.Improved dividing principle of Strahler channel-ordering is now widely used(Strahler 1954).The branching ratio(B)and length ratio(L)were fi rst de fi ned by Horton.The calculation is based on a ratio of gully-ordering and values of B and L generally change within a narrow range.The normal stateBof a river network is between 3.0 and 5.0 andLis from 1.5 to 3.0 and both of these values are calculated by dividing the water channels in sequence.The equation follows:
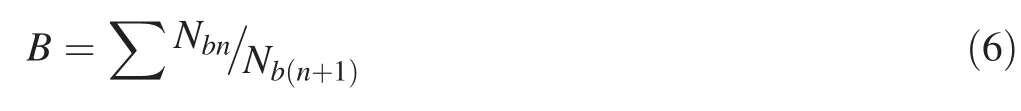
whereNbnis the number of gullies at the corresponding order,Nb(n+1)is the number of gullies of the upper-order andBis the branching ratio.
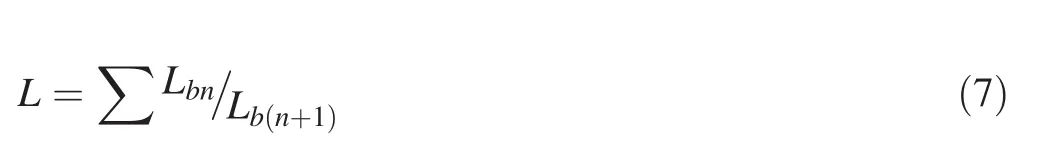
whereLnis the length of gullies at the corresponding order,Lb(n+1)is the length of gullies of the upper-order andLis the length ratio.
(4) Coef fi cient of main and tributary gullies
The coef fi cient of main and tributary gullies(M)not only re fl ects the number and degree of the tributary gully development but can also indirectly re fl ect the cutting degree of gully channels in the watershed.M≤0.16 can be de fi ned as the tributary gully type,M ranging from 0.16 to 0.38 is the semi-main gully type and M>0.38 is the main gully type(Liu and Li 2003).Mis an important index that can re fl ect the watershed geomorphology in research on channel management,exploitation,and utilization,and its application to the morphological characteristics of gully systems is worth further investigation.The formula for M is shown below:

whereLmis the length of the main gully andLtis the total length of gullies.
3.5 Analytical methods
The descriptive statistics,correlation analyses,and statistical regression modeling were applied to the statistical analysis between parameters.
4 Results
4.1 Morphological characteristics of gully systems
4.1.1 Branching ratio and length ratio
Because of the similarity between water channels and gully channels,usingBandLto measure the degree development of gully system is worth trying.As important and useful measures of indices in a water system structure,BandLcan be used to distinguish the development structure of gully systems and river networks.Variations ofBandLfor river networks range from 2 to 4 and 1 to 3.Bin the Dry-Hot Valley is 5.31.As shown in Fig.4,theBof each watershed is between 0 and 7 and the main variation range is from 4 to 6.There are 4 watersheds withB<4(accounting for 9.53%),30 watersheds withBof 4–6(accounting for 71.43%)and 8 watersheds withB>6.However,B=0 for two of the watersheds because only a single gully existed within them.
Lrefers to the average length law of water channels and is the second law proposed by Horton.Lwas found to be 3.12 in this area.Figure 4 shows that there are 35 watersheds with anLof 2–4(accounting for 83.33%)and only 5 watersheds withL>4.Lvaries with the natural geographical conditions.However,theLof the river network is generally 2 and varies between 1 and 3.Lof the gully system structure is slightly larger than that of rivers.
Based on these values,the structure of gully systems is less stable than river network structures,and the development of erosion gullies is easier than river development.The development of gullies in the study area is very typical and the number of erosion gullies increases every year.
4.1.2 Gully density and gully frequency
There are 4 watersheds with aDof 1–2 km/km2(accounting for 9.53%),5 watersheds with aDof 2–3 km/km2(accounting for 11.90%),17 watersheds with aDof 3–5 km/km2(accounting for 40.48%)and 16 watersheds with aDof 5–7 km/km2.Therefore,the degree of occurrence of gully erosion is strong and extremely strong and the development intensity of gully erosion is intense and moderate.
According to Fig.5,Fis from 1.82 to 36.6 gullies/km2.There are 10 watersheds withF<10 gullies/km2(accounting for 23.81%),24 watersheds with anFof 10–20 gullies/km2(accounting for 57.14%),7 watersheds with anFof 20–30 gullies/km2(accounting for 16.67%)and only 1 watershed withF>40 gullies/km2.
According to Horton’s research on the density of the river network and frequency of water channels for the 56 watersheds in the United States,there is an obvious correlation between the density and frequency of the river network.The relationship between drainage density(D)and channel frequency(F)for river networks can be expressed by the model shown below(Chen and Jiang 1986):

According to nonlinear regression analysis,the relationship betweenDandFfor gully systems is as follows(R2=0.84):

In Eq.(9),F/D2=0.694,whileF/D2=0.624 in Eq.(10).SoF/D2is a value without dimension but the values ofF/D2vary between different basins.By comparing Eqs.(9)and(10),theF/D2value of the river network is higher than that of the gully system.This may result from the difference between river networks and gully systems.Compared with the development of the river network,the gully systems are less stable and more vulnerable to in fl uence from human activities.Gully systems are likely to be cut off by farmland and buildings and the formation of a gully system is not as complete as a river network.Therefore,under the same density,the frequency of gully systems will be greater than that of the river network.

Fig.4 Histogram for the statistical distribution of branching ratio(B)and length ratio(L)

Fig.5 Histogram for the statistical distribution of gully density(D)and gully frequency(F)
4.1.3 Coef fi cient of main and tributary gullies
As shown in Fig.6,the variation range ofMis 0.1–0.54 and the number of watersheds decreases asMincreases.There are a total of 40 watersheds with anMof between 0.00 and 0.16.There is only 1 watershed with anMof between 0.16 and 0.38 or greater than 0.38.Therefore,the dominant number forMranges from 0.00 to 0.16 in this region and the gully systems are mainly the tributary gully type.
4.2 Morphological characteristics of watersheds
4.2.1 Area of watershed
According to Fig.7a,Ais from 0.39 to 96.43 km2.There are 34 watersheds whereA<40 km2(accounting for 80.95%)and 8 watersheds whereA>40 km2.Therefore,the total watershed area is centrally distributed.
4.2.2 Texture ratio
Tratio is from 0.82 to 39.35(Fig.7b).There are 5 watersheds withT<4(accounting for 11.90%),9 watersheds withTranging from 4 to 10(accounting for 21.43%)and 28 watersheds withT>10.In general,the three types of geomorphological textures were all present in the study area but fi ne texture was the dominant type.

Fig.6 Histogram for the statistical distribution of the coef fi cient of main and tributary gullies(M)
4.2.3 The circularity ratio
From Fig.7c,Cis between 0.30 and 0.83.There are 5 watersheds whereC<0.4(accounting for 11.90%),29 watersheds whereCis from 0.4 to 0.6(accounting for 69.05%)and 8 watersheds whereC>0.6.
4.2.4 The relief ratio
According to Fig.7d,Ris between 0.1 and 0.9.There are 24 watersheds whereR<0.10(accounting for 57.14%),15 watersheds whereRis between 0.10 and 0.14(accounting for 35.71%)and only 3 watersheds whereR>0.14.
4.3 The relationship between gully systems and watersheds
The Pearson Correlation Coef fi cient of the morphological parameters between gully systems and watersheds is shown in Table 3.Relationships were identi fi ed betweenDandT,TandA,BandC,FandD,LandB,FandT,andMandA,T,R,C,D,F,B,andL.
4.3.1 Gully systems and geomorphological texture
Tis closely related toF,DandMand the R2values are 0.755,0.709 and 0.700,respectively.Thas a signi fi cant effect on the morphology of the gully system.FittingFandTinto a nonlinear regression model has an obvious effect.The fi tting function isF=2.737 T0.623(n=42R2=0.755).Fincreases slowly withT.WhenTis<15.00,Fis more concentrated.When the ratio is≥15.00,theFdistribution is more dispersed(Fig.8).
According to K.G.Smith’s research onTvalues for 54 watersheds in the United States,the density of the river network is a function of the logarithm ofT.The constants are calculated by the least squares method.For a river network,the regression equation betweenLogDrandLogTris(Smith 1950):

Fig.7 Histogram for the statistical distribution of the parameters of watershed morphology.a Histograms for the areas of watersheds(km2),b texture ratio,c circularity ratio,d relief ratio.a Area of watershed(km2).b Geomorphological texture ratio of watershed.c Circularity ratio.d Relief ratio

Table 3 Pearson correlation coef fi cient of gully systems and watersheds morphological parameters

In this study,the fi tting effect is also obvious,according to the formulaLogD=a+bLogT.According to Fig.9,there is a signi fi cantly positive logarithmic correlation betweenLogDgandLogTg:


Fig.8 The relationship between F and T

Fig.9 The relationship between D and T
By comparing the measured value of the logarithm ofDwith the predicted values obtained by Eqs.(11)and(12),it can be seen that the measured value is consistent with the trend line of Eq.(11)and this indicates that theLogD=a+bLogTmodel can reasonably fi t the relationship betweenDandT.By comparing the calculated results of Eqs.(11)and(12),the density of the river network is substantially greater than that of a gully system underT.The watershed morphology continuously evolves because it is controlled by geological texture,rainfall,runoff,and other erosional powers.The erosional geomorphic landscape is thus formed and could re fl ect the degree of topographic fragmentation.Therefore,the degree of topographic fragmentation re fl ects the existence of rivers in the region.Compared with the density of the river network,the factors controlling gully density are not only re fl ected in the degree of topographic fragmentation but also the coupling results of other factors.

Fig.10 The relationship between M and T
As shown in Fig.10,as T increases,Mdecreases and the rate of decrease approaches zero with the increase ofT.The values ofMandTfor the watershed are uniformly distributed.Therefore,Tre fl ects the grade of the terrain broken by the watershed andMindirectly re fl ects the degree that the gully channel cuts into the ground in the watershed.Both correlations exist to a certain extent.So,Tcan be related withMand the geomorphology of the watershed signi fi cantly in fl uences the extensibility of the main gully.
4.3.2 Gully systems and watershed area
According to Fig.11,the logarithmic function fi tting coef fi cient betweenAandMis signi fi cant and the value of R2is 0.656.There is a negative correlation between them.
4.3.3 Gully systems and topographic relief
One of the data points in the results is signi fi cantly larger than the other points;it is regarded as an outlier.After deleting the outlier,the exponential function has the best fi tting effect forCandM,according to Fig.12.As theR increased,theMincreased,but the fi tting effect is not good and R2is very low.In Fig.12,theMvalue of the outlier is more than 0.38;this point represents a special case of gully system development in this research area and plays an important role in the value ofR2.
4.3.4 Gully systems and watershed shape
After deleting the two outliers,the nonlinear function has the best fi tting effect forCandM(Fig.13).With an increase inC,Mincreases at fi rst but then decreases.The relationship betweenCandMis not obvious.TheMvalue of the two outliers is more than 0.16.This is an important re fl ection on a special case of gully system development in this research area and is similar to the special case from the relationship betweenMandR.

Fig.11 The relationship between M and A
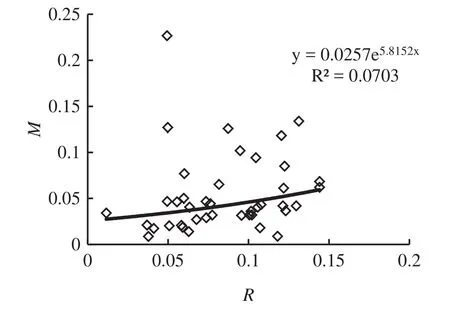
Fig.12 The relationship between M and R
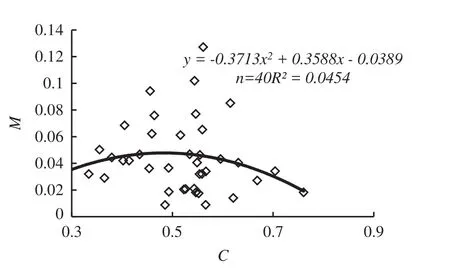
Fig.13 The relationship between M and C
5 Discussion
5.1 The developing situation of gully system structure
Different erosional effects in fl uence the scale of gully system morphology.Therefore,the gully system formed by the con fl uence of a gully is not a simple addition but a process from a single gully to a gully system.BandLcan re fl ect the development of the gully structure and are useful indexes for the gully system morphology in a watershed and.The scale of the gully system structure in the Dry-Hot Valley region varies between two stable values,which is consistent with the results of the study by Shuai(1981)on a small watershed gully system structure in Shanbei County.The average branching ratio of Dry-Hot Valley is 5.13 and the length ratio is 3.12.Compared to the typical gullies distributed on the Loess Plateau and Northeastern hilly region in China,Bfor the gully systems in the Dry-Hot Valley are greater than those in the hilly area of Northeast China(B≈3.66)and smaller than those for the Loess Plateau(B≈5.60)(Shuai 1981).The value of the branching ratio could re fl ect the developing situation of a gully system structure,so we can consider that a gully system structure of Dry-Hot Valley is developing between the Loess Plateau and Northeastern hilly region.The development of gullies in Dry-Hot Valley is very typical and the branching ratio is relatively large.There are a large number of tributary gullies which embody the gully erosion continuously.The development of gully systems is affected by the coupling effect of soil properties,stratum structure,climatic conditions,natural terrain and human activities(Xu et al.2014).According to previous research(Zhang et al.2009;Mu et al.2015;Deng et al.2015)and the results of this study,the soil in the Dry-Hot Valley is mainly xerothermic soil,which is characterized by high erosional vulnerability,a poor degree of cementation,and loose soil structure.The unique soil properties and stratum structure determined the formation ofuniquelinear undercutting grooves in the region.The development of gullies was also boosted by climatic conditions.Fractures and collapses occurred due to the action of heavy rain and the gully head retreated.The erosion of the gully bed and wall accelerated the lateral and downward erosion of the gullies,prompting further development of the gully system.
5.2 The developing degree of gully systems
DandF(gully cutting density and frequency,respectively),re fl ect not only the intensity of soil erosion and channel development but also the potential danger of soil erosion.According to the analysis above,the degree of gully erosion is very strong and intense and the gully erosion intensity is moderate and slight.In China,Din the hilly area in the northeast(D≈3.83 km/km2)(Xu et al.2014) is less than that in the Dry-Hot Valley(D≈4.29 km/km2)which is less again,than that on the Loess Plateau(D≈5.93 km/km2)(Liu et al.2013).The gully density in each area results from the coupling of many local factors.The different values of gully density across different regions are worthy of further study.Comparing the results with the Arid Zone of Azerbaijan Republic,Gurbanov(2017)found thatDis between 2.0 and 7.0 km/km2and the gully frequency is about 15.6 gullies/km2.The gully density in Dry-Hot Valley is between 0.54 and 6.98 km/km2and the gully frequency is about 14.39.Without considering other factors,such as vegetation,climate,and soil,these results show thatDandFin Dry-Hot Valley are mainly affected byT.
Geomorphological texture can promote the development of a furrow system,which is mainly presented in the preliminary and middle stages of gully development.In the later stage of gully development,the main and tributary gullies have completely developed and so the gully morphology gradually becomes complete;the active period of gully development gradually ends.The gully system has fully realized its development potential and the rate of geomorphological texture gradually approaches a constant value.The research results for the Arid Zone in Azerbaijan indicate thatDandFare closely related with watershed area,which can be considered to be the result of different development intensities of gully system,caused by the differences in the in fl uencing factors.
5.3 The morphological characteristics of watersheds
The SWAT model was used to determine 42 watersheds and their respective area values.The differences in watershed area are large(from 0.39 to 96.43 km2),which re fl ects the large differences in terrain in study area.Given these differences,it appears that the geological structure affects the length and width of watersheds.Topographic relief is another important feature re fl ecting the morphology of the watershed.Ris an important index that can re fl ect the characteristics of topographic relief and it has been widely studied.However,Rhas been ignored in recent years.According to Morisawa(1962),the value ofRfor 15 watersheds in the Appalachian Plateau of the United States ranges from 1.5 to 3.0.In contrast,R of the Dry-Hot Valley(0.1–0.9)is much lower.SinceRis an expression of the relationship between the height and length of a watershed,one of the reasons for the difference in terrain ratio is the deviation between watershed height and length.Another possible reason is the in fl uence of terrain.The middle part of the Dry-Hot Valley is a basin surrounded by hills and mid to low mountains.The Appalachian terrain is mainly plateau,which is different to the Dry-Hot Valley.
5.4 The relationship of the gully systems and watershed
Considering only natural factors,the development speed,scale,and quantity of gully systems are mainly affected by the non-zonal factors:watershed morphology,geomorphological texture,the degree of cutting of the gully,and gully networks in the region(Zhang 2014).Based on previous research,this paper divides watershed characteristics into geomorphological texture,scale,topographic relief,and shape from the perspective of watershed morphology.There is a signi fi cant relationship between watershed morphological characteristics and gully system morphology;in particular,geomorphological texture characteristics are signi fi cantly related toD,F,andM(R2≥0.7).The shape of the gully system is limited by the watershed.The more circular watersheds have smaller,longitudinal gully systems and the development range of tributary gullies is relatively wide,which restricts the development of the main gully to a certain extent.Watershed circularity can also re fl ect the watershed’s scale.In general,the erosion degree and development degree of tributary gullies can be estimated through the degree of topographic breakage in the basin,which provides some theoretical basis for the evaluation of gully erosion by the latter.The scale,topographic relief,and shape of the watershed correlate withM.The analysis of the main tributary gully condition is conducive to understanding the gully systems and determining a comprehensive and targeted gully control mode.For example,for tributary gullies,attention should be paid to the interception and control of runoff and sediment in the small branch con fl uence area so as to prevent gully bank expansion and trench head advance.The discovery of the signi fi cant relationship between the watershed’s morphological characteristics andMcan be further classi fi ed from the perspective of the watershed morphological characteristics based on the classi fi cation of the gully development degree,which is expected to provide more targeted measures for soil erosion control.
6 Conclusion
This study investigated the morphological characteristics of gully systems and watersheds.The study area is 1141.66 km2,17,382 gullies are interpreted,42 sub-watersheds are identi fi ed and the average ofDis 4.29 km/km2.On the whole,the selected gully systems’morphological parameters includedB,L,D,andF.These parameters could be used to present the developing situation of gully systems as well as the development of the main and tributary gullies.The implications of morphological characteristics that in fl uence watersheds can be divided into categories of scale,topographic relief,shape,and geomorphological texture.The morphological parameters includeA,R,C,andTand they fully re fl ect information of watershed morphology.The developing situation of a gully system is relatively independent as there is only a slight change in the rates,based on varying natural conditions.In addition,the study found that there are strong relationships between the morphological characteristics of a watershed and the degree of development of the main gully and tributary gullies,which provides a scienti fi c basis for gully control from the watershed perspective.Taken together,the results of this study provides a reference for further quantitative,geomorphological study.
AcknowledgementsThe authors are grateful for fi nancial support from the Meritocracy Research Funds of China West Normal University(17YC134,17YC105),Project of Sichuan Provincial Department of Education and Ecological Security Key Laboratory of Sichuan Province(ESP201301),the Project of Science&Technology Department of Sichuan Province(2018SZ0337,2017JY0189),the Project of Sichuan Provincial Department of Education(16ZB0182,18TD0025,18ZA0465).
杂志排行

Acta Geochimica的其它文章
- The effects of clay minerals and organic matter on nanoscale pores in Lower Paleozoic shale gas reservoirs,Guizhou,China
- Age and geochemistry of Early Ordovician A-type granites in the Northeastern Songnen Block,NE China
- Origin and genetic family of Huhehu oil in the Hailar Basin,northeast China
- Genesis of fahlore in the Tianbaoshan lead–zinc deposit,Sichuan Province,China:a scanning electron microscopy–energy dispersive spectroscopy study
- State of rare earth elements in the rare earth deposits of Northwest Guizhou,China
- Does bicarbonate affect the nitrate utilization and photosynthesis of Orychophragmus violaceus?