Distribution and geochemical signi fi cance of trace elements in shale rocks and their residual kerogens
2018-10-25JianbingXuBinChengQianDengYunganLiangOluwabamiseLekanFaboyaZewenLiao
Jian-bing Xu·Bin Cheng·Qian Deng·Yun-gan Liang·Oluwabamise Lekan Faboya·Ze-wen Liao
Abstract There is a dearth of information about the distribution of trace elements in kerogen from shale rocks despite several reports on trace element composition in many shale samples.In this study,trace elements in shale rocks and their residual kerogens were determined by inductively coupled plasma–mass spectrometry.The results from this study show redox-sensitive elements relatively concentrated in the kerogens as compared to the shales.This may be primarily due to the adsorption and complexation ability of kerogen,which enables enrichment in Ni,Co,Cu,and Zn.For the rare earth elements(REEs),distinct distribution characteristics were observed for shales dominated by terrigenous minerals and their kerogen counterparts.However,shales with less input of terrigenous minerals showed similar REE distribution patterns to their residual kerogen.It is speculated that the distribution patterns of the REEs in shales and kerogens may be sourcerelated.
Keywords Shale·Kerogen ·Trace elements·REEs
1 Introduction
Trace elements are characterized by low concentration,do not exist independently,and are often associated with mineral solids(Han et al.2003).Trace elements in living water have different geochemical behavior.For example,organisms take up P,N,Fe,Cu,Ni,Zn,etc.as nutrients(Pedersen and Calvert 1990)and can selectively adsorb trace elements(Kaewchai and Prasertsan 2002;Vijayaraghavan and Yun 2008;He et al.2010;Rani et al.2010;Shaaban et al.2015)such as Nd(Palmieri et al.2002)and rare earth elements(REEs)(Palmieri et al.2002;Diniz and Volesky 2005;Vlachou et al.2009;Xu et al.2011).Following the death of the organism,these elements are eventually deposited in sediment along with the organism to form organic matter.Cr,V,and U—which have multiple oxidation states—show variable solubility in water under different redox conditions.Under oxidizing conditions,they tend to dissolve and remain mostly in water;under reducing conditions,they can form complexes with humic/fulvic acid or adsorb to organic matter,thereby reducing their solubility in water.Trace elements such as Nb,Ta,Zr,and Hf are used to trace source information due to their relatively weak activity during sedimentation and short residence time in seawater(Holland 1978).Trace elements under different geochemical environmental conditions behave differently,making them suitable for paleoproductivity reconstruction and determining paleo–redox conditions(Dymond et al.1992;Tribovillard et al.2006).
Sediments from different source regions have distinct REE distribution characteristics;REEs re fl ect the parental sedimentation environment(McLennan 1991).The watersolubility of REEs during weathering and diagenesis is very low and can assist in discriminating the tectonic background of sedimentary basins when integrated with other trace elements such as Th,Zr,Sc,etc.(Bhatia and Crook 1986).The distribution of REEs also depends on the nature of the geochemical environment(Han et al.2003).For example,Eu2+can only exist under reducing conditions while Ce4+can be found under oxidizing conditions;thus,redox conditions determine the availability of Eu or Ce in sediments.
Trace elements have important applications in reconstructing paleoproductivity,indicating redox conditions in ancient water,and in fl uencing the generation of hydrocarbons from organic matter(Mango 1992).However,only a few studies have been carried out on trace element composition in kerogen.Pi et al.(2013)used REEs of black shale kerogen to better describe paleo-oceanic redox conditions and the origin of extreme metal enrichment in Guizhou Province,South China.Based on the distribution of REEs and organic carbon isotopes of kerogen,Li et al.(2013)reported a new method for oil–source rock correlation for high maturity rocks and oils.
The present study was conducted to investigate the distribution patterns of trace elements in shale samples—and their residual kerogens—collected from different depositional environments.An attempt was made to better understand the factor(s)controlling the distribution of these elements in shales and kerogen.
2 Samples and experiments
2.1 Samples
Samples of fi ve shales were collected from formations having different depositional environments.One sample was obtained from each of the following outcrops:the Mesoproterozoic Xiamaling Formation(XML)in Xiahuayuan District of Hebei Province,the Cambrian Niutitang Formation(NTT)in Songlin Region of Zunyi County,and the Permian Lucaogou Formation(LCG)in the Yuejingou section of Santanghu Basin.Additionally,two drill core samples(LMX1 and LMX2)were obtained from the Silurian Longmaxi in Sichuan Basin.Organic geochemical parameters for the samples are summarized in Table 1.
The total organic carbon(TOC)values of these samples ranged from 0.39%(LMX1)to 10.88%(NTT)(Table 1).XML and LCG samples had low thermal maturity,while the other samples were categorized as highly over-mature.XML and NTT samples had type I organic matter,while LCG,LMX1,and LMX2 had mixed type I/II.Samples XML,NTT,and LMX2 were deposited in a marine environment(Dong et al.2010;Bai 2012;Wang et al.2013),while LCG was deposited in a lacustrine environment(Wang et al.2012).
2.2 Methods
The surface layer of the outcrop samples was trimmed and washed with deionized water and then dried.The washed and dried samples and the two drill cores were ground to powder.Parts of the powdered samples were treated with HCl and HF to isolate the kerogens according to the method described by Fu and Qin(1995).The powdered samples and their kerogens were analyzed for trace elements.
Two grams of LMX1,LMX2 and their kerogens(LMX1-K and LMX2-K)were carefully weighed into a porcelain crucible and ashed at 600°C for 3 h.Then,40 mg of the ashed sample was put in a bottle and treated with HNO3,HF,and HClO4to obtain a solution of the sample.An internal standard(Rh)was added to the acidhydrolyzed solutions and then transferred to a polyethylene bottle prior to analysis.Detailed experimental procedures can be found in Liu et al.(1996).
The remaining shales and kerogens were digested using a microwave digestion system.For the shale samples,~0.1 g of each pulverized sample was weighed into a PTFE microwave digest vessel and then treated with HNO3/HF(10 mL/5 mL).After allowing it to stand for 30 min,it was then transferred into a Microwave Digestion System(MARS-5).The oven temperature was ramped from room temperature to 190°C within 30 min,held isothermally at this temperature for 60 min,and allowed to cool naturally to room temperature.This procedure was repeated until the whole sample was completely digested.Finally,the digested sample was diluted to 100 mL with deionized water.

Table 1 Basically Geochemical feature of the samples
For the kerogen digestion,~0.1 g each of the powdered sample was weighed into a PTFE microwave digest vessel,3 mL H2O2was added,and the solution was allowed to stand for 30 min.Thereafter,10 mL HNO3and 5 mL HF were added.The remaining procedures were the same as those of the shale.
Scanning electron microscopy(SEM)analysis for the shale samples was completed at Material Science Laboratory,SAE Technologies Development(Dongguan)Co.,Ltd.The samples were polished with 400,800,1000,and 2000 mesh sandpaper to a 2 cm×1 cm×0.5 cm prism and the specimen was then coated with gold.
2.3 Analysis
Elemental analyses of trace elements in samples LMX1 and LMX2 and their kerogens(LMX1-K and LMX2-K)were carried out using an Elan 6000 inductively coupled–plasma mass spectrometer(ICP-MS)manufactured by Perkin Elmer,USA.The operating parameters of the instrument were:RF power 1175 W;Nebulizer with 0.83 L/min- fl ow mode.The plasma argon gas had a fl ow rate of 15 L/min and the auxiliary argon gas had a fl ow rate of 1.2 L/min.Data acquisition was achieved in the mainpeak jumping mode at an integral time of 100 ms(Liu et al.1996).
Trace elements in the shales(XML,LCG,NTT)and their kerogens(XML-K,LCG-K,NTT-K)were determined using an X Series II ICP-MS manufactured by Thermo Fisher,USA.The operating parameters were as follows:RF power 1400 W;Nebulizer with 1.02 L/min fl ow mode.The plasma argon gas had a fl ow rate of 0.82 L/min and the cooling gas 13.0 L/min.Acquisition of data was accomplished in main-peak jumping mode at an integral time of 100 ms.
X-ray diffraction(XRD)analysis of the shale rocks was carried out on an OLYMPUS Innova-X BTX.The operating parameters were as follows:working voltage 31 kV with an electric current of 0.4 mA,a Co target was the X-ray light tube,200 exposures,exposure frequency 3 times/min,and the 2θ range 3°to 55°.
The microcosmic surface morphology of the shales was observed by JSM-7800 SEM–energy dispersive spectrometer(SEM–EDS).This instrument has a working voltage of 10.0 kV and a working distance of 10.1 mm under backscattered electron imaging mode.
3 Results and discussion
3.1 Mineral composition in shale
The following minerals were identi fi ed in the shales:quartz,feldspar,calcite,dolomite,illite,pyrite,chlorite,and apatite(Table 2,Fig.1).Quartz and calcite were detected in all the samples(Fig.1).Figures 2 and 3 show XRD distribution patterns and SEM–EDS images of the minerals in the shales.The amount of quartz in all the shale samples except LMX1(19.8%)was>30%.Sample XML had the highest calcite content(9.9%);other samples had values that ranged from 6.3%to 8.6%.Feldspar and illite were not detected in samples XML and LCG,respectively.However,the amounts of feldspar and illite in other samples ranged from 14.7%to 28.1%and 21%to 40%,respectively.The dolomite contents for samples LCG,LMX1,and LMX2 were 18.7%,2.4%,and 3.3%,respectively.The amounts of pyrite in NTT,LMX1,and LMX2 were 9.7%,1.8%,and 2.5%,respectively.No pyrite was found in XML or LCG.Chlorite contents were 13.7%and 6.2%in LMX1 and LMX2,respectively.Apatite was not detected in any of the samples except LCG with 11.2%.
3.2 Distribution of trace elements in the shale and kerogen
As shown in Table 3,the trace element distribution varied signi fi cantly across shale samples.The abundance of trace elements in XML and LCG was generally low compared to the other samples.The concentrations of the total trace elements in XML and LCG shales were 1175.67 and 1488.69 ppm,respectively.The other three shales had totaltrace element concentration up to 2100 ppm.In XML,the mostabundantelementwasMn with avalueof 258.30 ppm,while V,Zn,Cu,and Zr ranged from 100 to 160 ppm.The concentrations of other trace elements in XML were all<90 ppm.The highest concentration trace element detected was 2865.90 ppm Ti in LCG.The concentrations of Mn,Sr,Ba,and Cr inLCG ranged from 100 to 550 ppm,while the concentrations of the rest of the trace elements were generally<65 ppm.The amounts of Ni,Zn,and V in NTT were 675.14,553.32,and 416.49 ppm,respectively;while the other trace elements were all<90 ppm.LMX1 and LMX2 had similar concentrations of trace elements;Ti was the most abundant.
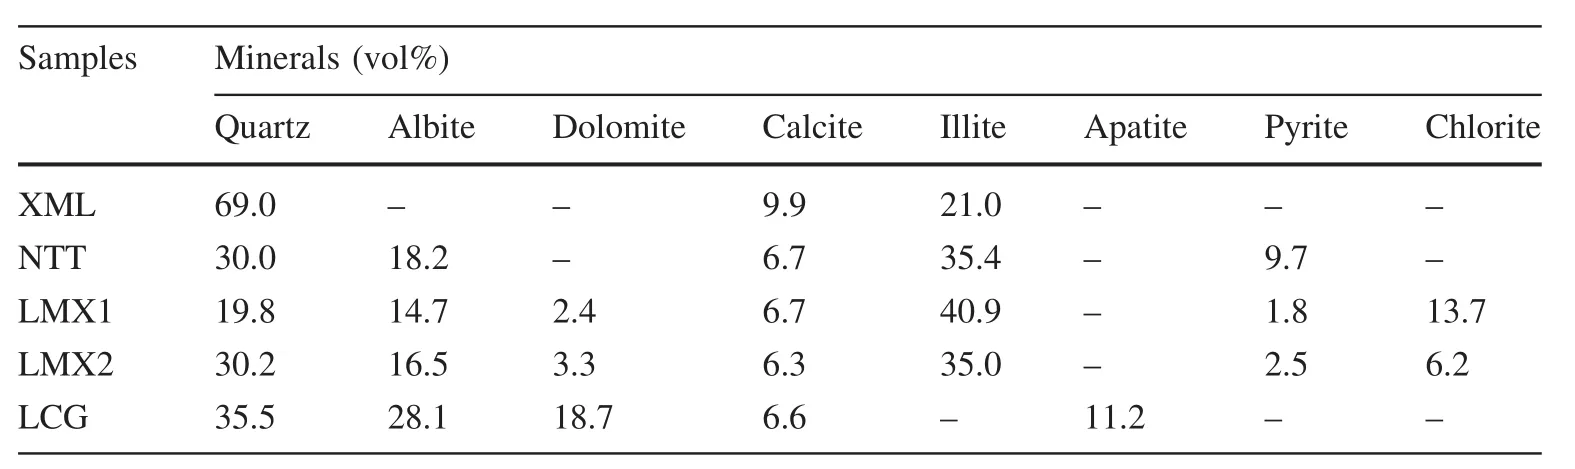
Table 2 Mineral composition of the shale samples
Similar to the shale samples,the distributions of trace elements in the kerogen samples were different.The concentrations of trace elements in XML-K and LCG-K were generally low compared to other samples.The total trace element concentrations in XML-K and LCG-K were 736.7 ppm and 183.45 ppm,respectively,while those of the other kerogens were>5500 ppm.The concentrations of Ni and Ba in XML-K were 380.30 and 249.43 ppm,respectively,while the concentrations of other elements were all<45 ppm.Ni had the highest concentration among the trace elements in NTT-K with 3097.97 ppm.The Zn and Cu concentrations of NTT-K were 733.44 and 666.31 ppm,respectively.NTT-K concentrations of V,Cr,Mn,Co,Ge,and Zr ranged from 100 to 200 ppm,while the other trace elements were less than 70 ppm.The distributions of trace elements in LMX1-K and LMX2-K were generally similar.Ti dominated both samples with values ranging from 5517 to 8132 ppm.Mn,Ni,and Zr had values of 1000–4000 ppm.Co,Zn,and Pb contents LMX1-K and LMX2-K ranged from 100 to 700 ppm,and other trace elements were<100 ppm.
The enrichment coef fi cients of the samples were determined as the ratio of the trace element concentration to the world average shale value.The enrichment coef fi cient values for trace elements in the samples were showed in the Table 4.Samples were considered enriched when the enrichment coef fi cient was>1.The results show that XML was enriched in V,Co,Cu,Zn,Ge,and U.NTT was enriched in Cr,Co,Zn,Ge,and U,while LCG was enriched in Cr and U.LMX1 and LMX2 were enriched in Cr,Zn,Ge,Pb,Th,and U.The enrichment of trace elements in the kerogens was clearly different from in their corresponding host rocks.XML-K and LCG-K were enriched in Ni and Ge,respectively.Redox-sensitive elements such as Ni,Cu,Zn,and U were relatively high in kerogens(NTTK,LMX1-K,and LMX2-K),with enrichment coef fi cients>2.
Figure 4 shows characteristics of the trace elements in the shales and their corresponding kerogens.The concentrations of trace elements in XML and LCG and their corresponding kerogens were generally low.However,the total concentrations of trace elements in these two shales were higher than in their corresponding kerogens.The kerogens of samples NTT,LMX1,and LMX2 were enriched in redox-sensitive elements(such as Co,Ni,Cu,and Zn)and high fi eld strength elements(such as Zr,Nb,Hf,and Ta).

Fig.1 Histogram of the mineral composition in the shales
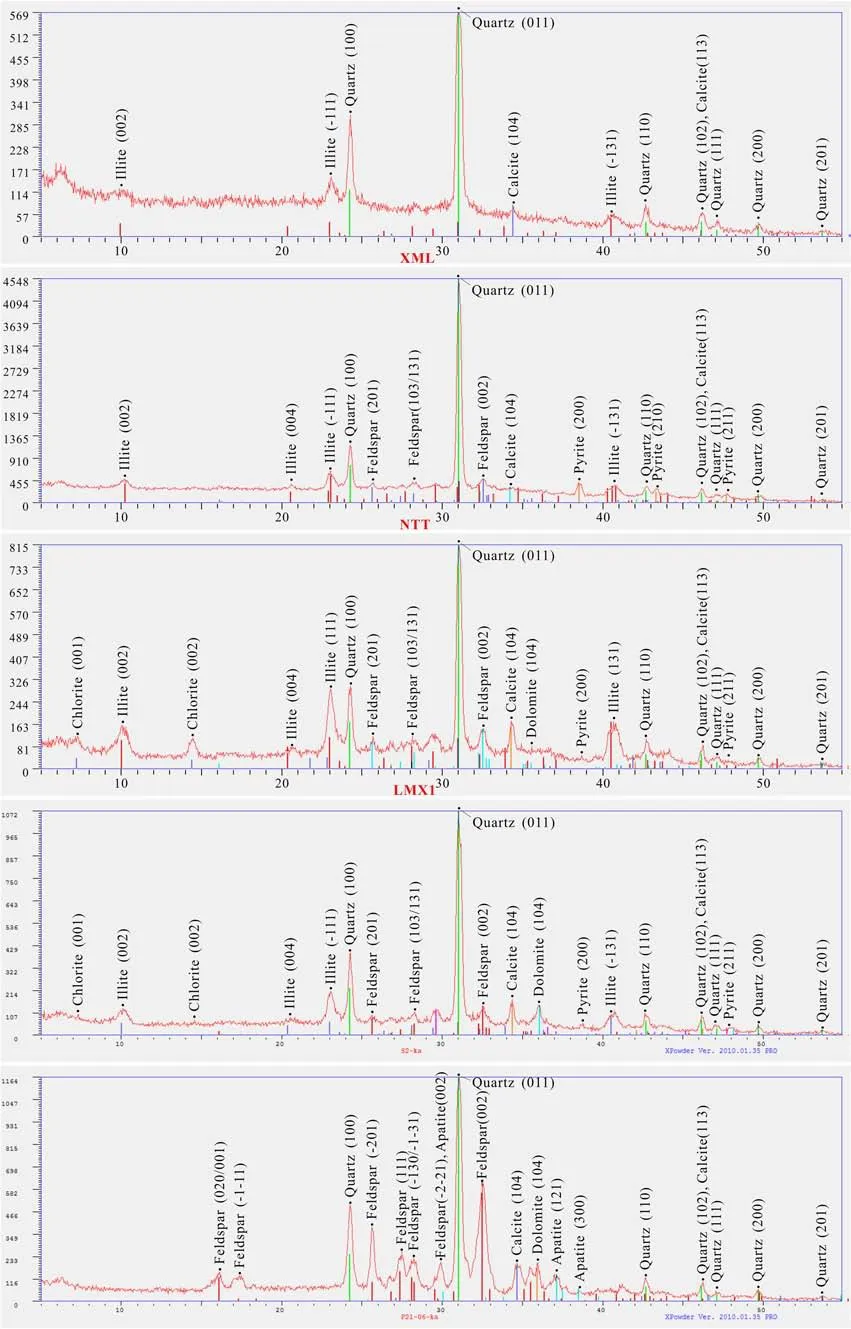
Fig.2 XRD distribution pattern of minerals in shale

Fig.3 SEM–EDS images of the minerals

Table 3 Trace elements in the shales and their kerogens(ppm)

Table 4 Concentration factor of trace elements in the shale and their kerogens

Fig.4 Comparative chart of the trace elements in the shales and their corresponding kerogens
3.3 Distribution of rare earth elements in the shale and kerogen
The abundance of REEs in the samples varied greatly(as shown in Table 5).Among the shales,the highest total REE contenREEs,as shown in Table 6)was found in LMX1(239.79 ppm),and the lowest in XML(38.76 ppm),while the amount of REEs in samples NTT,LMX2,and LCG were 160.66,220.22,and 106.22 ppm,respectively.Among kerogens,the highest∑REEs was found in LMX2-K (350.69 ppm)andthelowestinXML-K(20.06 ppm).
The REE distribution patterns of the sampled shales(standardized to the Post-Archean Australian Shale)are shown in Fig.5.LMX1,LMX2,and LCG had a relatively f l at pattern(Fig.5a)with light REE/heavy REE(LREE/HREE)ratios of 4.87,3.30,and 2.92,respectively,indicating slight LREE enrichment.In addition,all three of these samples had a slightly negative Ce anomaly.LMX1 and LMX2 had a slightly negative Eu anomaly;LCG had a clear positive Eu anomaly.XML had a hat pattern due to strong enrichment of the middle REEs(MREEs)with a strong positive Ce anomaly(Ce/Ce*=7.59)and a positive Eu anomaly(Eu/Eu*=2.12).NTT had a fl at pattern with a slightly leftward inclination.In the NTT shale,Ce and Eu anomalies were not obvious and the LREE/HREE ratio was 2.29.
We divided the distribution patterns of REEs in the kerogens into three groups(Fig.5b):(1)Group I:slightly leftward inclination and a slightly negative Eu anomaly(LMX1-K,LMX2-K);(2)Group II:MREE enrichment with slightly positive Eu and Ce anomalies(NTT-K,LCGK);(3)Group III:MREE enrichment with strong negative Ce anomaly and positive Eu anomaly(XML-K).
Figure 6 shows the comparative characteristics of REEs in shales and their corresponding kerogens.The abundances of REEs except for Ce and Gd in XML and XML-K were almost the same.Distribution characteristics of REEs in the shale samples NTT and LCG were both similar to their kerogen.The LREE contents in NTT and LCG shales were higher than those in kerogens,while the HREE contents in the two shales were roughly similar to their kerogens.LMX1 and LMX2 were similar in that the LREE contents in the shales were higher than in their kerogen but the HREE contents were generally low.The differences in REEs between the shales and kerogens were more obvious in the REE distribution patterns(Fig.5c–f).The REE patterns of XML,NTT,and LCG shale samples were similar to those of their corresponding kerogens,but signi fi cant differences were observed between the shales from the Longmaxi Formation and corresponding kerogens.The Longmaxi Formation kerogens were more enriched in HREEs than were their host shales.

Table 5 Rare earth element and Y in the shales and their kerogens(ppm)

Table 6 Treatment of trace elements and rare earth element in the shales and their kerogens
3.4 The occurrence and evolution of trace elements in shale and kerogen
3.4.1 Redox environment of shale deposition
The redox conditions of shales can be determined using the ratios of redox-sensitive elements as indicators(e.g.V/(V+Ni),V/Cr,Ni/Co,and δU)and the mineralogical characteristics of pyrite.But if the trace elements are mainly from detrital provenance or have been affected by hydrothermal fl uids,they cannot be directly used as paleoenvironmental indicators.The impact of detritus can be deduced by the formula TMXS=TMsample-Tisample-×(TM/Ti)averageshale,in which TMXSrepresents the concentration of the element from the authigenic fraction of the sample,TMsamplerepresents the concentration of trace elements,and Tisamplerepresents the concentration of Ti.The effect of hydrothermal fl uids can be distinguished by the Zn–Ni–Co triangle(Fig.7)(Cronan 1980).As shown in Fig.7,all the shale samples had been affected by hydrothermal fl uids.Therefore,V/(V+Ni),V/Cr,and Ni/Co were not suitable for discriminating redox environment.Redox conditions for the shale samples were therefore determined using δU.The values for δU are listed in Table 7.The δU value for LMX1 indicated a normal seawater environment,while the rest of the shale samples were deposited in reducing environments.
Pyrite under SEM is shown in Fig.8.The pyrite in NTT and LMX2 was strawberry-like with a particle size of about 6 μm,supporting that both NTT and LMX2 shales were deposited in reducing environments.The LMX1 shale had few self-morphic pyrites,indicating an oxidizing environment(Wilkin et al.1996).Both LMX1 and LMX2 were collected from the lower segment of the Longmaxi Formation;LMX2 was taken from the lowest part of the formation.Under the in fl uence of the Duyun movement,the lower segment of the Longmaxi Formation is a regression system.Based on the differences in gamma ray and Ca/(Fe+Ca)values and the fossil species from the LMX1 and LMX2 shales,LMX1 was deposited in a more oxic depositional environment than LMX2(Wang et al.2015),corroborating δU values and pyrite characteristics.

Fig.5 REEs Pattern of the shales and their kerogens
3.4.2 Geochemical evolution of trace elements in shale and kerogen
Each evolutionary stage of sedimentary rock is accompanied by the geochemical evolution of trace elements.Each element has different geochemical behavior.A schematic diagram of the geochemical evolution of trace elements is shown in Fig.9.
3.4.2.1 MicronutrientsMicronutrients such as Ni,Cu,Zn,etc.are ingested by organisms and are later removed from the water column during deposition.These elements are deposited with the organic matter under certain conditions.The implication of this is organic matter is enriched in these trace elements.The kerogens from the NTT,LMX1,and LMX2 shales are thought to have been enriched in micronutrient elements during such a process.
However,XML-K and LCG-K were not enriched in these micronutrient elements.This might be due to the in fl uence of mantle-originated thermal fl uid movement during the depositional process(Liu et al.2013;Cheng et al.2018).Mn and Fe hydroxides are usually present in thermal fl uid and can adsorb Co,Ni,Cu,and Zn elements to positively in fl uence the concentrations of those elements in shales(Tribovillard et al.2006).

Fig.6 Comparison of the rare earth elements in the shales and their kerogens
3.4.2.2 Redox-sensitive elementsThe enrichment of Co,Ni,Cu,and Zn in LMX1-K as compared to LMX1 might be due to several factors.The distribution,circulation,and differentiation of redox-sensitive elements in seawater and sediments are governed by their chemical properties and marine redox conditions.In oxic water,Ni exists mainly in the form of soluble NiCO3or adsorbed on humic and fulvic acids(Algeo and Maynard 2004),Cu exists mainly as an organometallic ligand(Algeo and Maynard 2004),Zn exists mainly in the form of a complex with humic/fulvic acid,and Co can also combine with humic/fulvic acid.
In reducing water,Ni can be stored as Ni-porphyrin in sedimentary organic matter,and also can be incorporated as insoluble NiS into pyrite(Piper and Perkins 2004).The Cu is reduced to monovalent and may be incorporated in the solid solution phase of pyrite or form CuS and CuS2;Zn can enter the solid solution phase of pyrite in the form of ZnS;Co can also form insoluble CoS captured by pyrite(Calvert and Pedersen 1993).In addition,redox-sensitive elements can be adsorbed on the surface of organic matter to form organometallic complexes and enter sedimentary organic matter(Tribovillard et al.2006).Therefore,NTTK and LMX2-K were more enriched in Co,Ni,Cu,and Zn than their host rocks and total concentrations of trace elements in LMX1-K,NTT-K,and LMX2-K kerogens were higher than in their corresponding host shale samples.
Similar patterns were not observed in the XML and LCG shales,though they were deposited in reducing water.LCG was deposited in a saline lake,in an arid climate,and with enrichment coef fi cients of typical land-source elements Zr and Hf of 0.29 and 0.45,respectively,indicating that the input of terrestrial sources was low(Wang et al.2012).Trace element concentrations in LCG and LCG-K were generally low.The LCG shale was affected by mantle-originated thermal fl uid fl ow during the depositional process(Liu et al.2013;Cheng et al.2018).Phosphate in hydrothermal fl uid can combine with Ca to form apatite,which might be the reason for higher Sr content in LCG.In addition,hydrothermal fl uids can cause the formation of a large amount of Mn and Fe.The adsorption of Co,Ni,Cu,and Zn by Mn and Fe hydroxides(Tribovillard et al.2006)may promote their enrichment in shales.Therefore,XML and LCG,which have been signi fi cantly affected by hydrothermal fl uids(Chen et al.2015;Liu et al.2013;Cheng et al.2018),were more enriched in Co,Ni,Cu,and Zn than were their corresponding kerogens.When pyrite is present in kerogen,the content of redox-sensitive elements in kerogen is affected.
3.4.2.3 Rare earth elementsREEs have been widely used in studying petrogenesis,mineralogy,formation,and evolution of the crust due to their unique geochemicalproperties.The main sources of REEs in shale are terrigenous inherited minerals and authigenic components.Terrigenous inherited minerals are particles that are transported by water and wind to the sedimentary basin after weathering and erosion of the mother rock.Their REE features are controlled by the weathered parent material.Authigenic components are substances that often precipitate out of the water through a series of biological and chemical processes.Their REE distributions re fl ect the characteristics of REEs in seawater(Piper 1974).In an environment with sub-marine hydrothermal activity,the REE characteristics of the shales will also be affected by hydrothermal fl uids(Piper et al.1975).REE distribution in kerogensmainly re fl ectsREE characteristicsofthe organism or its depositional environment(Li et al.2013).

Fig.7 Zn–Ni–Co triangular diagram of the shales(underlying graph cited from Cronan,1980)
Trace element parameters,such as Y/Ho ratio and high f i eld strength elements(e.g.Zr and Th)of shales indicate terrigenous inherited minerals(Bau and Dulski 1996;Xu et al.2013),but these parameters(except Th)may also be in fl uenced by seawater altered by hydrothermal fl uids(Bau and Dulski 1996).Therefore,when hydrothermal fl uids are involved(Chen et al.2015),the Y/Ho ratio and enrichment coef fi cient of Zr are not good indicators of mineral source.The low value of Th enrichment coef fi cient(0.04)(Table 7)suggests that the proportion of terrigenous inherited minerals in XML is not signi fi cant.The in fl uence of hydrothermal fl uids may also have led to XML havingpositive Eu and Ce anomalies,and enrichment of LREEs(Ding et al.2000).REE distribution in the XML shale re fl ects the REE characteristics of seawater;hence,XML and its kerogen(XML-K)have similar REE distribution characteristics.Similarly,the LCG shale has limited terrigenous inherited minerals(Wang et al.2012)and a low Th enrichment coef fi cient resulting in LCG and its kerogen(LCG-K)having similar REE patterns.
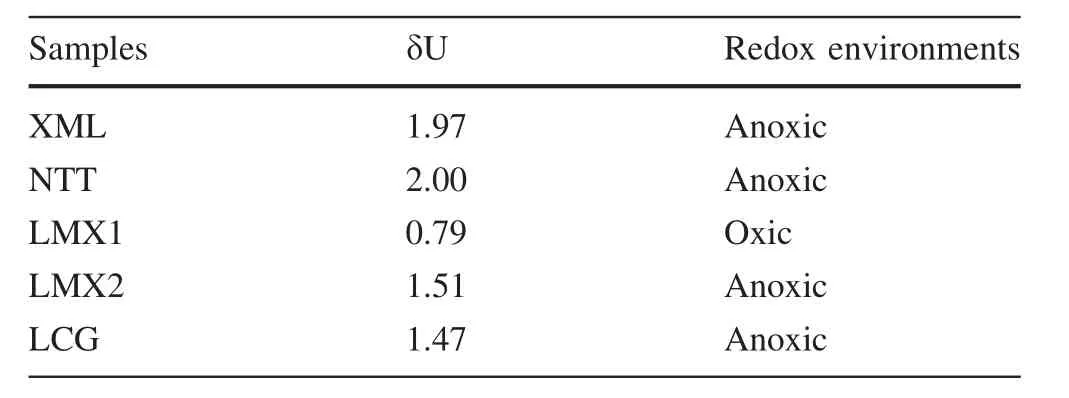
Table 7 Discrimination index of paleoredox conditions of the shales

Fig.8 SEM characteristics of pyrite in the shales(The picture in the upper right is a magni fi ed view of the corresponding position)
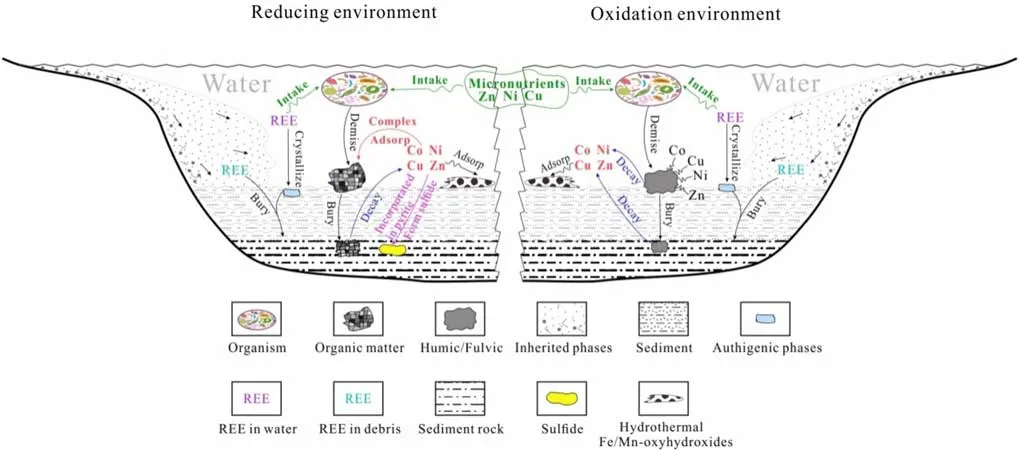
Fig.9 Trace element geochemical evolution(Arrows represent different physical,chemical and biologicalprocesses,‘‘Co Ni Cu Zn’’of red represent those elements dissolved in water,‘‘Co Ni Cu Zn’’of black represent those elements complex with humic/fulvic,‘‘Ni Cu Zn’’of green represent those elements act as nutrients)
DistinctREE distribution patternswere observed between LMX1 and LMX2 shales and their kerogens.This is because the REEs in the shales are in fl uenced by terrigenous inherited minerals while that of their kerogen counterparts re fl ects the effect of seawater.This is manifested in two ways:(1)The Y/Ho ratio(26.36 for LMX1,28.17 for LMX2)and enrichment factors of Zr(0.57 for LMX1,0.65 for LMX2)and Th(1.82 for LMX1,1.46 for LMX2).All these values suggest that terrigenous inherited minerals dominate samples LMX1 and LMX2;the REE distribution characteristics of LMX1 and LMX2 are mainly controlled by terrigenous inherited minerals.Due to the deep water and the presence of terrigenous particulate matter at all depths,the REE characteristics in LMX1 and LMX2 are similar to those of the average particulate matter in seawater— fl at or with a slightly right dip(Alibo and Nozaki 1999).(2)The REE characteristics of dissolved substances in seawater are characterized by the enrichment of HREEs.With the increase in REEs of dissolved materials,the enrichment of HREEs also increases(Alibo and Nozaki 1999).This is re fl ected in the REE compositions of LMX1-K and LMX2-K,with both exhibiting enrichment of HREEs.
The Y/Ho ratio(40.70)and Zr enrichment coef fi cient(0.37)observed for NTT suggests that terrigenous inherited minerals are very low in the shale.The REE characteristics of the NTT shale and its kerogen both re fl ect the REE characteristics of water during deposition.The evolution of REEs in shale during deposition is illustrated in Fig.9.If terrigenous inherited minerals were the dominant components in the shale,the REE characteristics of the shale would mostly re fl ect the comprehensive characteristics of the REEs of the various inherited minerals,and the REE characteristics of the shale and kerogen would be signi ficantly different.Similarly,ifauthigeniccomponents dominated the shale,the REE characteristics of the shale would mainly re fl ect the comprehensive characteristics of REEs in the individual authigenic components;that is,the REE characteristics of the water column during deposition.
4 Conclusions
This study investigated the distributions of trace elements in shales from the Mesoproterozoic,Cambrian,Permian,and Silurian and their residual kerogens.Trace element distributions in the shale samples differed signi fi cantly from their corresponding kerogens.Redox-sensitive elements were relatively depleted in shale samples as compared to their kerogen counterparts.
The XML sample was enriched in MREEs and showed a clear positive Ce anomaly.Similar REE composition characteristics were observed in the XML kerogens.The LCG sample and associated residual kerogens also showed REE compositional features similar to each other with a slight increase toward the right.The LMX1 and LMX2 shale rocks from the Sichuan Basin both had a fl at pattern REE composition.However,the kerogens from these samples indicated an enrichment in HREEs as compared to their rocks.
The uptake of trace elements by organisms in seawater,and adsorption and complexation with organic matter are the main reasons for redox-sensitive element enrichment in kerogens.The similarities or differences of REE composition between kerogens and shale rocks are mainly due to the origin of the REEs.
AcknowledgementsThis work was fi nancially supported by the National Natural Science Foundation of China(No.41772117),the Strategic Priority Research Program of the Chinese Academy of Sciences(XDA14010103)and the National Petroleum and Gas Projects of China(2017ZX05008002).
杂志排行

Acta Geochimica的其它文章
- The effects of clay minerals and organic matter on nanoscale pores in Lower Paleozoic shale gas reservoirs,Guizhou,China
- Age and geochemistry of Early Ordovician A-type granites in the Northeastern Songnen Block,NE China
- Origin and genetic family of Huhehu oil in the Hailar Basin,northeast China
- Genesis of fahlore in the Tianbaoshan lead–zinc deposit,Sichuan Province,China:a scanning electron microscopy–energy dispersive spectroscopy study
- The morphological characteristics of gully systems and watersheds in Dry-Hot Valley,SW China
- State of rare earth elements in the rare earth deposits of Northwest Guizhou,China