Does bicarbonate affect the nitrate utilization and photosynthesis of Orychophragmus violaceus?
2018-10-25YeLuYanyouWuKaiyanZhang
Ye Lu·Yanyou Wu·Kaiyan Zhang
Abstract The effect of bicarbonateon the growth and development of plants varies by species.To better understand inorganic carbon and nitrogen assimilation changes of karst-adaptable plants under differenttreatments,we conducted experiments on seedlings and in vitro plantlets of Orychophragmus violaceus(Ov).We found that the vital photosynthesis potential(as measured by net photosynthetic rate,actual photochemical ef fi ciency of photosystem-II,photochemical quenching coef fi cient,and the instantaneous carbon isotope ratio of 3-phosphoglycerate)was consistent under differenttreatments of Ov.Bicarbonate’s lack of effect on carbon assimilation of Ov may be related to carbonic anhydrase in Ov convertingto H2O and CO2.In this way,Ov could prevention toxicity and high pH from harming its growth and development under stress.This study also found that highconcentrations could promote nitrogen assimilation and utilization of Ov through changes in related indexes(foliar nitrogen isotope fractionation ratio,stable nitrogen isotope assimilation ratio,foliar stable nitrogen isotope fractionation,nitrate nitrogen utilization ef fi ciency,and nitrate utilization share)under different treatments.Bicarbonate has different effects on photosynthesis and on inorganic nitrogen assimilation of Ov,which may be connected to photosynthesis providing electrons for nitrate/nitrite reduction through the photosynthetic chain.
Keywords Nitrogen assimilation·Photosynthetic capacity· ·Orychophragmus violaceus
1 Introduction
Nitrogen is one of the most important essential nutrients in the growth and development of plants.It is a major component of proteins,nucleic acids,enzymes,and chlorophyll(Raven 2003;George et al.2008;Hawkesford et al.2012).Nitrogen also plays vital roles in improving photosynthesis,maintaining life and growth,and promoting plant yield(Cechin et al.2004).Nitrate and ammonium are the main inorganic nitrogen sources absorbed and used by higher plants.
Itisknownthatinorganicnitrogenassimilationpathways,types and vitalities of key nitrogen assimilation enzymes,and af fi nity transport systems vary by plant species(Crawford 1995;Evans et al.1996;Crawford and Glass 1998;Robinson et al.1998;Campbell 1999;Comstock 2001;KaiserandHuber2001;BrittoandKronzucker2006;George etal.2008).Nitrateisthemaininorganicnitrogensourcethat most plants tend to utilize(Raven 2003;Wang et al.2012)due to its bene fi ts for plant nutrition and physiological regulation.Ammonium salt in certain concentrations is toxic to most plants and can inhibit plant growth(Britto and Kronzucker 2002;Bittsánszky et al.2015).Appropriate types of inorganicnitrogen sources atsuitableconcentration are vital to the growth of plants(George et al.2008).
The stable isotope technique can be used to assess stable nitrogen isotope fractionation of plants,since stable nitrogen isotope composition (δ15N)in plants changes when plants change switch between different nitrogen sources and concentrations(Mariotti et al.1982).The stable isotope technique can also be used to evaluate nitrogen assimilation capacity(Robinson 2001;Kalcsits et al.2014,2015)and to determine inorganic nitrogen utilization preferences of the plants(Kalcsits et al.2015).
Photosynthesis plays an important role in the growth and development of plants.Its capacity can represent the productivity of plants(Chikov 2008),and can also be used to represent plant growth potential.The variation of chlorophyll fl uorescence in photosystem-II complex(PSII)can re fl ect almost all aspects of photosynthetic activity.Actual photochemical ef fi ciency of photosystem-II(ΦPSII)can indicate the tolerance of plants to environmental stress.The photochemical quenching coef fi cient(qP)can demonstrate the share of light energy absorbed by the pigment of the PSII antenna,and can be used to represent electron transfer in photochemical reactions and to denote the openness of the PSII reaction center(Maxwell and Johnson 2000;Panda et al.2008;Chaves et al.2009).The in fl uence of environmental factors on photosynthesis can therefore be estimated by measuring changes to the photosynthetic parameters(net photosynthetic rate(Pn),ΦPSII,qP).
To date,many studies have investigated the in fl uence of environmental factors on plant photosynthesis by measuring the change in foliar carbon isotope composition(δ13C)under different environmental conditions(Pan et al.2016).However,foliar δ13C may be affected by both physiological and environmental conditions as leaves contain many carbon-based substances(cellulose,hemicellulose,lignin,etc.).Meanwhile,considering only when 1,5-ribulose bisphosphate(RuBP)is under the catalysis of ribulose diphosphate carboxylase(Rubisco)and combines with CO2to produce 3-phosphoglycerate(3-PGA),can 3-PGA enter the photosynthetic carbon cycle and become the fi rst stable intermediate of the Calvin cycle(Xia et al.2002;Guo 2014).Thereby,the changes in instantaneous carbon isotope ratio of 3-PGA(δ13CPGA)under different external environmental conditions were determined.
Photosynthesis is closely related to nitrogen metabolism in plants.First,key nitrogen metabolism enzymes such as nitrite reductase(NiR)and glutamine synthetase(GS)are distributed in chloroplasts(Kimata-Ariga and Hase 2014).Second,photosynthesis provides reductants and energy for nitrogen metabolism while the photosynthetic carbon cycle regulates nitrite reduction(Singh et al.2008).Third,light can indirectly affect nitrate reductase(NR)activity by changing the permeability of cell membranes to nitrate(Nemie-Feyissa et al.2013).Therefore,investigating the changes in inorganic nitrogen metabolism and photosynthesis under different environmental conditions is the best way to understand the environmental adaptability of plants.
Different plant species exhibit various levels of adaptation to(Brown et al.1955).The effects of(the most typical anionic component in karst soils)on the growth and development of plants are inconsistent.Some scholars believe that highconcentration has an adverse effect on the growth and development of plants,manifested in the following ways:(1)High-concentrationcan lead to a high-pH environment,hindering normal growth and essential nutrient absorption(Mendel et al.1982;Yang et al.2012).For example,high-concentrationcould result in Fe de fi ciency in barley,sorghum,and corn,resulting from the accumulation of organic acids around roots(Alhendawi et al.1997).(2)High-concentrationcan affect protein synthesis and respiration in plants,inhibiting nutrient absorption and growth and causing adverse symptoms(such as chlorosis)in many plants.For instance,the rootstock of peach[Prunus persica(Batsch)L.]suffers chlorosis when the concentration ofexceeds 6 mM·L-1(Yan et al.2008).(3)High-concentrationcan inhibit the normal growth and development of plants by limiting the expression of genes that control the nutrient absorptive capacity of plants(García et al.2014).(4)High-concentrationcan indirectly lead to physiological drought and inhibit the normal growth and development of plants by increasing the osmotic potential of the soil solution(McCutcheon et al.2005).And(5)high-concentrationcan in fl uence growth and development of plants by producing ion toxicity(Covarrubias and Rombola`2013).However,other studies have indicated that some level ofpromotes plant growth and photosynthesis becausesupports the function and stability of PSII.For example,is an important component of the wateroxygen complex in PSII and is involved in the electron transport process(Klimov and Baranov 2001;Van Rensen 2002;Klimov et al.2003).Some plant species,such asBroussonetia papyrifera(L.),Ov,morning glory,andLonicera japonica Thunb.,could provide inorganic carbon and H2O for photosynthesis by transforminginto CO2and H2O,which may be related to the high CA activity in these plant species(Wu et al.2011;Zhu et al.2013).
Taking into consideration that key enzymes such as NR and GS are distributed in leaves(Crawford 1995;Evans et al.1996;Robinson et al.1998;Kaiser and Huber 2001),we selectedOvto study inorganic nitrogen assimilation and photosynthesis changes of leaves under differenttreatments for 21 days to determine the highconcentration adaptive mechanism of karst-adaptable plants.
2 Materials and methods
2.1 Plant materials and experimental treatments
Ovseeds were germinated in a greenhouse using vermiculite as a culture medium.The arti fi cial greenhouse was maintained under a constant cycle of 12 h per day light intensity of 200 μmol m-2s-2PPFD,and 12 h darkness.The daytime temperature was maintained at 25± 2°C,the nighttime temperature was maintained at 20± 2°C,and the relative humidity was maintained around 50%–60%.After germination,Ovplants were continuously cultured with deionized water for about 45 days,then switched to nitrogen-free Hoagland nutrient solution(Table 1)until plants grew to the four-leaf stage.About 15 days later,Ovseedlings of similar size were selected for experiments.
Treatment 1:Three plants ofOvseedling were randomly selected.All the leaves were cut off,washed,drained,covered with foil,and labeled.The leaf samples were placed in a drying oven at 108°C for 30 min thenimmediately transferred to an oven at 90 °C for 1–2 days.All leaf samples were used to determine initial data.

Table 1 Nitrogen-free Hoagland nutrient solution
Treatment 2:KNO3with 16.99‰ δ15N and NH4Cl with-1.2‰ δ15N were used as nitrate and ammonium nitrogen sources,respectively,with the Hoagland nutrient solution,to create sole-nitrate nutrient solution of 6,14,and 15 mM·L-1nitrate and sole-ammonium nutrient solution of 1 mM·L-1ammonium.Then,the same quantity ofOvseedlings were randomly selected and planted in these solutions for about 21 days(two or three replicates per treatment).The leaf samples were then subjected to the same methods used for Treatment 1.All leaf samples were tested to obtain the fi nal data.
Treatment 3:To investigate the effect ofon the photosynthesis ofOv,the following steps were taken.First,Hoagland nutrient solution was made using KNO3with 16.99‰ δ15N and NH4Cl with-1.2‰ δ15N.Then,different concentrations of(0 and 10 mM·L-1)were added to approximate theconcentration of soil in karst areas of Southwest China(Yan et al.2012).Next,leaves with similar position,orientation,and size were selected and labeled according toconcentration.After 21 days,the photosynthetic indices,chlorophyll fl uorescence parameters,and δ13CPGAof these labeled leaf samples were tested(two or three replicates per treatment).
2.2 Data determination
2.2.1 Determination of net photosynthetic rate and chlorophyll fl uorescence parameters
Pn and chlorophyll fl uorescence parameters(actual ΦPSII and qP)ofOv,cultured in Hoagland nutrient solution under differenttreatments(0 and 10 mM·L-1)for 21 days were measured by Li-6400(three replicates per treatment).
2.2.2 Determination of instantaneous carbon isotope ratio in 3-PGA(δ13CPGA)
The related δ13CPGAofOvleaf was obtained by mass spectrometer MAT-252(three replicates per treatment),after the corresponding 3-PGA ofOvleaf was isolated and puri fi ed by the chromatographic method(Christeller et al.1976).
2.2.3 Determination of nitrogen content(N)and stable nitrogen isotope ratio(δ15N)
The leaves ofOvseedling before and after cultivation in Hoagland nutrient solution,in sole-nitrate nutrient solution,and in sole-ammonium nutrient solution under differenttreatments(0 and 10 mM·L-1)for 21 days were dried and ground.Then,the corresponding N and δ15N(15N/14N)values of these leaf samples were determined using an elemental analyzer(Vario MACRO cube,Germany)and a gas isotope mass spectrometer(MAT-253,Germany)(triplicate measurements).The data correction method of MAT-253 is consistent with the Yous fiet al.(2013)method with a precision control of around 0.2‰.
2.2.4 Determination of foliar nitrogen isotope fractionation(δ15Nnew)and stable nitrogen isotope fractionation(Δ15N)
The dried leaves ofOvseedling were weighed and ground,one-by-one;the corresponding N and15N/14N values of these milled leaf samples were determined using an elemental analyzer(Vario MACRO cube,Germany)and isotope mass spectrometry(MAT-253,Germany).The corresponding δ15Nnewwas calculated according to Eqs.(1)and(2):

whereLDW0represents LDW in wholeOvplants before testing;N0represents the foliar N ofOvbefore testing;δ15N0represents the foliar nitrogen isotope fractionation ratio ofOvbefore testing;LDW1denotes the LDW in wholeOvplants,cultured in sole-nitrate nutrition solution with 15 mM·L-1nitrate under HCO3-treatment(10 mM·L-1)for 21 days; δ15N1is the foliar nitrogen isotope fractionation ratio ofOvcultured in different solutions undertreatment(10 mM·L-1)for 21 days;andfrepresents the share of initial foliar N as a share of the fi nal foliar N ofOv.
It is dif fi cult to differentiate nitrate and ammonium nitrogen sources having the same nitrogen isotope ratio through preliminary study.Therefore,our preliminary foliar nitrogen isotope fractionation ratio ofOvin vitro plantlets in sole-nitrate culture medium(δ15N of nitrate source is 8.08‰)with 10,20,40,80,and 120 mM·L-1nitrate(Table 2)were converted to ‘‘new’’results under the nitrate nitrogen source with 16.99‰ δ15N,using the principle that the stable nitrogen isotope assimilation ratio(NS)is constant.

Table 2 The foliar δ15N of Ov in vitro plantlets in sole-nitrate culture medium with different nitrate concentrations for 21 days(δ15N of nitrate source is 8.08‰)
The foliar stable nitrogen isotope fractionation(Δ15N)ofOvwas calculated using Eq.(3)(Evans et al.1996):

where δ15Nproductis equivalent to δ15Nnewin Eq.(1)and
2.2.5 Determination of stable nitrogen isotope assimilation ratio(NS)
The foliar NS ofOvwas calculated according to the formula:

where δ15Nnewrepresents the foliar nitrogen isotope fractionation ofOvunder differenttreatments,and δ15Nsubstratedenotes the nitrogen isotope fractionation of the nitrate nitrogen source.
2.2.6 Determination of nitrate nitrogen utilization ef fi ciency(NUE)
NS represents plant nitrate assimilation capacity under different concentrations of substrate nitrate.The NS ofOvwas calculated through the following steps.
First,the model for the relationship between NS and sole-nitrate concentration of nutrient solution(C)was established,based on the Michaelis–Menten equation:

in which the principle is that the relationship between NS and C is similar to the relationship between enzyme activity and substrate concentration(S)in enzymatic reactions.
The model for the relationship between NS and C was represented as:

where NSmax-Cand Kmare Michaelis equation constants.
Second,the corresponding NS calculation equations were derived according to the Lineweaver–Burk double reciprocal mapping method.
Third,the corresponding estimated values of NS(NSE)were calculated,based on the corresponding NS value calculations.
Meanwhile,nitrate utilization ef fi ciency(NUE)represents the change rate of plant nitrate assimilation capacity with nitrate concentration.NUE ofOvleaves was calculated as:

2.2.7 Determination of nitrate utilization share(fA)
The inorganic nitrogen utilization preference ofOvwas judged by nitrate and ammonium nitrogen utility share undertreatments(0 and 10 mM·L-1).The corresponding values ofOvwere calculated for differenttreatments,in terms of the two end-member mixing model:

where δTrepresents the foliar stable nitrogen isotope ofOv,cultured in mixed nitrogen sources(e.g.,Hoagland nutrient solution)underdifferenttreatments(0 and 10 mM·L-1)for21 days; δArepresents the foliar stable nitrogen isotope ofOv,cultured in sole-nitrate nutrition solution with 14 mM·L-1nitrate under differenttreatments(0 and 10 mM·L-1)for 21 days; δBrepresents the foliar stable nitrogen isotope ofOv,cultured in sole-ammonium nutrition solution with 1 mM·L-1ammonium under differenttreatments(0 and 10 mM·L-1);fAdenotes the nitrate nitrogen utility share ofOv;andfBdenotes the ammonium nitrogen utility share ofOv(fB=1-fA).
2.3 Statistical analysis
The statistical data were processed in MS-Excel®and the signi fi cance of differences between paired data was analyzed using SPSS.Data are expressed as mean±standard error(SE).Values signed with the same letter are not signi fi cantly different.
3 Results
3.1 The effect ofon photosynthesis of Ov
The Pn,ΦPSII,qP,and δ13CPGAvalues ofOv,cultured in Hoagland nutrient solution under differenttreatments(0 and 10 mM·L-1)for 21 days showed no signi ficant differences(Figs.1,2).
3.2 The effect of on theand Δ15N of Ov
The LDW ofOvin sole-nitrate solution with 15 mM·L-1nitrate under 10 mM·L-1treatment for 21 days was 14.67 times the value before testing.The leaf grew rapidly even in 10 mM·L-1conditions.With the increase of nitrate concentration in sole-nitrate nutrient solution,the foliar N ofOvseedling increased(Table 3).
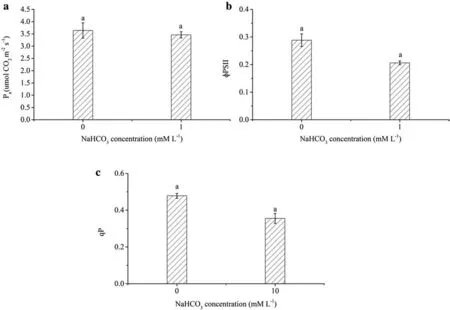
Fig.1 The effect of on the main photosynthetic parameters.a Pn;b ΦPSII;and c qP—of Ov in Hoagland nutrient solution for 21 days.Note:Each value represents the mean±SE(n=3).Values signed with the same letter are not signi fi cantly different as evinced by the use of the independent-samples t test(p>0.01)

Fig.2 The effect ofon δ13CPGAof Ov leaf in Hoagland nutrient solution for 21 days.Note:Each value represents the mean±SE(n=3).Values signed with the same letter are not signi fi cantly different as evinced by the use of the independentsamples t-test(p>0.01)
The corresponding relationship equations of 1/[C]and 1/NS under differenttreatments were obtained using the related foliar δ15NnewofOvseedlings.The foliar δ15Nnewwas obtained by substituting the corresponding LDW,foliar N,and δ15N ofOvseedlings before and after culture in sole-nitrate nutrient solution with 6,14,and 15 mM·L-1nitrate under 10 mM·L-1treatment for 21 days(Table 3)into Eqs.(1)and(2),and by the ‘‘new’’results ofOvin vitro plantlets.The ‘‘new’’results ofOvin vitro plantlets were converted from Table 2.The correspondingrelationshipsbetween1/[C](X)and1/NS(y)under differenttreatments were expressed as:y=treatment,and y=1.1851X+1.0308 R2=0.9924under 10 mM·L-1treatment.Thus,the corresponding NS ofOvleaves under differenttreatment were derived according to Eqs.(9)and(10),respectively:
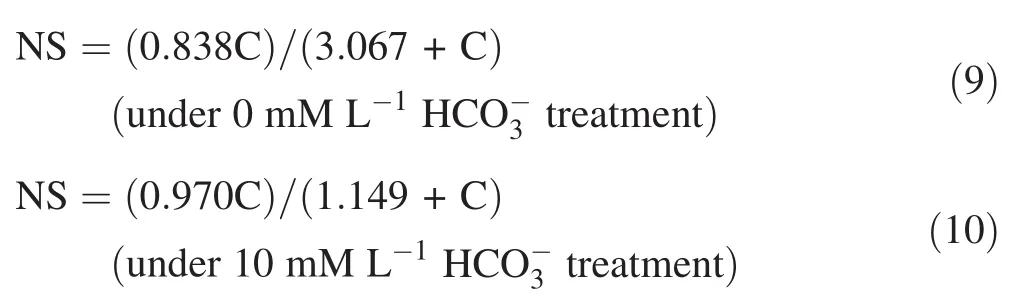
where C represents the nitrate concentration in the solenitrate solution.
The corresponding estimated values of δ15Nnewin the sole-nitrate solution with various nitrate concentrations under differenttreatments were obtained,according to Eqs.(9)and(10).The corresponding Δ15N values were derived according to Eq.(3)(Table 4).
Table 3 The corresponding LDW,N,and δ15N of Ov seedlings leaf before and after cultured in sole-nitrate solution with different nitrate concentrations undertreatment(10 mM·L-1)for 21 days

Table 3 The corresponding LDW,N,and δ15N of Ov seedlings leaf before and after cultured in sole-nitrate solution with different nitrate concentrations undertreatment(10 mM·L-1)for 21 days
–Represents no measure and each value stands for the mean±SE(n=3)
Treatment(mM·L-1) LDW(g) N(%) δ15N(‰)Before Experiment 0.006±0.002 3.986±0.559 -11.47±0.89 6–4.549±0.300 12.26±1.84 14 – 4.674±0.303 13.69±0.83 15 0.088±0.009 4.791±0.261 13.65±0.10
Measured δ15Nnewand estimated δ15Nnew(δ15Nnew-E)ofOvin vitro plantlets cultured in sole-nitrate solution with 10 mM·L-1nitrate for 21 days under notreatment were 11.00± 0.59‰ and 10.89‰,respectively(Table 4).Measured δ15Nnewand estimated δ15Nnew(δ15Nnew-E)ofOvseedlings cultured in sole-nitrate solution with 15 mM·L-1nitrate for 21 days under 10 mM·L-1treatment were 15.23± 0.05‰ and 15.29‰,respectively.The similarity between measured foliar δ15NnewofOvand corresponding estimated values(δ15Nnew-E)suggests that corresponding δ15Nnew-Echanges can be used to evaluate the effect of HCO3-on foliarOvδ15N-new.Meanwhile,foliar δ15Nnew-EofOvincreased with nitrate concentration.However,foliar Δ15N ofOvdecreased with nitrate concentration.
3.3 The effect ofon stable nitrogen isotope assimilation ratio of Ov
Due to the small difference between measured NS and evaluated NS(NSE)(the relative error was less than 3.80%),the effect ofon the NS ofOvin solenitrate nutrient solution with different nitrate concentrations undertreatments(0 and 10 mM·L-1)was evaluated by NSEchanges(Table 5).The corresponding measured NS and NSEwere calculated using Eqs.(4),(9),and(10).
NSEincreased with nitrate concentration(Table 5).This indicates that nitrate could promoteOvnitrate NUE.Meanwhile,the NSEofOvunder 10 mM·L-1treatment was higher than under 0 mM·L-1treatment in the same solution(e.g.,the NSEofOvin solenitrate nutrient solution with 6 mM·L-1nitrate under 10 and 0 mM·L-1treatments were 0.814 and 0.555,respectively;the NSEofOvin sole-nitrate nutrient solution with 120 mM·L-1nitrate under 10 and 0 mM·L-1treatments were 0.961 and 0.817,respectively).
3.4 The effect of on nitrogen use ef fi ciency of Ov
According to the equations for nitrogen use ef fi ciency under 0 mM·L-1treatment:

and under 10 mM·L-1treatment Eq.(12),

the estimated NUE values(NUEE)ofOvunder differenttreatments were obtained(Table 6).
It can be seen from Table 6 that the NUEEdecreased with increased nitrate.This indicates thathas anadverse effect on the NUE ofOv.For instance,NUEEofOvunder 10 mM·L-1treatment in sole-nitrate nutrient solution for 21 days was smaller than under 0 mM·L-1treatment.
Table 4 The corresponding δ15Nnew,δ15N-newE,and Δ15N of Ov leaf in sole-nitrate solution with different nitrate concentrations under differenttreatments for 21 days

Table 4 The corresponding δ15Nnew,δ15N-newE,and Δ15N of Ov leaf in sole-nitrate solution with different nitrate concentrations under differenttreatments for 21 days
–Represents no measure and each value stands for the mean±SE(n=3)
?
Table 5 The corresponding NS and NSEof Ov seedlings(plantlets)cultured in sole-nitrate nutrient solution with different nitrate concentrations under treatments for 21 days

Table 5 The corresponding NS and NSEof Ov seedlings(plantlets)cultured in sole-nitrate nutrient solution with different nitrate concentrations under treatments for 21 days
–Represents no measure and each value stands for the mean±SE(n=3)
- =10 mM·L-1 NS NSE Relative Error(%) NS NSE Relative Error(%)6–0.555 – 0.814±0.063 0.814 0.000 10 0.647±0.035 0.641 0.927 – 0.870 –14 – 0.687 – 0.902±0.048 0.896 0.665 15 – 0.696 – 0.896±0.003 0.900 0.446 20 0.719±0.031 0.727 1.113 – 0.917 –40 0.754±0.071 0.778 3.183 – 0.943 –80 0.778±0.071 0.807 3.728 – 0.956 –120 0.846±0.082 0.817 3.429 – 0.961 –Treatment(mM·L-1) CHCO3- =0 mM·L-1 CHCO3
Table 6 The NUEEof Ov in sole-nitrate nutrient solution with different nitrate concentrations under different treatments for 21 days

Table 6 The NUEEof Ov in sole-nitrate nutrient solution with different nitrate concentrations under different treatments for 21 days
Treatment(mM·L-1) CHCO3- =10 mM·L-1 NUEE NUEE 6 0.0313 0.02182 10 0.0151 0.00897 14 0.0088 0.00486 15 0.0079 0.00428 20 0.0048 0.00249 40 0.0014 0.00066 80 0.0004 0.00017 120 0.0002 0.000076- =0 mM·L-1 CHCO3
3.5 The effect of Hon nitrate utilization share(fA)of Ov
Table 7 The corresponding nitrate utilisation share(fA)and ammonium utilisation share(fB)of Ov under differenttreatments for 21 days
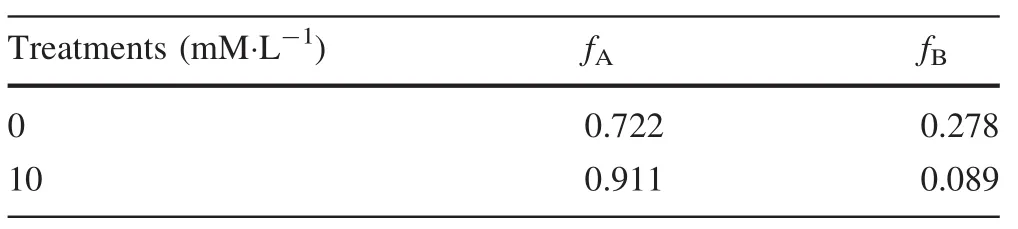
Table 7 The corresponding nitrate utilisation share(fA)and ammonium utilisation share(fB)of Ov under differenttreatments for 21 days
Treatments(mM·L-1) fA fB 0 0.722 0.278 10 0.911 0.089
4 Discussion
Plant stomata may close and initial ribulose-1,5-diphosphate carboxylase activity decrease as soon as external conditions inhibit the normal growth and development of plants(Jia et al.2000;Sun et al.2004).Adverse environmental conditions can also damage the photosynthetic organs,reducing mesophyll cell photosynthetic activity(Gilmore and Yamamoto 1991)and photosynthesis rate of plants.However,our study found that Pn,ΦPSII,qP,and δ13CPGAofOvunder differenttreatments for 21 days exhibited no signi fi cant difference,indicating thathas no effect on the photosynthetic system or on the rate of photosynthesis inOv.In addition,these results suggest that the opening of the PSII reaction center,the fl uorescence yields of the PSII reaction center,and the process of photosynthesis inOv,are not affected by

Fig.3 The promoting mechanism of on inorganic nitrogen process in chloroplast
Our study results are consistent with Brown et al.’s(1955)conclusion that the effect ofon the growth and development of plants is dependent on theadaptability of the plant species.Meanwhile,our study con fi rmed the conclusion thatOvcan grow and develop normally in karst areas even with surface waterconcentrations as high as 5 mM·L-1(Wu et al.2004;Yan et al.2012).
Based on the negative correlation between Δ15N with nitrogen assimilation,and the positive correlation of NS with nitrate metabolism of plants(Pate et al.1993;Kalcsits et al.2013),our study results indicate thatexerts promotional effects on inorganic nitrogen assimilation ofOv.
NR and NiR are vital enzymes in nitrogen assimilation.The activity of NR or NiR can affect plant nitrogen assimilation capacity(Pate et al.1993;Kalcsits et al.2013).Our study found thatOv’s strong nitrogen assimilation capacity under 10 mM·L-1may be related to the activating effect ofon NR or NiR activity.
Our study further found thatexerts a promotional effect on inorganic nitrogen assimilation but has no in fl uence on the inorganic carbon metabolism ofOv.This opposite effect ofon inorganic nitrogen and inorganic carbon metabolism may con fi rm that the close relationship between photosynthesis and inorganic nitrogen metabolism is due to photosynthesis providing the necessary electron sources for nitrate and nitrite reduction through the photosynthetic chain.Speci fi cally,the nitrate and nitrite reduction capacity may strengthen NR or NiR activity and the number of electrons provided for nitrate and nitrite reduction increase rapidly as long as certain HCO3-levels exist(Fig.3).
AcknowledgementsThis work was supported by the National Key Research and development Program of China(2016YFC0502602),the National Natural Science Foundation of China(U1612441),and the project of high-level innovative talents of Guizhou Province[2015(4035)].
Compliance with ethical standards
Con fl ict of interestThe authors declare that they have no con fl ict of interest.
杂志排行

Acta Geochimica的其它文章
- The effects of clay minerals and organic matter on nanoscale pores in Lower Paleozoic shale gas reservoirs,Guizhou,China
- Age and geochemistry of Early Ordovician A-type granites in the Northeastern Songnen Block,NE China
- Origin and genetic family of Huhehu oil in the Hailar Basin,northeast China
- Genesis of fahlore in the Tianbaoshan lead–zinc deposit,Sichuan Province,China:a scanning electron microscopy–energy dispersive spectroscopy study
- The morphological characteristics of gully systems and watersheds in Dry-Hot Valley,SW China
- State of rare earth elements in the rare earth deposits of Northwest Guizhou,China