Turbulent characteristics and rotation correction of wall function in rotating channel with high local rotation parameter
2018-10-15ZhiTAOHuijieWURuquanYOUHaiwangLIKuanWEI
Zhi TAO,Huijie WU,Ruquan YOU,Haiwang LI,*,Kuan WEI
aNational Key Laboratory of Science and Technology on Aero-Engine Aero-Thermodynamics,Beihang University,Beijing 100083,China
bCollaborative Innovation Center for Advanced Aero-Engine,Beihang University,Beijing 100083,China
KEYWORDS Coriolis force;Entry section;Relaminarization;Rotating channel;Turbulence
Abstract The turbulent fluctuation and the rotation correction of wall function law are investigated in the entrance section of a rotating channel.The one-dimensional hot wire probe and the X-type probe are utilized to measure the boundary layer at four streamwise stations.Through the analysis on the boundary layer near the leading side and trailing side,it is found that the turbulent fluctuation is promoted in the trailing side whereas suppressed in the leading side.This difference is attributed to the Coriolis instability near the trailing side.In addition,considering the local rotation parameter Rc,whose maximum absolute value is 0.014,is larger than that in previous research,whose maximum value is 0.007,the whole process of the relaminarization is captured.To understand this phenomenon better,the effects of the generation term and the Coriolis term in the transport equation of the Reynolds stress are discussed.In addition,the rotation correction of the viscous-Coriolis region and the Coriolis region are discussed,a new revising method for the wall function is proposed.
1.Introduction
As we all know,the turbine blades are operated in the high temperature environment to improve the thermal efficiency of modern gas turbine engine.Although the melting point of the turbine blade material increases year by year,this extremely high temperature is far beyond the material’s tolerance.Accordingly,lots of cooling techniques are applied to protect the turbine blade from the hot gases.Internal cooling technique is one of the most prevalent methods used to protect the turbine blade.For instance,serpentine passage,as an effective method,was developed in the middle section of a turbine blade.1,2To improve the performance of serpentine passages,most of the previous researches focused on the heat transfer instead of the flow behavior in the serpentine passages.However,without knowledge about the flow behavior under rotating condition and the interaction between heat transfer and fluid flow,the principle behind the heat transfer phenomenon may not be understood comprehensively.Therefore,some researchers investigated the flow behavior in rotating ducts.These researches can be divided into five branches:the effects of rotation on the primary velocity profiles in a straight channel without ribs;3–5the effects of rotation on the secondary flow fields in a straight channel without ribs;6–8the effects of rotation on the turbulent fluctuation;9,10the effects of rotation on the flow fields in a channel with complex geometry,such as U turn and ribs;11–15the effects of rotation on the flow fields in a channel with heated walls.16–18Nevertheless,some important issues are not understood clearly,such as the rotation correction of the wall function and the relaminarization process discovered in the analysis of the turbulent fluctuation.Considering both turbulent fluctuation and the rotation correction of the wall function have relationship with the primary velocity profiles,the present work also investigates the primary flow in a smooth rotating duct.Therefore,the rotation correction of the wall function and the turbulent fluctuation are the main concern of the present paper.
Koyama et al.19measured the primary velocity profiles on the mid-span of the duct with aspect ratio equaling 7.A universal rotation correction of the log law formula is obtained after the analysis of the primary flow of the turbulent boundary layer.There are two correction methods of the standard log law formula.The first one only changes the empirical coefficients of the log law formula without changing the basic form,the second one adds an additional term to the basic form of the standard log law formula.
Watmuff et al.3measured the primary flow on the mid-span of the duct with aspect ratio equaling 4.After analyzing primary velocity profile at different regions of the turbulent boundary layer,the viscous region is not influenced by rotation,whereas the logarithmic region needs rotation correction.They only changed the empirical coefficients of the log law formula instead of changing the basic form of log law.
Nakabayashi and Kitoh4measured the fully developed flow of a straight rotating duct with aspect ratio equaling 8.They mainly focused on the effects of rotation on the flow under low Reynolds number.Using y/L,L/δν,δν/δcas dimensionless parameters,they divided the turbulent boundary layer into several regions:viscous region,buffer region,logarithmic region,Coriolis region and core region.Here,y means the normal distance from the wall,δν(δν= ν/Uτ)means the viscous length scale,Uτmeans the friction velocity,ν is the kinematic viscosity coefficient,δc(δc=Uτ/|Ω|)means the Coriolis length scale and L refers to the channel half-width,Ω means the angular velocity of the rotating duct.In the process of the rotation correction of the log law formula,they changed the empirical coefficients of the log law formula instead of changing the basic log law form as rotation correction.However,the expression of the intercept C,namely the intercept of the log law formula,is so complicated,influenced not only by Ων/U2τ,but also by Reynolds number,that its correction formula is not given.
Nickels and Joubert20obtained the basic form of log law formula with rotation correction through dimensional analysis.The corrected formula is valid for different streamwise pressure gradients and the intensities of secondary flow.
Apart from the rotation correction of the wall function,the turbulent fluctuation is also important,because the rotation correction of the wall function law has much relationship with the turbulent fluctuation.For example,by contrasting the turbulent fluctuation in the leading side and the trailing side,we can see whether the so-called relaminarization occurs,which is adverse to the rotation correction of the wall function.Besides,the turbulent fluctuation profiles,rather than the mean primary profiles,are used to judge the penetration of the Coriolis force,10which is essential for the division of the turbulent boundary layer under rotating conditions,thus influencing the rotation correction of the wall function.Therefore,it is necessary to pay attention to the turbulent fluctuation.
Koyama et al.19measured the fluctuation of the turbulent boundary layer at a fixed streamwise location in the rotating straight duct with aspect ratio equaling 7.The experiment results show that the transition of the boundary layer near the leading side is found to be suppressed,while promoted on the trailing side.
Watmuff et al.3measured the distribution of all components of the Reynolds stress of the turbulent boundary layer in the mid-span of the rotating straight duct with aspect ratio equaling 4.The experimental results suggest that the component of Reynolds stress is affected by the rotation only outside the viscous region.〈uv〉(u means the streamwise fluctuating velocity,v means the normal fluctuating velocity)remains to be nearly constant in the logarithmic region,though affected by the rotation.They also analyzed the streamwise energy spectrum at the same dimensionless distance under different rotating conditions.The results show that only low wavenumber spectrum is affected by the rotation.
Macfarlane and Joubert21investigated the distribution of all components of the Reynolds stress of the turbulent boundary layer in the mid-span of the rotating straight duct with aspect ratio equaling to 4,2,1,respectively.The results show that the Reynolds stress is affected by rotation when y+>10,which is different from the mean primary velocity profile that is not influenced by rotation until y+>40.They investigated the influence of the secondary flow on the Reynolds stress by changing aspect ratio.It turns out that the distribution of the Reynolds stress at downstream locations of the ducts with aspect ratio equaling 4 is almost the same with that at downstream locations of the duct with aspect ratio equaling 2,whereas obviously different from that at downstream locations of the duct with aspect ratio equaling 1.
Macfarlane et al.8also investigated the interaction between the secondary flow and the turbulent fluctuation of the turbulent boundary layer in the rotating straight duct with aspect ratio equaling 4,2,1,respectively.They contrasted the streamwise energy spectra at a certain location of the boundary layer in the ducts with different aspect ratios.Spectral results for aspect ratio equaling 2 show almost no variation at the high wavenumber,whereas spectra results for aspect ratio equaling 1 show that the whole spectrum shift towards low wavenumber on the trailing side and high wavenumber on the leading side.
Nakabayashi and Kitoh10measured the distribution of the parameters of turbulent flow in the mid-span of rotating channel with aspect ratio equaling 8.Using dimensional analysis,they divided the turbulent boundary layer near the wall into several regions such as viscous region,buffer region,Coriolis region,etc.And they find the ranges of these regions are functions of Re′(Re′=UL/ν)and|Ω|ν/.Here,U means the primary velocity.Through measuring 〈uv〉 and performing quadrant analysis,they found the strong ejection which occurs periodically on the trailing side even though the ejection frequency is low.In the energy spectrum of the turbulent fluctuation,a rise in the spectrum is seen in the corresponding ejection frequency.In this way,it is demonstrated that the increase of the ejection is responsible for the increase of 〈 uv〉near the trailing side.
In a word,the researches mentioned above have concerned the fundamental issues such as the rotation correction of the wall function law and the turbulent fluctuation,but those researches present some limitations.For example,the local rotation parameteris low in the researches above,the maximum value of which is 0.007.Low local rotation parameter often narrows down the applicable range of the revised wall function law and limits the occurrence of new phenomena of turbulent fluctuation,such as the relaminarization.In addition,the researches mentioned above focuses on the rotation correction of logarithmic region,but the intercept of the revised log law cannot be obtained,thus the log law corrected by rotation is of no use.
Thus,the authors investigate the turbulent flow in the entrance section of the straight duct without ribs under rotating conditions.The present work focuses on the turbulent fluctuation to reveal some new phenomena because of the high local rotation parameter,such as the relaminarization process,which is adverse for us to correct the wall function near the leading side.Besides,the previous work only focuses on rotation correction on the log law region,which would result in a problem that the rotation correction of the intercept C cannot be obtained.Thus,after figuring out that there is no relaminarization,a new method to correct the wall function of the whole inner layer of the turbulent boundary layer is developed.
2.Apparatus,techniques and experimental conditions
2.1.Rotating facility and test section
The experimental apparatus and methods utilized are the same with the ones in Wei et al.22The channel geometry and coordinate system are presented in Fig.1.In Fig.1,there are tripping wires attached both on the trailing side and leading side,which are 70 mm from the inlet of the channel.The measuring stations are the same with those in Wei et al.,22but the flow is measured by the X-type probe,which can obtain the twodimensional flow.It is different from that in Wei et al.,22which only obtain one-dimensional flow.
2.2.Hotwire technique
2.2.1.X-type hot wire
The two-dimensional flow field is measured with the X-type hot wire anemometer,the Dantec 55P61 probe.But this hot wire is unable to measure the two-dimensional flows near the wall,owing to its structure.Considering there is no twodimensional boundary layer probe,the authors have to change the support of the Dantec 55H25.To change the support of the two-dimensional probe,three requirements need to be guaranteed.First,the support of the probe is located behind the probe when measuring the velocity,so as to minimize the influence of the support on the flow;second,the change of the support has to be made to guarantee that the sensing element of the probe can be as close to the wall as possible,so as to measure the viscous region of the boundary layer;third,the direction of the incoming flow direction must be within the acceptance angle of the probe.To satisfy the three requirements,the authors add a long support with a turning angle equaling 93°to the short support of the Dantec 55H25,which is shown in Fig.2.The measuring locations of the twodimensional hot wire are the same with the one-dimensional hot wire.
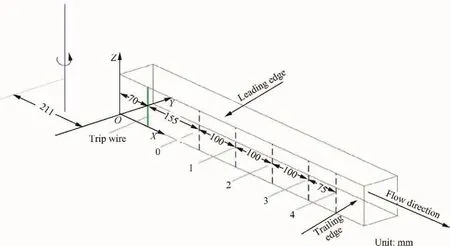
Fig.1 Channel geometry and coordinate system.
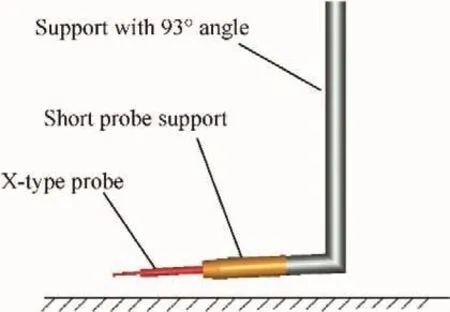
Fig.2 Installation structure of changed X-type hot wire.
In addition,the measurement of the wall shear stress,the distance from the hotwire to the wall for the one dimensional hot wire and the measurement of the wall shear stress for X-type probe are presented by Wei et al.22As for the distance from the X-type hot wire to the wall,the velocity measured by the X-type probe is interpolated to the velocity profile measured by the one-dimensional hot wire at each station,then the distance from the X-type probe to the wall and the wall shear stress τwis obtained at the same time.Finally,the friction velocity is obtained through the equationHere,ρ means the density of the gas.
2.2.2.Calibration of X-type hot wire
For the X-type hot wire,the calibrating process is more complicated than the one-dimensional process.The absolute value of the velocity and the flow angle should be obtained at the same time from the voltages measured by the X-type probe.To do this,the X-type should be installed on a device,through which the angle of the X-type probe can be changed,as shown in Fig.3.
The calibrating curve of the X-type hot wire is presented in Fig.4,the abscissa and the ordinate represent the voltage obtained by the two probes of the X-type hot wire.Different calibrating curve corresponds to different flow angle θ,and different point in the same curve corresponds to different velocity.
Look-up matrix method is utilized to process the voltage through the calibrating curve listed in Fig.4.Then the relationship between Ut–θ coordinate system(Utis the absolute value of total velocity)and E1–E2coordinate system is obtained.In this way,the velocity and the flow angle can be obtained through the voltage E1,E2acquired by the X-type probe respectively.The concrete process of the look-up process is presented by Lueptow et al.23
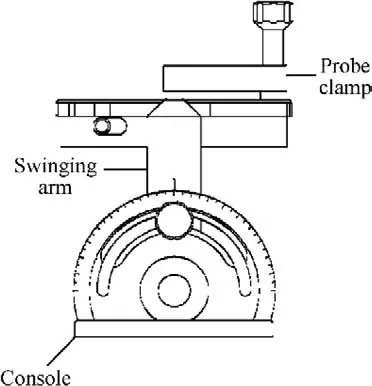
Fig.3 Holder of X-type hot wire.
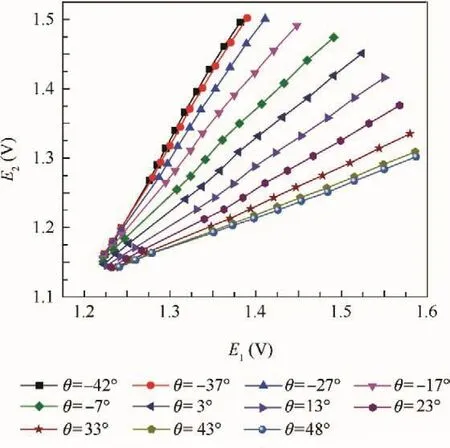
Fig.4 Calibrating curves of X-type hot wire.
2.3.Experimental conditions
The governing parameters for the boundary layer in the rotating channel of this paper are Reynolds number Re(Re=UD/ν)(D is the hydraulic diameter of the rotating channel)and rotation number Ro(Ro=ΩD/U).The local Reynolds number Reδ(Reδ=Uτδ/ν), δ is the boundary layer thickness and the local rotation parameter Rc are useful in the boundary layer analysis.The running parameters are presented in Table 1.Since the high Reynolds number will make the boundary layer so thin that we cannot measure the velocity within the boundary layer;whereas there is no logarithmic law within the boundary layer when the Reynolds number are small.Thus,we take Reynolds number equal 19000.
In the first column of Table 1,the number 1,2,3,4 are the streamwise stations in the channel,and the number 30,60,90,120,150 are the rotating speed Ω,whose unit is r/min.The letter ‘‘T”refers to the trailing side whereas the letter ‘‘L” means the leading side.The word ‘‘stationary” means the rotating channel does not rotate.
2.4.Discussion of uncertainties
For any experiment,errors are inevitable in all components of the measurement system.For the X-type probe,the primary velocity measured by the X-type probe is obtained not through transforming the measured voltage into the velocity directly,but through the look-up table,23which firstly transforms the voltage into Utand θ, then utilizes the formula U=Utcosθ,V=Utsinθ to obtain the primary velocity and normal velocity.Therefore,the measurement errors of the velocity using X-type probe come from not only the calibration process and the variation of the temperature,but also the interpolation error and fitting error of look-up table.After the temperature correction,the calibration error and the error caused by the temperature variation only influence the absolute value of Ut.The fitting error and the interpolation error of the look-up table influence the value of Utand the angle of the flow direction.According to the error analysis of theone-dimensional hot wire,the sum of the calibration error and the error caused by the temperature variation is approximately±2%±0.02 m/s,both of which only influence the value of Ut.Look-up table includes two fitting processes and one interpolation process,and the error of E1and E2in the fitting process and interpolation process is approximate±0.00365 V.After the calculation of θ ( E1,E2)and Ut(E1,E2),it is found that the absolute error of θ is ±0.3°and the relative error of Utis±2%.In a word,the maximum relative error of Utis±4% ± 0.02 m/s,whereas,the maximum relative error of θ is±0.3°.In the present work,the range of Utis 1.3-3.6 m/s,whereas,the range of θ is-7.5°to 2.3°.Considering θ may equal 0,which may lead the relative error of normal velocity approaches to in finite,the authors only calculate the absolute error of the parameters related to V.Through calculation,the relative error of U measured by X-type probe is 5.8%,whereas,the absolute value of V is 0.006-0.019 m/s.

Table 1 Experimental conditions.
The third important parameter is the friction velocity Uτ,the uncertainty of which is also discussed by Wei et al.22
The fourth parameter is U+(U+=U/Uτ).According to the error propagation formula,
According to the Wei et al.22

Thus,the relative uncertainty of the friction velocity is obtained:

2.5.Verification of techniques
It is necessary to conduct the verification of the techniques before the measurement in the present work.
For the X-type probe,the measurements are conducted at Station 3,with Re=19000 and Ro=0.The mean velocity profile measured by X-type probe and the standard log law

are presented in Fig.5.
According to the uncertainty analysis of U+,the minimum relative uncertainty is 11%.It can be seen in Fig.5 that the velocity profile measured in the present work almost overlaps with the standard logarithmic law,except for some slight difference.And the small difference can be explained as follows:first,there is some inevitable errors in the measurement of the wall shear stress;second,the standard log law is obtained in the duct with zero pressure gradient,whereas,the present work is performed in the duct which has a slightly positive pressure gradient.
3.Results and Discussion
3.1.Inlet conditions
The turbulent intensity is discussed in the entrance section of a rotating channel flow;thus,the inlet conditions is very crucial,as presented in our previous paper.24
3.2.Distribution of turbulent intensities

Fig.5 Distribution of U+at Station 3.
In our previous paper we investigated the distribution of themeasured by the hot wire anemometer,through the contrast of those between trailing side and leading side.It was found that the Coriolis force can suppress the turbulent fluctuation in the leading side,which is named the relaminarization process by Koyama et al.19When relaminarization process occurs,the value of the peak of the turbulent intensity decreases and the location of that moves away from the wall,which is in good agreement with the experimental result of Kim et al.25In addition,with the help of X-type probe,more details of turbulent intensities are listed in the present work.Although it has been found by Koyama19and Nakabayashi10et al.,the local rotation parameter Rc equals-0.007(i.e.the maximum absolute value of the Rc number in previous work),which is smaller than that in the present work,the maximum value of which is 0.0136.Thus the process of relaminarization in the leading side is captured,as is conveyed in Section 3.3.
Because the X-type probe can measure U and V,〈uu〉/measured in the present work is the real 〈uu〉/Whereas,themeasured by Wei et al.22refers toIn addition,some differences can be seen in contrast with 〈 uu〉/in the leading side of present work and that of Wei et al.When y+equals about 100,the 〈 uu〉/in the leading side measured by Wei et al.is larger than that measured by the present work.This is becausemeasured by Wei et al. refers towhereasin Fig.6 refers to the true 〈 uu〉/Thus,it can be concluded that〈vv〉/is responsible for the difference of 〈 uu〉/measured by Wei et al.and the present work.The variation of 〈 vv〉/with streamwise location and rotation number is presented in Fig.7.It can be seen in Fig.7 that 〈 vv〉/also has the attenuation trend in the leading side,like〈 uu 〉/Because the relative error of 〈vv〉/is larger than that of 〈uu〉/the distribution of 〈 vv〉/is more scattered than that of 〈 uu〉/

Fig.6 Variation of 〈uu〉/with streamwise location and rotation number.
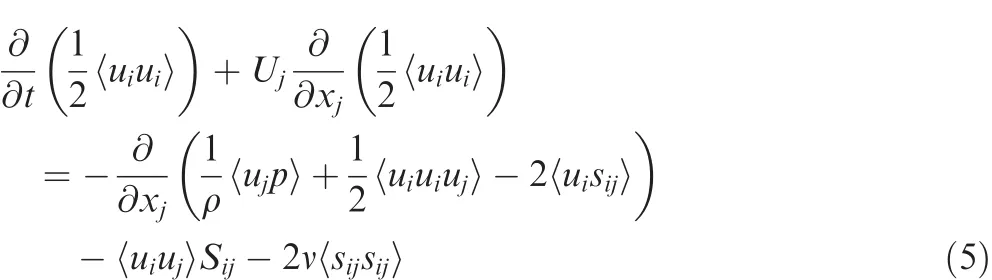
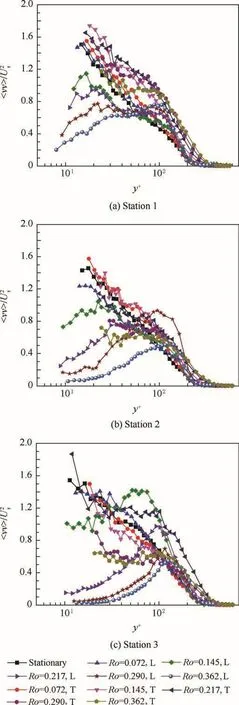
Fig.7 Variation of 〈vv〉/ with streamwise location and rotation number.
In Eq.(5),Ujmeans one of the three components of the velocity whereas ujor uimeans one of the three components of the fluctuating velocity,means the production term of turbulent kinetic energy,Sijmeans the strain rate tensor and p means pressure.When 〈 uv〉/=0,the production of turbulent kinetic energy stops,which is also the essential characteristic of relaminarization process.The attenuation of 〈 uu〉/and〈vv 〉/is the result of stop of production of turbulent kinetic energy,but the turbulent kinetic energy equation is not only produced by the production term,but also transported by convection termand transportation termThus 〈uu〉/and〈vv〉/do not equal 0.
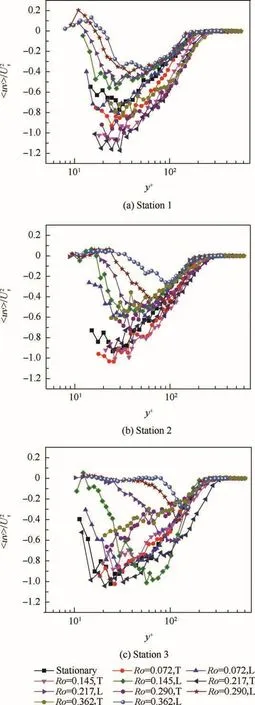
Fig.8 Variation of 〈uv〉/ with streamwise location and rotation number.
3.3.Quadrant analysis of velocity fluctuation
In the investigation of Wei et al.,22the relaminarization phenomenon is found through the contrast ofIn order to have a better understanding of the characteristics of the turbulent fluctuation of the relaminarization and the effects of the Coriolis instability on the turbulent fluctuation,the authors analyzed the quadrant distribution of fluctuating velocity u and v.The coordinate system and quadrant used here are shown in Fig.9.
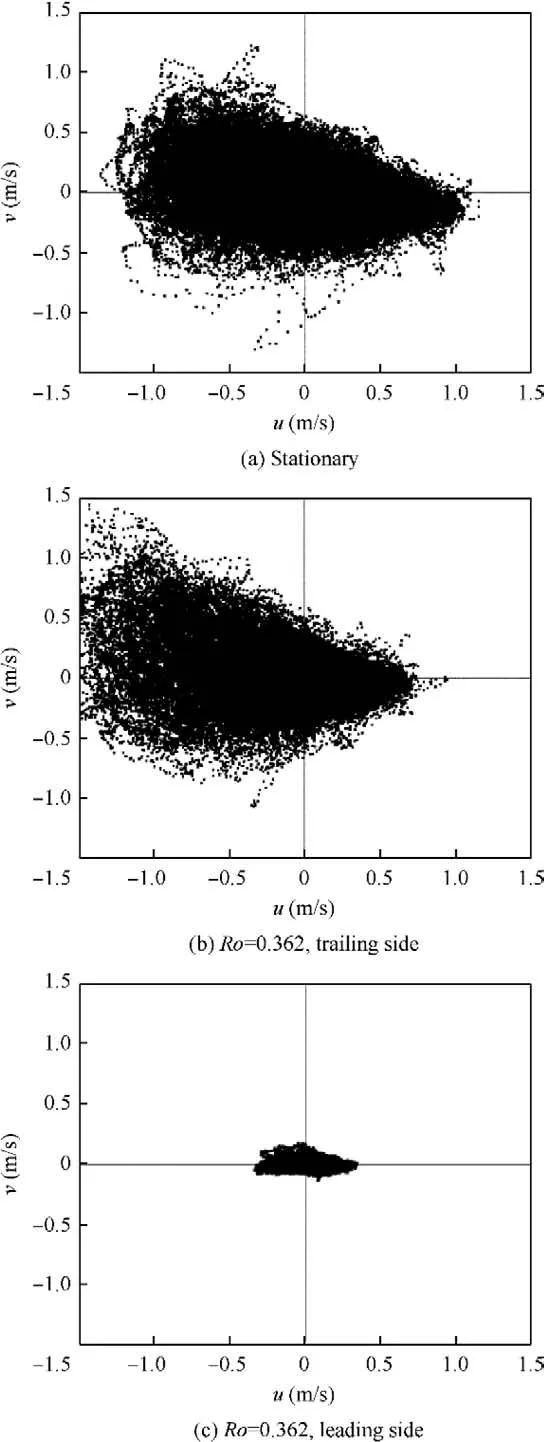
Fig.9 Distribution of fluctuation in four quadrants under different rotation conditions at Station 3(y+=20).
As we all know,there are a series of streaks in the inner layer of the turbulent boundary layer,and burst is one of its characteristics.Burst,the streak flows downstream with the fluid,will also move away from the wall at the same time.When y+is larger than 10,the movement of streaks away from the wall becomes faster;subsequently,the streaks vibrate violently,break down,with the vortex shedding from the wall.Burst is considered to be the primary form of the production of the turbulent kinetic energy.Besides,the movement of streaks away from the wall is named ejection.Ejection causes the relatively high speed fluid to fill the vicinity of the wall,and the process in which fluid flow to the wall is named sweep.In a word,ejection and sweep are considered to be the characteristics of the production of the turbulent kinetic energy.In the description above,we can see that ejection is the process in which the relatively low speed fluid moves away from the wall;therefore,in the four quadrant analysis,ejection lies in the second quadrant(i.e.u<0,v>0).Besides,sweep is the process in which the relatively high speed fluid comes to the wall;therefore,in the four quadrant analysis,sweep lies in the fourth quadrant(i.e.u>0,v<0).
The distribution of the fluctuating velocity in the quadrant analysis measured at Station 3,y+=20,in a sampling period(i.e.10 s)under three rotating conditions is presented in Fig.9.It can be seen that there is a greater possibility in Fig.9(a)and Fig.9(b)for the fluctuating velocity lying in the second quadrant,and this is because the ejection happens at the measuring location.Comparing the distribution of the fluctuating velocity near the trailing side and that near the stationary wall,we can see the possibility that fluctuating velocity lies in the second quadrant near the trailing side is much higher than that near the stationary wall.This is because the ejection happens more frequently near the trailing side,resulting in a frequent production of turbulent kinetic energy,which is in good agreement with the conclusion that the Coriolis instability can promote the turbulent intensity.
Comparing the distribution of the fluctuating velocity in the quadrant analysis near the leading side and that near the stationary wall,we can see that the distribution of fluctuation takes on the following characteristics: first,the fluctuation decreases sharply,which means that the kinetic energy of turbulent fluctuations dissipates very quickly after relaminarization.Second,the shape of the distribution of the fluctuation near the leading side is more flat than stationary cases;that is to say,the absolute value of v is much smaller than the absolute value of u,which means the momentum transfer is weakened in the normal direction.Third,the distribution of fluctuation is more uniform in four quadrants,which means ejection does not happen as frequently as it should do.
3.4.Effect of Coriolis force on turbulent fluctuation
Nakabayashi and Kitoh10simplified the Reynolds transport equation in the boundary layer and normalized the equation,and finally obtained the transport equation as follows:


Through the analysis of Eqs.(6)–(8),the origin of the turbulent fluctuation near the leading side is the first term on the right-hand side of the Eq.(7),which is also the Coriolis term.Coriolis term transports the turbulent kinetic energy from the term 〈vv〉/to 〈uu〉/resulting in the decrease of the〈 vv 〉/and the increase of the term〈 uu 〉/Turbulent kinetic energy transferred from 〈 vv〉/to 〈 uu〉/results in the decrease of〈-uv〉/in two different ways.The first way is that the first term on the right-hand of the Eq.(8),the production term,is responsible for the decrease of-〈uv〉/;the second way is that the second term on the right-hand,the Coriolis term,leads to the decrease of-〈uv〉/By contrast,we can see from Eq.(6)that the first term on the right-hand of the equation(i.e.the production term)results in the decrease of〈uu 〉/while the second term on the right-hand of the equation(i.e.the Coriolis term)results in the increase of the〈uu〉/.In order to make clear the mechanism of the relaminarization,it is necessary to make it clear which term,Coriolis term or production term,has a predominant role.
The distribution of the production term.and the
3.5.Rotation correction of wall function
It has been presented in the research of Wei et al.22that the turbulent boundary layer in the present case can be divided into several layers:viscous region,viscous-Coriolis region,Coriolis region and core region.Considering there are so many influencing factors in the core region,it is difficult to discuss the issues of rotation correction of the velocity formula at this region.Besides,the viscous region is free from the impact of the rotation,there is no need to discuss the rotation correction of the velocity formula at viscous region.Therefore,we mainly discuss the rotation correction of velocity formula at viscous-Coriolis region and Coriolis region.

Fig.10 Coriolis term and production term.
For the rotation correction of the velocity formula at the Coriolis region,considering the Coriolis region is derived from the logarithmic region,the authors try to correct the velocity formula from the very beginning of the deduction of the log law;whereas for the viscous-Coriolis region,considering this region is derived only from the viscous region,the authors also try to correct the velocity formula from the very beginning of the deduction of the wall function for the viscous region.By the way,the most common expression of the wall function in the viscous region is Van Driest formula,thus the correction of the velocity formula at the viscous-Coriolis region starts at the beginning of the deduction of the Van Driest formula.What’s more,log law and Van Driest formula has the same parameter,the von Karman coefficient κ.Therefore,the authors first correct the log law and get the von Karman coefficient κ with rotation correction;based on this κ,the Van Driest formula with rotation correction is finally obtained.
The mean primary velocity profiles under different rotation numbers at Stations 1-4 are presented by Wei et al.,22and the difference of mean primary velocity profiles between the rotating cases and stationary cases,namely the δU+,at Station 2 and Station 3 is presented in Fig.11.As is shown in Fig.11,the difference near the trailing side has a logarithmic distribution in the log region,and the difference increases monotonously with the rise of the rotation number.The difference neartheleading side,apart from the casein which Ro=0.072,does not have the logarithmic distribution,and the difference near the leading side does not increase monotonously with the rise of rotation number.According to the analysis above,the authors speculate that relaminarization in the leading side under rotation conditions is responsible for the contrast of the differences between the trailing side and leading side.Therefore,the authors confirm the speculation by demonstrating that relaminarization is responsible for the difference of the velocity profiles near the leading side not having the logarithmic distribution.
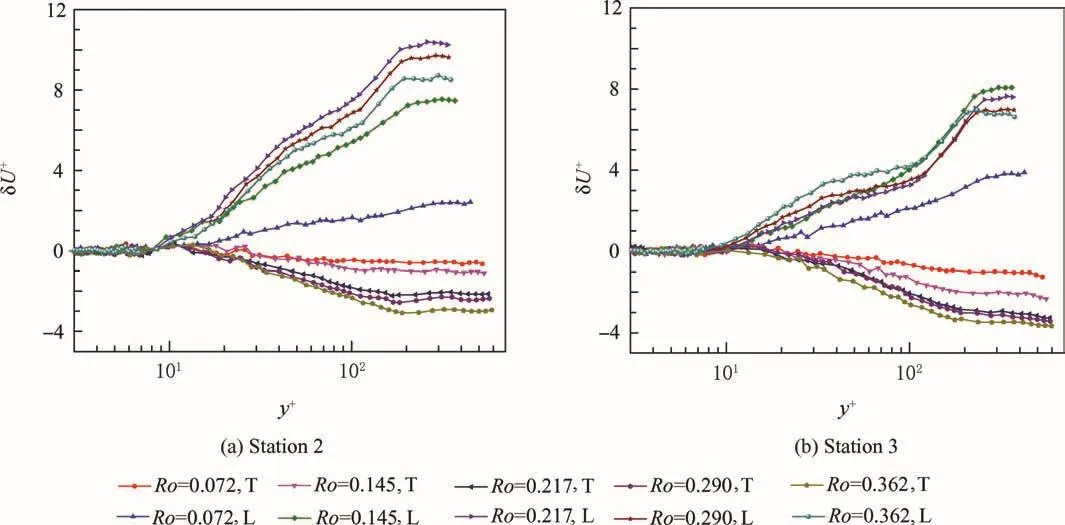
Fig.11 Difference of mean primary velocity profile measured at Station 2 and Station 3 between stationary cases and rotating cases.
In the deduction of log law,there is an important assumption:local equilibrium hypothesis is valid in the log law region,which means that production term of turbulent fluctuation equals dissipation term and the equationis valid.can be neglected,compared to,and then there is,and then there is-〈uv〉=in log law region.
The distribution of the dimensionless shear stress at different locations under different rotating conditions when 30< y+< 100 is presented in Fig.12.The formula of the dimensionless shear stress is
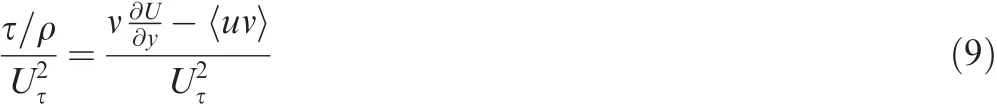
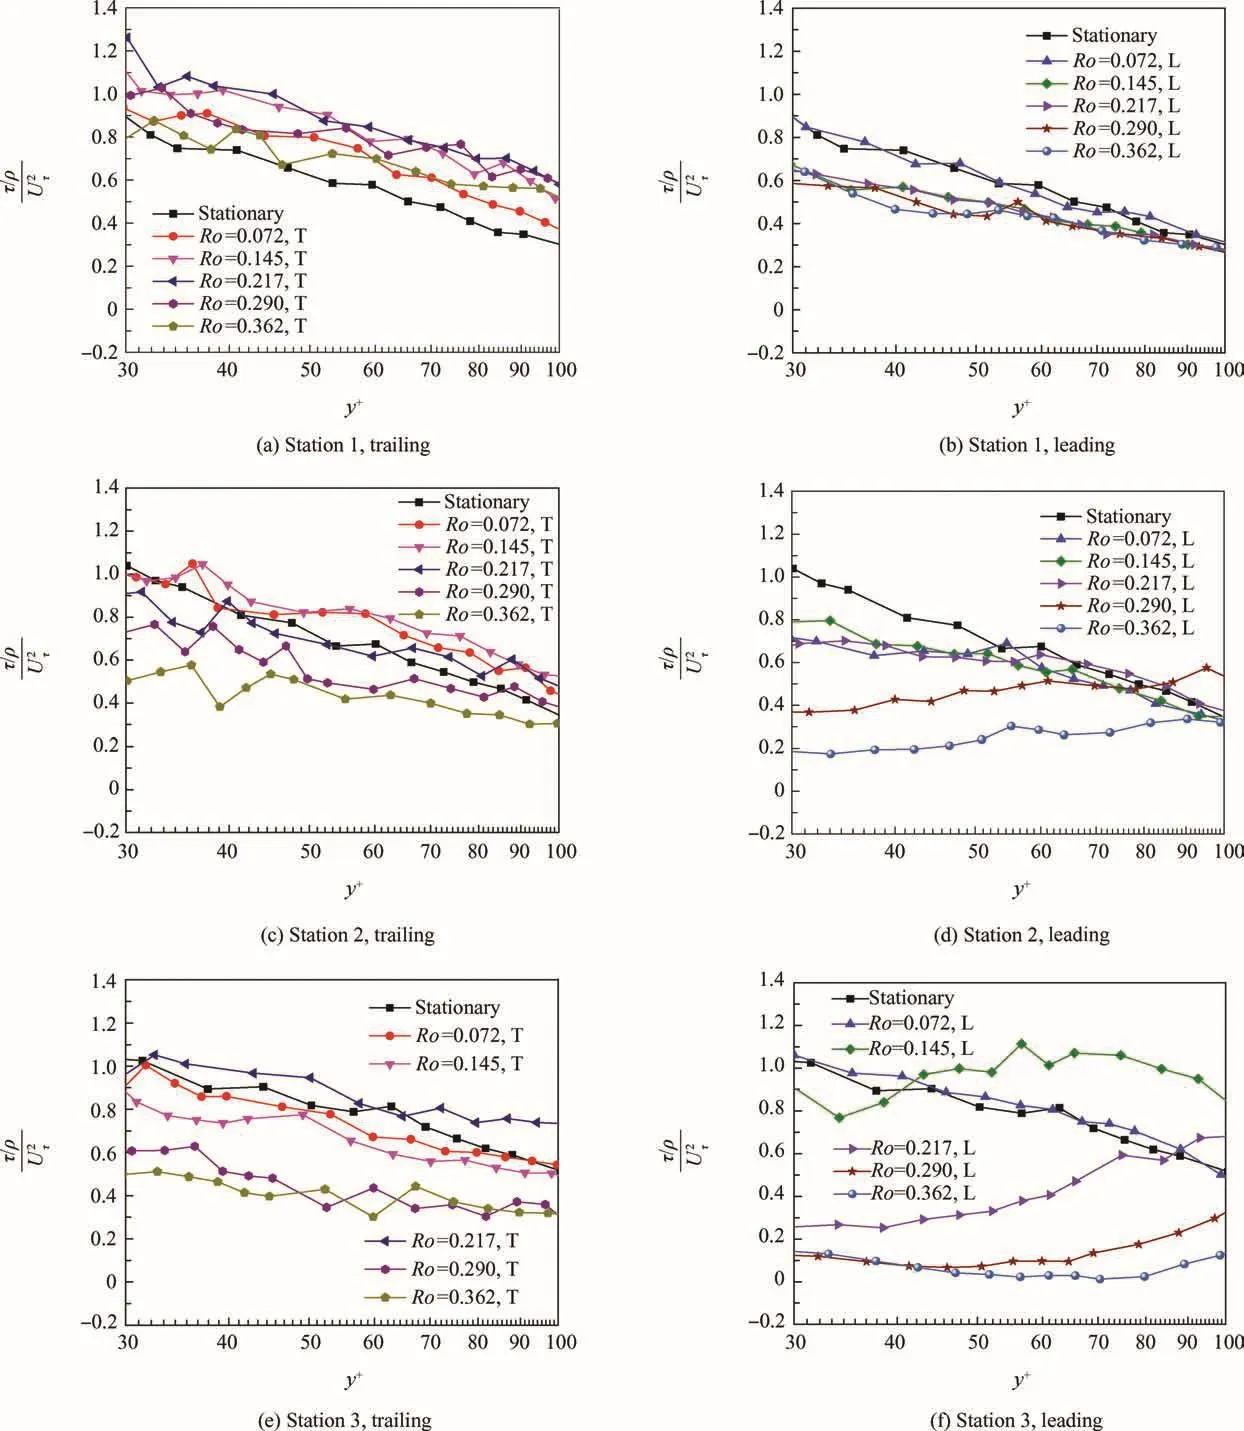
Fig.12 Distribution of dimensionless shear stress under different rotating cases when 30< y+< 100.
Fig.12 shows that the equationis not valid for the inner layer of the boundary layer in stationary cases.This is mainly because the small Reτ(Reτ=Uτδ/ν)in the present case leads to the attenuation of the-〈uv〉when y+<100.Therefore,the mean primary velocity profile also has the log law whensuggesting thatis not the prerequisite for the existence of log law.The authors consider that the log law of the mean primary velocity profile can be obtained when the distribution ofat the range of 30<y+<100 under rotating conditions is consistent with that in stationary cases(i.e.decreases monotonously with the rise of y+).Apart from the cases of Ro=0.290,Ro=0.362 at the leading side of Station 2 and the cases of Ro=0.145,0.217,0.290,0.362 at the leading side of Station 3,the distribution ofat the range of 30<y+<100 under other rotating conditions is consistent with that under stationary conditions.increases with y+in the rotating cases in which the distribution ofis not consistent with that stationary cases.Through the contrast of Fig.8 and Fig.12,it is not difficult to see thatincreasing with y+is the result of relaminarization.Meanwhile,the differences of the velocity profiles having the logarithmic distribution in Fig.11 are the cases in Fig.12,in which the distribution ofat the range of 30<y+<100 is consistent with that under stationary cases.And the differences not having the logarithmic distribution are the cases in Fig.12,in which the distribution ofat the range of 30<y+<100 is not consistent with that under stationary cases.Thus,it is demonstrated the relaminarization results in the difference of the primary velocity profile not having the logarithmic distribution.
The primary velocity does not have a logarithmic distribution when relaminarization influences the velocity profile in the log region,not to mention rotation correction on the wall function of the Coriolis region which has a logarithmic distribution.Therefore,it is important to make sure whether the relaminarization influences the wall function within the log law region in the inner layer of the boundary layer.And thus,the critical conditions for the relaminarization must be obtained before the rotation correction for the wall function of the turbulent boundary layer.It is not difficult to find that the critical rotation number,at which the logarithmic distribution of the velocity profile within the log region is affected by relaminarization,decreases with the rise of the radius of rotation.This can be explained as follows:relaminarization is the process in which the inner layer of the boundary layer deviates from the equilibrium turbulent flow;in other words,the dissipation of the turbulent kinetic energy is larger than the generation.Therefore,the kinetic energy of turbulent flow decreases along the stream-wise location and the relaminarization becomes severer and severer.
Fig.13 gives the critical condition for the relaminarization when Re=19000.In Fig.13,X/D equals 4.0625,5.3125,6.5625 respectively for the four streamwise locations shown in Fig.1.The point in Fig.13 means the maximum rotation number at which the velocity differences of the primary flow between the rotating conditions and the stationary conditions are not influenced by the relaminarization,which can be named the limit of the relaminarization.Fig.13 shows that the critical rotation number for the limit of relaminarization has a linear relationship with X/D.
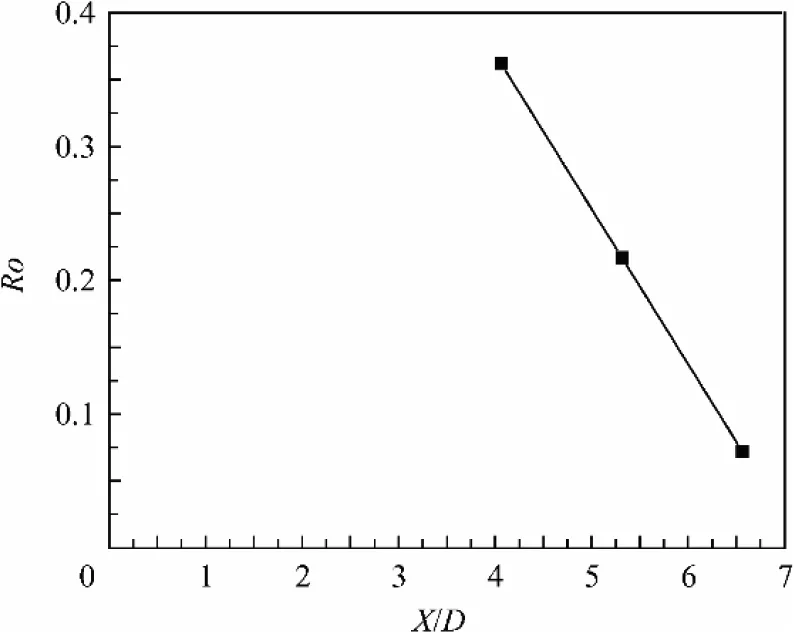
Fig. 13 Critical condition for relaminarization when Re=19000.
With the limit of the relaminarization,we can perform the rotation correction of the wall function within the Coriolis region in the cases without the influence of relaminarization.It is known that all the forces have little influence on the log law region.Therefore,there should be no direct relationship between ∂U/∂y and the viscous force;in other words,∂U/∂y should not include viscous coefficient ν.However,considering the revised von Karman κ is the function of Rc,which is one of the governing parameters in the turbulent boundary layer under rotating conditions and includes the viscous coefficient,it seems that revising von Karman coefficient will lead∂U/∂y to includeν.But the von Karman coefficient is the constant related to the turbulent mixing length scale lm,considering there is lm=κy,which is valid in the region not dominated by viscous force.Therefore,in any given case,von Karman coefficient is still the constant in the physical essence,and revising von Karman coefficient can guarantee that ∂U/∂y does not directly include viscous coefficient ν.
The variation of 1/κ with Rc at different streamwise locations is presented in Fig.14,and only the cases in which the flow near the leading side is not affected by relaminarization are presented.1/κ has the linear relationship with Rc on the whole.Therefore,the present paper takes the following fitting formula to describe the von Karman coefficient in the Coriolis region.

Here,M and N are all fitting parameters of the curve in Fig.14.Through fitting the experimental data into Eq.(10),then it becomes
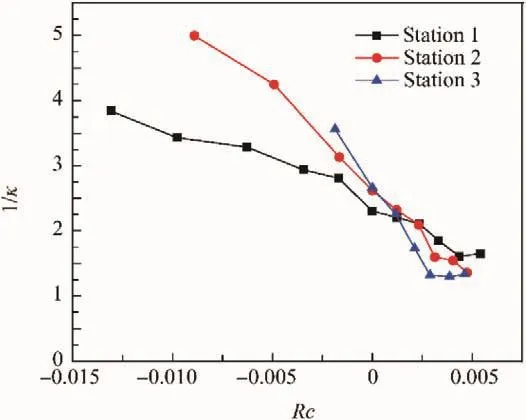
Fig.14 Variation of 1/κ with Rc at different streamwise locations.

It should be pointed out that the Eq.(11)is not valid for the flows in all kinds of channel geometries.First,we have studied the entry section of the turbulent flow.As we all know,the entry section of the turbulent flow is greatly affected by the boundary conditions.For example,if the crossing-section changes from square into trapezoid,the secondary flow in the cross-section may change,and Macfarlane et al.8have discussed the interaction between the secondary flow and the primary flow.
Frankly speaking,there is some limitation in the generality of the conclusion;besides,the formula present in our paper is applied in the square cross-section.However,this paper is in the preliminary stage of our research.In the subsequent research,we will discuss the rotation correction of the boundary layer in different channel structures.However,the basic formula form=M+NRc may not change,only the value of the undetermined coefficient M and N may vary with the channel geometry.
After revising von Karman coefficient κ,we can revise the intercept of the standard log law.However,the distribution of intercept is so sophisticated,as shown in Fig.15.Watmuff et al.3and Nakabayashi and Kitoh4do not give the revising formula of intercept C either.The reason why the influence of rotation on κ and C is so different is that κ is related to dU+/dy+,whereas,C is related to the integral of dU+/dy+.Therefore,the viscous and viscous-Coriolis region can also influence the intercept C.So,the present paper does not intend to revise the intercept C with rotation.
Failing to find the rotation correction of the intercept C,the authors cannot revise the formula of the log law as the formula of Coriolis region.However,the authors find the revised formula of von Karman coefficient κ,and we can use the Van Driest formula to revise the wall function of the inner layer of the boundary layer based on the revised von Karman coefficient.The Van Driest formula is presented as follows:


Fig.15 Variation of intercept C with Rc at different streamwise locations.
where A+=UτA/ν and the A means the damping length scale in the stationary cases,which is an empirical parameter.Through fitting the mean velocity profiles,which is presented by Wei et al.,26into Eq.(12),the revised A+can be obtained as shown in Fig.16.It is not difficult to see that the variation of A+with Rc at different streamwise locations is similar to the intercept C,which means that there may be some implicit relationship between A+and intercept C.Therefore,it is also difficult to get a universal revised formula with rotation.In addition,seen from Fig.16,A+can be very large when Rc>0,which is physically contradictory.The physical meaning of A+is the dimensionless length scale dominated by viscousforce,and the larger A+means the larger are a dominated by viscous force.However,when Rc>0,the turbulent fluctuation near the trailing side increases,the area dominated by viscous force should shrink.
But why is the A+obtained near the trailing side physically contradictory?This can be explained as follows:
The deduction of Van Driest formula is based on an assumption:

where κy[ 1-exp(-y/A)]means the turbulent mixing length scale.When the flow is far away from the wall,the scale equalsκy.Considering the damping effect near the wall,a damping function[1-exp(-y/A)]is added.However,for the boundary layer in the rotating channel,it is inappropriate to use κy[ 1-exp(-y/A)]to represent the turbulent mixing length scale.Instead,we should use the κ of the rotating cases in the Coriolis region,use the κ of the stationary cases in the viscous region.Only in this way the velocity profile of rotating cases and stationary cases can overlap near the wall without A+contradictory to its physical essence.Otherwise,the κ near the trailing side of rotating cases is larger than that in stationary cases,and the term A should be enlarged so that the velocity profile near the wall of rotating cases overlaps with that in stationary cases,resulting in the A+contradictory to its physicalessence near the trailing side.In a word,only κy[ 1-exp(-y/A)]cannot describe the distribution of the turbulent mixing length of the boundary layer of rotating cases,which also leads to the result why it is difficult to obtain a universal A+through Eq.(12).

Fig.16 Variation of A+with Rc at different streamwise locations.
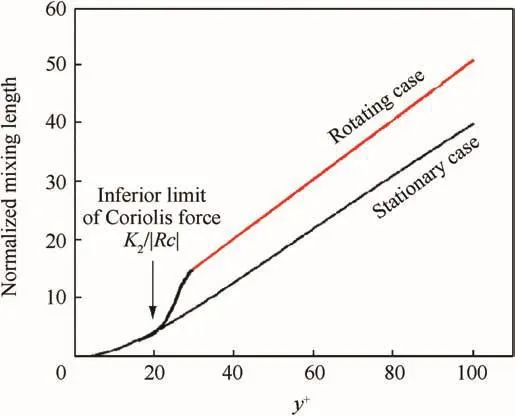
Fig.17 Distribution of dimensionless mixing length for rotating cases.
Based on the analysis above,the authors consider it is necessary to define the turbulent mixing length scale again to obtain the universal wall function in the rotating channels.The newly-defined turbulent mixing length scale must have the following characteristics.First,the new mixing length is κ1y[ 1-exp(-y/A)]in viscous region,here,κ1means the von Karman coefficient in the boundary layer in stationary cases.Second,from the inferior limit of the region influenced by the Coriolis force,namely theis a coefficient that determines the inferior limit of the influencing region of Coriolis force),the turbulent mixing length should vary from κ1y[ 1-exp(-y/A)]to κ2y smoothly,ending up with κ2y(κ2means the von Karman coefficient in the rotating channel)in the Coriolis region,as shown in Fig.17.To realize the smooth variation,it is necessary to add an additional damping length scale B.In a word,the newly defined turbulent mixing length scale is sophisticated:First of all,it is a segment function;second,an additional damping length scale B that should include penetration depth of Coriolis force is needed;third,the smooth variation from κ1y[ 1-exp(-y/A)]to κ2y is pretty sophisticated.Considering the complexity of the newly defined turbulent mixing length scale,the authors discuss some important characteristics it should have,rather than give the specific form of the newly defined turbulent length scale.
4.Conclusions
From the distribution of the component of Reynolds stress,it can be seen that relaminarization occurred near the leading side.Because the absolute value of local rotation parameter Rc is almost twice as large as that in previous researches,the whole process of relaminarization is presented.
Through the analysis of the transport equation of Reynolds stress,it can be seen that though the Coriolis term indeed contributes to the attenuation of the fluctuation in the leading side,the influence of Coriolis term on attenuation is slight,compared to the production term.However,the Coriolis term is very important for the attenuation of turbulent fluctuation,considering the Coriolis term is the origin of the attenuation of turbulent fluctuation.The influence of the Coriolis term is amplified by the production term.
Last,the present paper revises the wall function of the turbulent boundary layer not affected by the relaminarizaiton.The revised formula of von Karman coefficient is also presented.In the rotation correction of the wall function of the Coriolis region and the Van Driest formula in the viscous region,the authors fail to obtain the intercept of the log law or the universal A+in the Van Driest formula,thus a new revising method is proposed.
Acknowledgments
The present work is supported by the National Natural Science Foundation of China(No.51541605).
杂志排行
CHINESE JOURNAL OF AERONAUTICS的其它文章
- Guide for Authors
- Electrochemical machining of a convex strips structure on a revolving part by using site directed power interruption
- Postcapture stabilization of space robots considering actuator failures with bounded torques
- A multi-index assessment method for evaluating coverage effectiveness of remote sensing satellite
- Integrating BDS and GPS for precise relative orbit determination of LEO formation flying
- Training effectiveness evaluation of helicopter emergency relief based on virtual simulation