吡嗪双腙配体铜配合物的合成、结构和DNA结合性质
2018-10-12赵晓雷钟润斌代耿耿吴伟娜
吴 浩 赵晓雷 钟润斌 代耿耿 吴伟娜 王 元
(河南理工大学化学化工学院,河南省煤炭绿色转化重点实验室,焦作 454000)
In the past few decades,Schiff bases and their metal complexes have been a focus of chemists and biologists because of their noteworthy antibacterial,antifungal,anticancer,urease inhibition,antioxidant and antiglycation activities[1-5].Ithasbeen demonstrated that the presence of heterocyclic ring in the synthesized Schiff bases plays a major role in extending their pharmacological properties[2,6-7].Since pyrazines are an important class of nitrogen heterocyclic compounds with a variety of biological activities,metal complexes of Schiff bases bering pyrazine unit,including semicarbazones[8-9],thiosemicarbazones[10-11]and acylhydrazone[12-13],have attracted more and more attention.However,to the best of our knowledge,the studies on the coordination behavior of bis-hydrazones containing pyrazine ring are relatively scarce[14].
On the other hand,it is noted thatCuギcontaining anticancer agents are promising leads for next generationmetal-based anticancer agentsbecause Cuギplays a significant role in biological systems[15-16].Herein,we present here the crystal structures of a bis-hydrazone(L,Scheme 1)derived from 3-ethyl-2-acetylpyrazine and its Cuギcomplex.In addition,the interactions between both compounds and ct-DNA have been studied by ethidium bromide(EB)fluorescence probe.

Scheme 1 Synthesis route of L
1 Experimental
1.1 M aterials and measurements
Solvents and startingmaterials for synthesis were purchased commercially and used as received.Elemental analysis was carried out on an Elemental Vario EL analyzer.The IR spectra(ν=4 000~400 cm-1)were determined by the KBr pressed discmethod on a Bruker V70 FT-IR spectrophotometer.1H NMR spectra of L was acquired with Bruker AV400 NMR instrument in DMSO-d6solution with TMS as internal standard.The UV spectra were recorded on a Purkinje General TU-1800 spectrophotometer.The interactions between three compounds and ct-DNA are measured using literature method[17]via emission spectra on a Varian CARY Eclipse spectrophotometer.
1.2 Preparations of the ligand L and com plex 1
As shown in Scheme 1,the ligand L was produced by condensation of 3-ethyl-2-acetylpyrazine(3.02 g,0.02mol)and 85%hydrazine hydrate(0.59 g,0.01mol)in anhydrous ethanol solution (30mL)with continuous stirring under refluxing for 3 h.After cooled to room temperature,colorless rod crystals were filtered and washed three times by cold ethanol.Yield:2.13 g (72%).m.p.119.0~120.2 ℃.Elemental analysis Calcd.for C16H20N6(%):C:64.84;H:6.80;N:28.36.Found(%):C:64.92;H:6.76;N:28.15.FT-IR(cm-1):ν(C=C)1 653,ν(C=N-N)1 620,ν(C=N)pyrazine1 650,ν(C=N)pyrazine1 560.1H NMR(400 MHz,DMSO-d6):δ8.59~8.65(2H,d,pyrazine-H),3.14~3.19(2H,q,CH2,J=8.0 Hz),2.27(3H,s,CH3),1.28~1.32(3H,t,CH3,J=8.0 Hz).
The crystals of complex 1 suitable for X-ray diffraction analysis were obtained by slow evaporating themethanol solution(5mL)of the ligand L(5mmol)with equimolar of CuSO4at room temperature.
1:green plates.Anal.Calcd.for C44H86N12O24S3Cu4(%):C:34.82;H:5.71;N:11.08.Found(%):C:34.62;H:5.85;N:10.94.FT-IR(cm-1):ν(C=C)1 654,ν(C=N-N)1 600,ν(C=N)pyrazine1 647,ν(C=N)pyrazine1 510.
1.3 X-ray crystallography
The X-ray diffraction measurements for L and complex 1 were performed on a Bruker SMART APEXⅡ CCD diffractometer equipped with a graphite monochromatized Mo Kα radiation(λ=0.071 073 nm)by using φ-ω scan mode.Semi-empirical absorption correction was applied to the intensity data using the SADABS program[18].The structures were solved by directmethods and refined by fullmatrix least-square on F2using the SHELXTL-97 program[19].All nonhydrogen atoms were refined anisotropically.The C6 atom of 1 occupied two positions,with the occupancy value of C6/C6A being 0.718/0.282.The H atoms of disordered methanol molecule (C12-O8,occupancy value being 0.5)in 1 were not added.All the other H atoms were positioned geometrically and refined using a ridingmodel.Details of the crystal parameters,data collection and refinements for L and complex 1 are summarized in Table 1.
CCDC:1844807,L;1844806,1.
2 Result and discussion
2.1 Crystal structures description
Selected bond distances and angles for L and complex 1 are listed in Table 2.The asymmetric unit of L contains half of themolecule(Fig.1a).According to C4-C7 bond,the imine C7-N3 and pyrazine C4-N1 bonds exist in trans-manner.As shown in Fig.1b,complex 1 includes one discrete tetrameric Cuギcations,one free sulfate anion for charge balance,andsix methanol molecules in the unit cell.The N3-N3ii(Symmetry codes:ii2-x,1-y,z)bridge divides the ligand into two pyrazin-2-yl-methyleneamine subunits,each of which is bound to a different Cuギion with N1 and N3 atoms.Compared with free ligand,the configuration of C7-N3 and C4-N1 bonds transfer to cis.Each Cuギcenter is also coordinated by four O atoms,involving one O atom from one neutral methanol,oneμ2-bridged O atom from one methoxy anion,oneμ2-bridged O and onemonodentate O atoms from two independent sulfate anions.In other words,four Cuギ atoms were bridged by two pairs ofμ2-bridged O atoms to form an ideal planar fourmembered Cu4core with Cu…Cu instance being 0.314 1 and 0.401 2 nm.In the crystal,free sulfate anions and methanol molecules linked the complex cations into one-dimensional chains along c axis(Fig.1c)via intermolecular O-H…O hydrogen bonds(O5-H5…O7,with D…A distance being 0.267 2(6)nm,D-H…A angle being 169.7°;O7-H7…O6,with D…A distance being 0.259 4(9)nm,D-H…A angle being 171.7°).The intermolecular O-H…O hydrogen bonds between the disordered methanol molecules and the uncoordinated O atom(O2)of the sulfate anion in the complex cations are also present(O8…O2,with D…A distance being 0.256 8 nm).

Table 1 Crystal data and structure refinement for L and complex 1
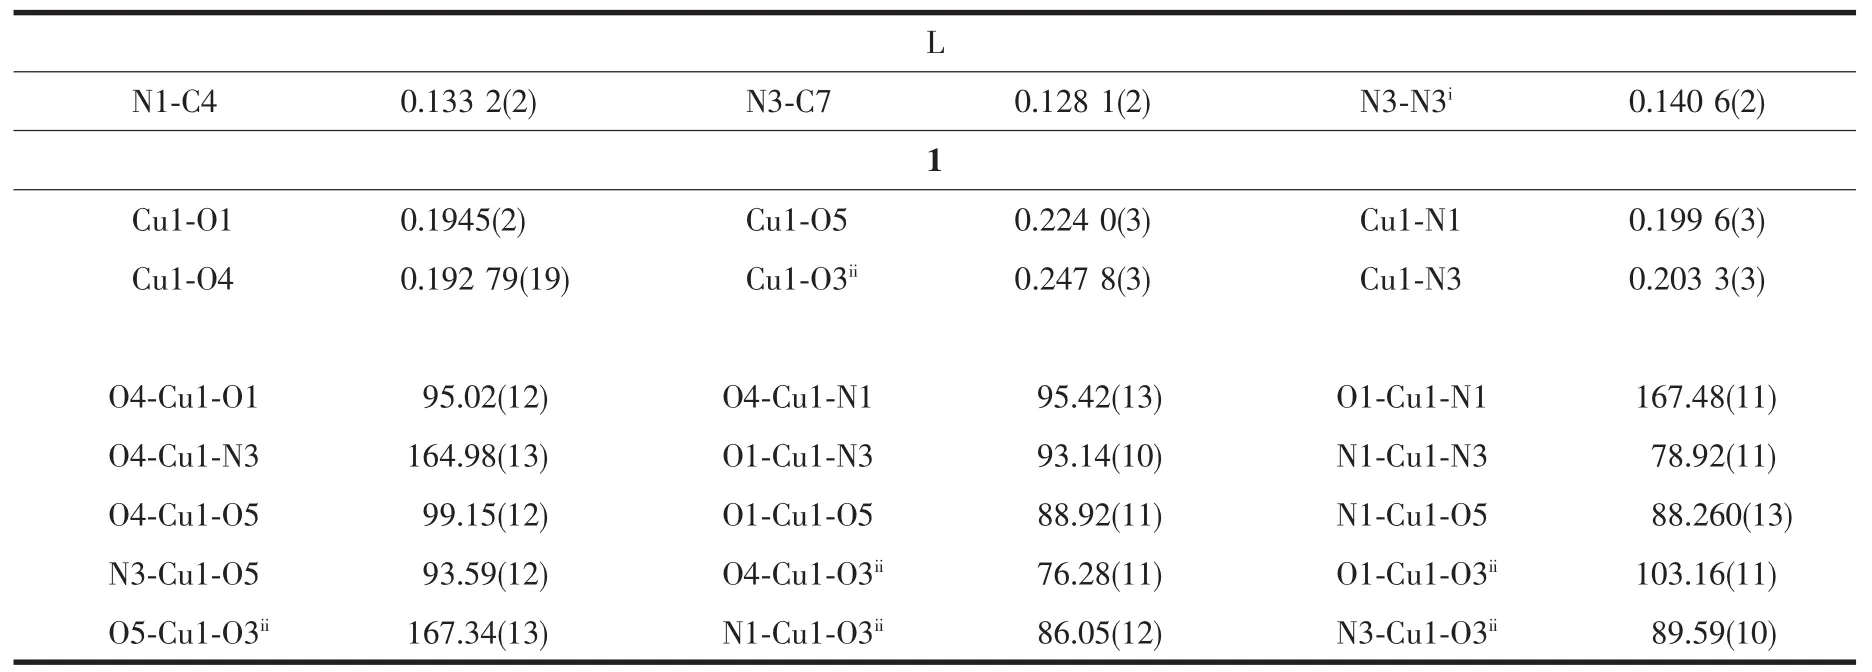
Table 2 Selected bond lengths(nm)and angles(°)in L and complex 1
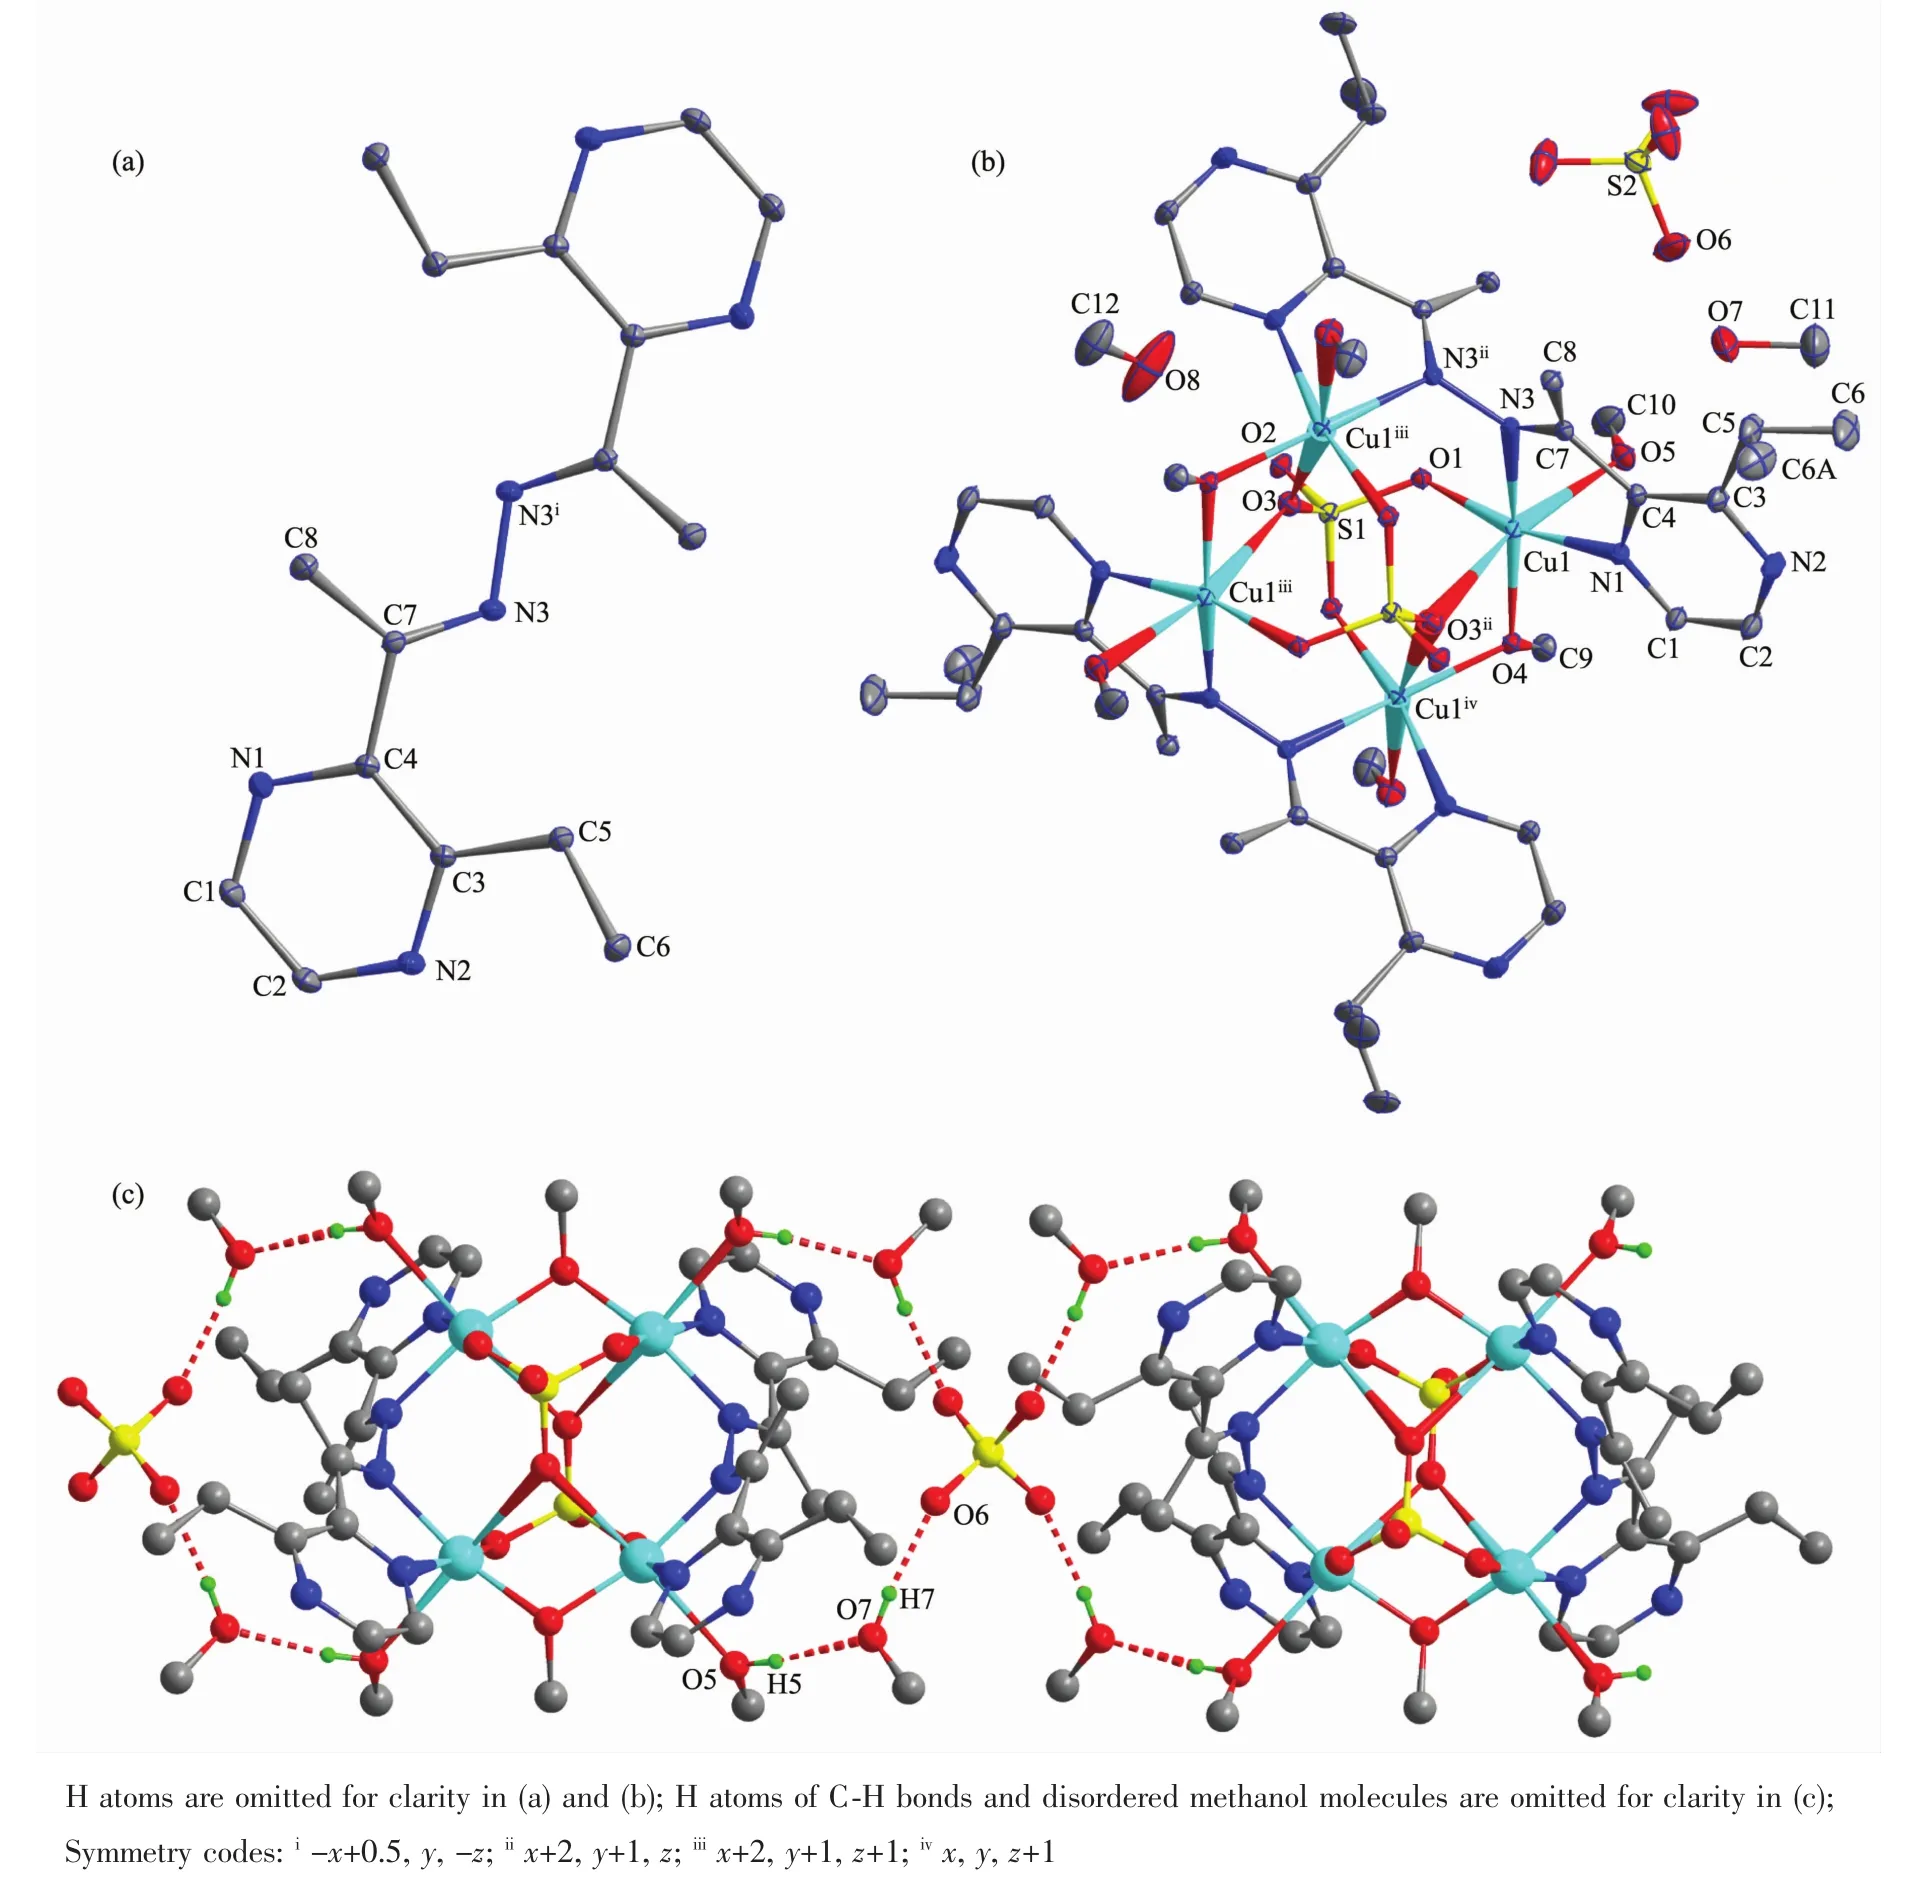
Fig.1 Diamond drawing of L(a)and complex 1(b)with 10%thermal ellipsoids;(c)Extended chain-like supramolecular structure along c axis in complex 1
2.2 IR spectra
The infrared spectral bands most useful for determining themode of coordination of the ligand are theν(C=N-N)and ν(C=N)pyrizinevibrations.As our previous work shows,such two bands of the ligand L are at 1 620 and 1 560 cm-1,while they shift to 1 600 and 1 510 cm-1in the complex 1,respectively,indicating that imine N and pyrizine N atoms take part in the coordination[14,20].It is in accordancewith the crystal structure study.
2.3 UV spectra
The UV spectra of L and complex 1 in CH3OH solution (concentration:10 μmol·L-1)weremeasured at room temperature (Fig.2).The spectrum of L features only one main band located around 285 nm(ε=15 134 L·mol-1·cm-1),which could be contributed to the characteristic π-π*transition of pyrazine[14].In complex 1,the absorbance band has blue-shifted to 275 nm(ε=11 562 L·mol-1·cm-1),confirming the coordination of ligand L in complex 1.

Fig.2 UV spectra of the ligand L and complex 1 in CH3OH solution at room temperature
2.4 EB-DNA binding study by fluorescence spectrum
It is well known that EB can intercalate nonspecifically into DNA,which causes it to fluoresce strongly.Competitive binding of other drugs to DNA and EB will result in displacement of bound EB and a decrease in the fluorescence intensity[9].As shown in Fig.3,the fluorescence intensities of EB bound to ct-DNA at about 600 nm show remarkable decreasing trends with the increasing concentration of the tested samples,indicating that some EB molecules are exchanged by the tested compounds.The quenching of EB bound to DNA by the compounds is in agreementwith the linear Stern-Volmer equation:I0/I=1+Ksqr[9],where I0and I represent the fluorescence intensities in the absence and presence of quencher,respectively;Ksqis the linear Stern-Volmer quenching constant;r is the ratio of the concentration of quencher and DNA.In the quenching plots of I0/I versus r,Ksqvalues are given by the slopes.The Ksqvalues of complex 1 is tested to be 3.337,which ismuch higher than that of the ligand L(0.475).The results indicate that the interaction of the complex with DNA are stronger than that of the ligand L,because complex 1 have higher rigidity to bind the base pairs along DNA.

Fig.3 Emission spectra of EB-DNA system in the presence of L(a)and complex 1(b),respectively