Comparative Transcriptome Profiling of Glycine soja Roots Under Salinity and Alkalinity Stresses Using RNA-seq
2018-10-10ZhuYanmingLiJinaDuanMuHuiziYinkuideChengShufeiChenChaoCaoLeiDuanXiangboandChenRanran
Zhu Yan-ming, Li Ji-na, DuanMu Hui-zi, Yin kui-de, Cheng Shu-fei, Chen Chao, Cao Lei, Duan Xiang-bo, and Chen Ran-ran
1 College of Life Sciences, Northeast Agricultural University, Harbin 150030, China
2 College of Life Sciences, Heilongjiang University, Harbin 150080, China
3 College of Life Sciences and Technology, Heilongjiang Bayi Agricultural University, Daqing 163319, Heilongjiang, China
Abstract: Saline-alkaline stress can dramatically inhibit plant growth and limit crop production. Wild soybean (Glycine soja) is a crop that adapts well to such environmental stresses. In this study, RNA-sequencing technology was used to analyze the transcriptome profiles of G. soja roots subjected to 50 mmol · L-1 NaHCO3 and 150 mmol · L-1 NaCl treatments. Totally, 2 125 differentially-expressed genes (DEGs) after NaCl treatment and 1 839 DEGs after NaHCO3 treatment were identified. The top 14 DEGs revealed by RNA-seq were analyzed using qRT-PCR (quantitative real-time polymerase chain reaction). Gene ontology (GO) annotation showed that most of DEGs under salt and alkali stresses were enriched in "metabolic process", "catalytic activity" and "binding" terms. To search for transcription factors (TFs) among DEGs, the data were screened against TF database PlantTFDB, and it was found that five TF families, Apetala2/ethylene-responsive element binding proteins (AP2-EREBP), V-myb avian myeloblastosis viral oncogene homolog(MYB), WRKYGQK and Zinc finger motif (WRKY), NAM, ATAF1/2, CUC1/2 (NAC) and Cys2/His2 (C2H2) were involved in salt stress response. Other five TF families, NAC, WRKY, MYB, AP2-EREBP and bZIP were involved in response to alkali stress. These two stress treatments shared NAC, WRKY, AP2-EREBP and MYB, and the only two different TFs were bZIP and C2H2. Forty-eight MYB TFs were differentially expressed under salt and alkali stresses, and most of them were up-regulated. This study provided useful information for further investigation of DEGs and TFs in response to saline and alkaline stresses and helped in understanding the molecular basis of the response of G. soja to saline and alkaline stresses.
Key words: RNA-seq, wild soybean, salt stress, alkali stress
Introduction
Soil salinity and alkalinity have become major environmental factors that affect crop growth and yield (Li et al., 2014). Many countries and regions worldwide face the problems of soil salinization and alkalization (Ge et al., 2011). In the Songnen Plain (China), plants suffered from severe salt and alkali damage (Sui et al., 2016). Elucidating the mechanisms of salt and alkali tolerance of plants is an essential aspect of research on the tolerance of crops to abiotic stresses. Previous studies have compared the effects of salt and alkali stresses on the growth and photosynthesis of wheat (Guo et al., 2015) and cotton(Chen et al., 2011). However, the reasons for different effects of salt stress and alkali stress on plants have remained unclear until date.
RNA-seq is an approach based on deep sequencing of the transcriptome (Wilhelm and Landry, 2009).It has been used for analyzing the transcriptome of several model species under alkali or salinity stress,such as rice (Zhou et al., 2016), wheat (Guo et al.,2015), Arabidopsis (He et al., 2017) and cotton (Yao et al., 2011). Previous studies have reported RNA-seq analysis of G. soja under alkaline stress (DuanMu et al., 2015) and explored the salt tolerance mechanism of G. soja (Chen et al., 2013), but no comparative analysis has been made between the transcriptome profiles of G. soja subjected to salt and alkali stresses,to the best of our knowledge.
G. soja shows a strong salt and alkali stress tolerance, and it can be used as an ideal candidate for studying the molecular mechanisms of salt and alkali tolerance (Ge et al., 2011; Chen et al., 2013). Ge et al.(2011) collected 345 wild soybean lines from Jilin Province, China, and screened out the line G07256 with the highest salt and alkali tolerance, moreover,they investigated the gene expression profile of G07256 in response to alkali stress.
The present study focused on the difference between the transcriptomes of G. soja subjected to salt and alkali stresses. RNA-seq was used to investigate the root transcriptome profiles of G. soja treated with 50 mmol · L-1NaHCO3and 150 mmol · L-1NaCl, and compared the difference in differentially-expressed genes (DEGs) between the two abiotic stresses.
Materials and Methods
Plant materials
A total of 32 G. soja seeds of the line G07256 (40 seeds were cultivated and the germination rate was 80%) were germinated and grown using 1/4 Hoagland solution for 21 days at 24-26℃ and 16 h light/8 h dark cycles. Thereafter, the seedlings were treated with 1/4 Hoagland liquid containing 50 mmol · L-1NaHCO3or 150 mmol · L-1NaCl for 0 and 6 h. The root samples(3 cm from the tap root tips) with similar growth status were collected from nine plants (i.e., the samples were collected from three different plants in each treatment condition). The samples were immediately frozen in liquid nitrogen and stored at –80℃.
RNA extraction and cDNA library construction
RNA was extracted from frozen roots using the RNeasy Plant Mini Kit (Qiagen, Valencia, CA),and the total RNA samples (20 μg) were prepared for sequencing. Magnetic beads with poly-T oligos attached were used for isolating messenger RNA(mRNA) from the total RNA. Thereafter, mRNA was cleaved into small fragments with divalent cations at an elevated temperature. These fragments were used to synthesize first-strand complementary DNA(cDNA) using random hexamer adaptors and reverse transcriptase (Invitrogen, Carlsbad, CA).Second-strand cDNA was synthesized with RNase H (Invitrogen) and DNA polymerase I (NEB, MA,USA). Fragments of 300 bp with 200 bp insertions were isolated on separation gels. Paired-end libraries were sequenced on a single lane in a flow cell using Illumina GAIIx, according to the manufacturer's instructions. The raw sequence data were available at the website of the 1 KPa Project.
RNA-seq and data analysis
After removal of low-quality sequence reads [i.e.,sequences with 10% or more unknown bases, or 50%or more bases with low quality index (Q<5)], the raw data were processed to generate clean reads in fastaQ format. The data quality was tested using FastQC tool(http://www.bioinformatics.babraham.ac.uk/projects/fastqc/). The criteria including average length of reads, Phred score, average quality of single bases,the probability of the occurrence of four bases and the distribution of GC content were considered. Because the genes of G. soja and the cultivated soybean(Glycine max) were highly homologous (Singh, 1988),the genome of G. max was used as the reference sequence for the analysis of G. soja transcriptome data under saline and alkaline stresses. G. max index file was constructed using Bowtie (Langmead, 2010) and the clean reads were mapped to the reference sequences(G. max) using TopHat tool (Trapnell et al., 2009).
Gene expression analysis and annotation
The expression levels of genes were estimated by calculating the fragments per kilobase of exon per million fragments mapped (FPKM) using Cufflinks software (Trapnell et al., 2012). The difference in gene expression levels among the treatment and the control samples was evaluated by fold-change, which was the ratio of FPKM of the genes in the treatment and the control samples. The genes with the threshold|log2-fold change|>1 and P<0.05 were considered as DEGs. Gene ontology (GO) was a global standardized gene functional classification system that described properties of a group of candidate genes (Huntley et al., 2014). GO enrichment analysis of DEGs was identified using agriGO (P<0.01, FDR<0.05)(Du et al., 2010).
Analysis of differential expression of transcription factors
The transcription factors (TFs) of soybeans were downloaded from the plant TF database PlantTFDB(http://planttfdb.cbi.pku.edu.cn/), and all the TFs that were differentially expressed under salt and alkali stresses were screened. To further confirm whether the differentially-expressed TFs screened out from TF database PlantTFDB were MYB (v-myb avian myeloblastosis viral oncogene homolog) TFs, the protein sequence of TFs was analyzed using MEGA 5.0(Kumar et al., 2008) and the non-conserved domains were removed. Thereafter, the highly conserved DNA-binding domains of MYB TFs were analyzed using Weblogo tool (Crooks et al., 2004). Thereafter, the expression patterns of these 48 MYB TFs under salt and alkali stresses were analyzed using MATLAB(http://www.mathworks.com).
Quantitative real-time PCR
The total RNA isolated from the root samples were used for RNA-seq analysis. RNA was reversetranscribed to cDNA by using SuperScriptTM ⅢReverse Transcriptase kit (Invitrogen, Cal, USA). The quantitative real-time PCR (qRT-PCR) was performed with each cDNA template using SYBR Premix Ex-Taq™ⅡMix (TaKaRa, Shiga, Japan) using an ABI 7500 sequence detection system (Applied Biosystems,Carlsbad, CA). GAPDH (accession# DQ355800) was used to normalize all the estimated values. The primers for qRT-PCR for 14 DEGs under salt and alkali stresses were designed using Primer Premier 5.0 (http://www.premierbiosoft.com/primerdesign/) software and listed in Table 1a and Table 1b. The primers for qRT-PCR of eight MYB TFs under salt and alkali stresses are listed in Table 2a and Table 2b. Relative expression levels of DEGs were calculated using the 2-ΔΔCTmethod. Three independent biological replicates were used for qRT-PCR in each of the three technical replicates.

Table 1a Primers of seven genes designed for qRT-PCR under salt stress

Table 1b Primers of seven genes designed for qRT-PCR under alkali stress

Table 2a Primers of four MYB TFs designed for qRT-PCR under salt stress

Table 2b Primers of four MYB TFs designed for qRT-PCR under alkaline stress
Results
Quality assessment of RNA-seq and sequencing data analysis
The results showed that the quality of sequencing was high enough to be used for further analysis. A total of 56 008 312 clean reads were identified. More than 80% of the clean reads were successfully mapped to the genome of G. max (Table 3).
Exploration of DEGs in response to salt and alkali stresses
Totally, 53 218 genes sequences data were identified with FPKM values ranging from 0 to 3 000. During screening DEGs using the criteria of P<0.05 and|Log2-fold change|>1, 2 125 genes were differentially expressed at 6 h as compared with those at 0 h under salt stress and 1 839 genes were differentially expressed at 6 h as compared with those at 0 h under alkali stress. More-over, 775 genes were differentially expressed at 6 h as compared with those at 0 h under both salt and alkali stresses (Fig. 1). Among these 775 genes, 659 genes were up-regulated under both salt and alkali stresses,whereas 116 genes were down-regulated under both two types of stress condition (salt and alkali stresses).

Table 3 Results of clean reads mapping to Glymacine max genome
GO enrichment analysis of DEGs
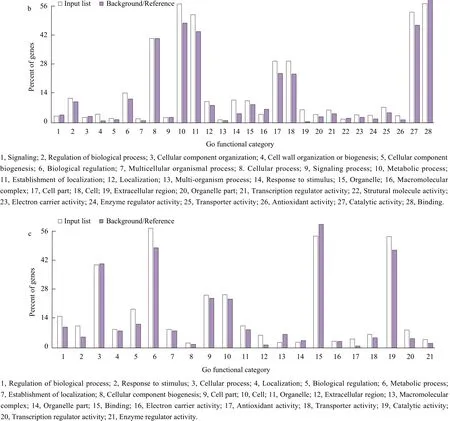
The 1 350 salt stress-specific DEGs were enriched for 27 GO terms (Fig. 2a) and the 1 064 alkali stressspecific DEGs were enriched for 28 GO terms(Fig. 2b). The 775 genes, which were differentially expressed under NaCl and NaHCO3stresses, were enriched for 21 GO terms (Fig. 2c). Most of the 1 350 DEGs, which were specifically expressed under salt stress, were enriched for "binding." However, most of the 1 064 DEGs, which specifically expressed under alkali stress were enriched for "metabolic"and"binding" processes. The 775 DEGs, which were co-expressed under salt and alkali stresses, were enriched in "metabolic process", "binding" and"catalytic activity". From these results, it could be seen a common enrichment of the "binding" GO term,which referred to protein binding, and belonged to the "molecular function" ontology, which described a transporter-target interaction (Faria et al., 2012).


Fig. 2 Gene ontology (GO) enrichment analysis for DEGs under salt and alkali stresses (150 mmol · L-1 NaCl and 50 mol · L-1 NaHCO3,respectively)
Confirmation of salinity-alkalinity stress related gene expression by qRT-PCR
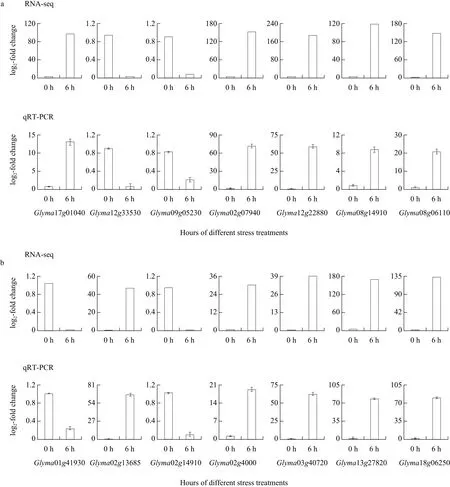
To validate the expression data of RNA-seq, 14 DEGs with the highest expression level under salt and alkali stresses were selected for qRTPCR analysis, including seven salt-response genes(Glyma17g04040, Glyma12g33530, Glyma09g05230,Glyma02g07940, Glyma12g22880, Glyma08g14910 and Glyma08g06110) and seven alkali-response genes(Glyma01g41930, Glyma02g14910, Glyma02g13685,Glyma02g40000, Glyma03g40720, Glyma13g27820 and Glyma18g06250). The results of qRT-PCR showed that five genes (Glyma17g04040, Glyma02g07940,Glyma12g22880, Glyma08g14910 and Glyma08g06110)were up-regulated and two genes (Glyma12g33530 and Glyma09g05230) were down-regulated at 6 h after NaCl stress treatment (Fig. 3a). Under alkali stress,two genes (Glyma01g41930 and Glyma02g14910)were down-regulated and five genes (Glyma02g13685,Glyma02g40000, Glyma03g40720, Glyma13g27820 and Glyma18g06250) were up-regulated at 6 h after NaHCO3stress (Fig. 3b). The expression patterns 14 DEGs identified by qRT-PCR were consistent with expression patterns found in the RNA-seq analysis.

Fig. 3 Validation of RNA-seq with qRT-PCR
Differential expression of TFs under salt and alkali stresses
A total of 265 differentially-expressed TFs in response to salt stress and 161 differentially-expressed TFs involved in alkali stress response were identified.These differentially-expressed TFs were classified in 29 TF categories (Fig. 4). Among these TFs, it was found that most of TFs isolated under salt stress belonged to five TF families—AP2-EREBP, MYB,WRKY, NAC and C2H2. Most of TFs identified in the alkali stress treatment belonged to five TF families—NAC, WRKY, MYB, AP2-EREBP and bZIP. Among these TFs, AP2-EREBP, MYB, WRKY and NAC were identified in both salt and alkali stresses treatments. These TFs were commonly found in plants and widely involved in plant abiotic stress responses.

Fig. 4 Differentially-expressed TFs under salt and alkali stresses
Differentially-expressed MYB genes under salt and alkaline stresses
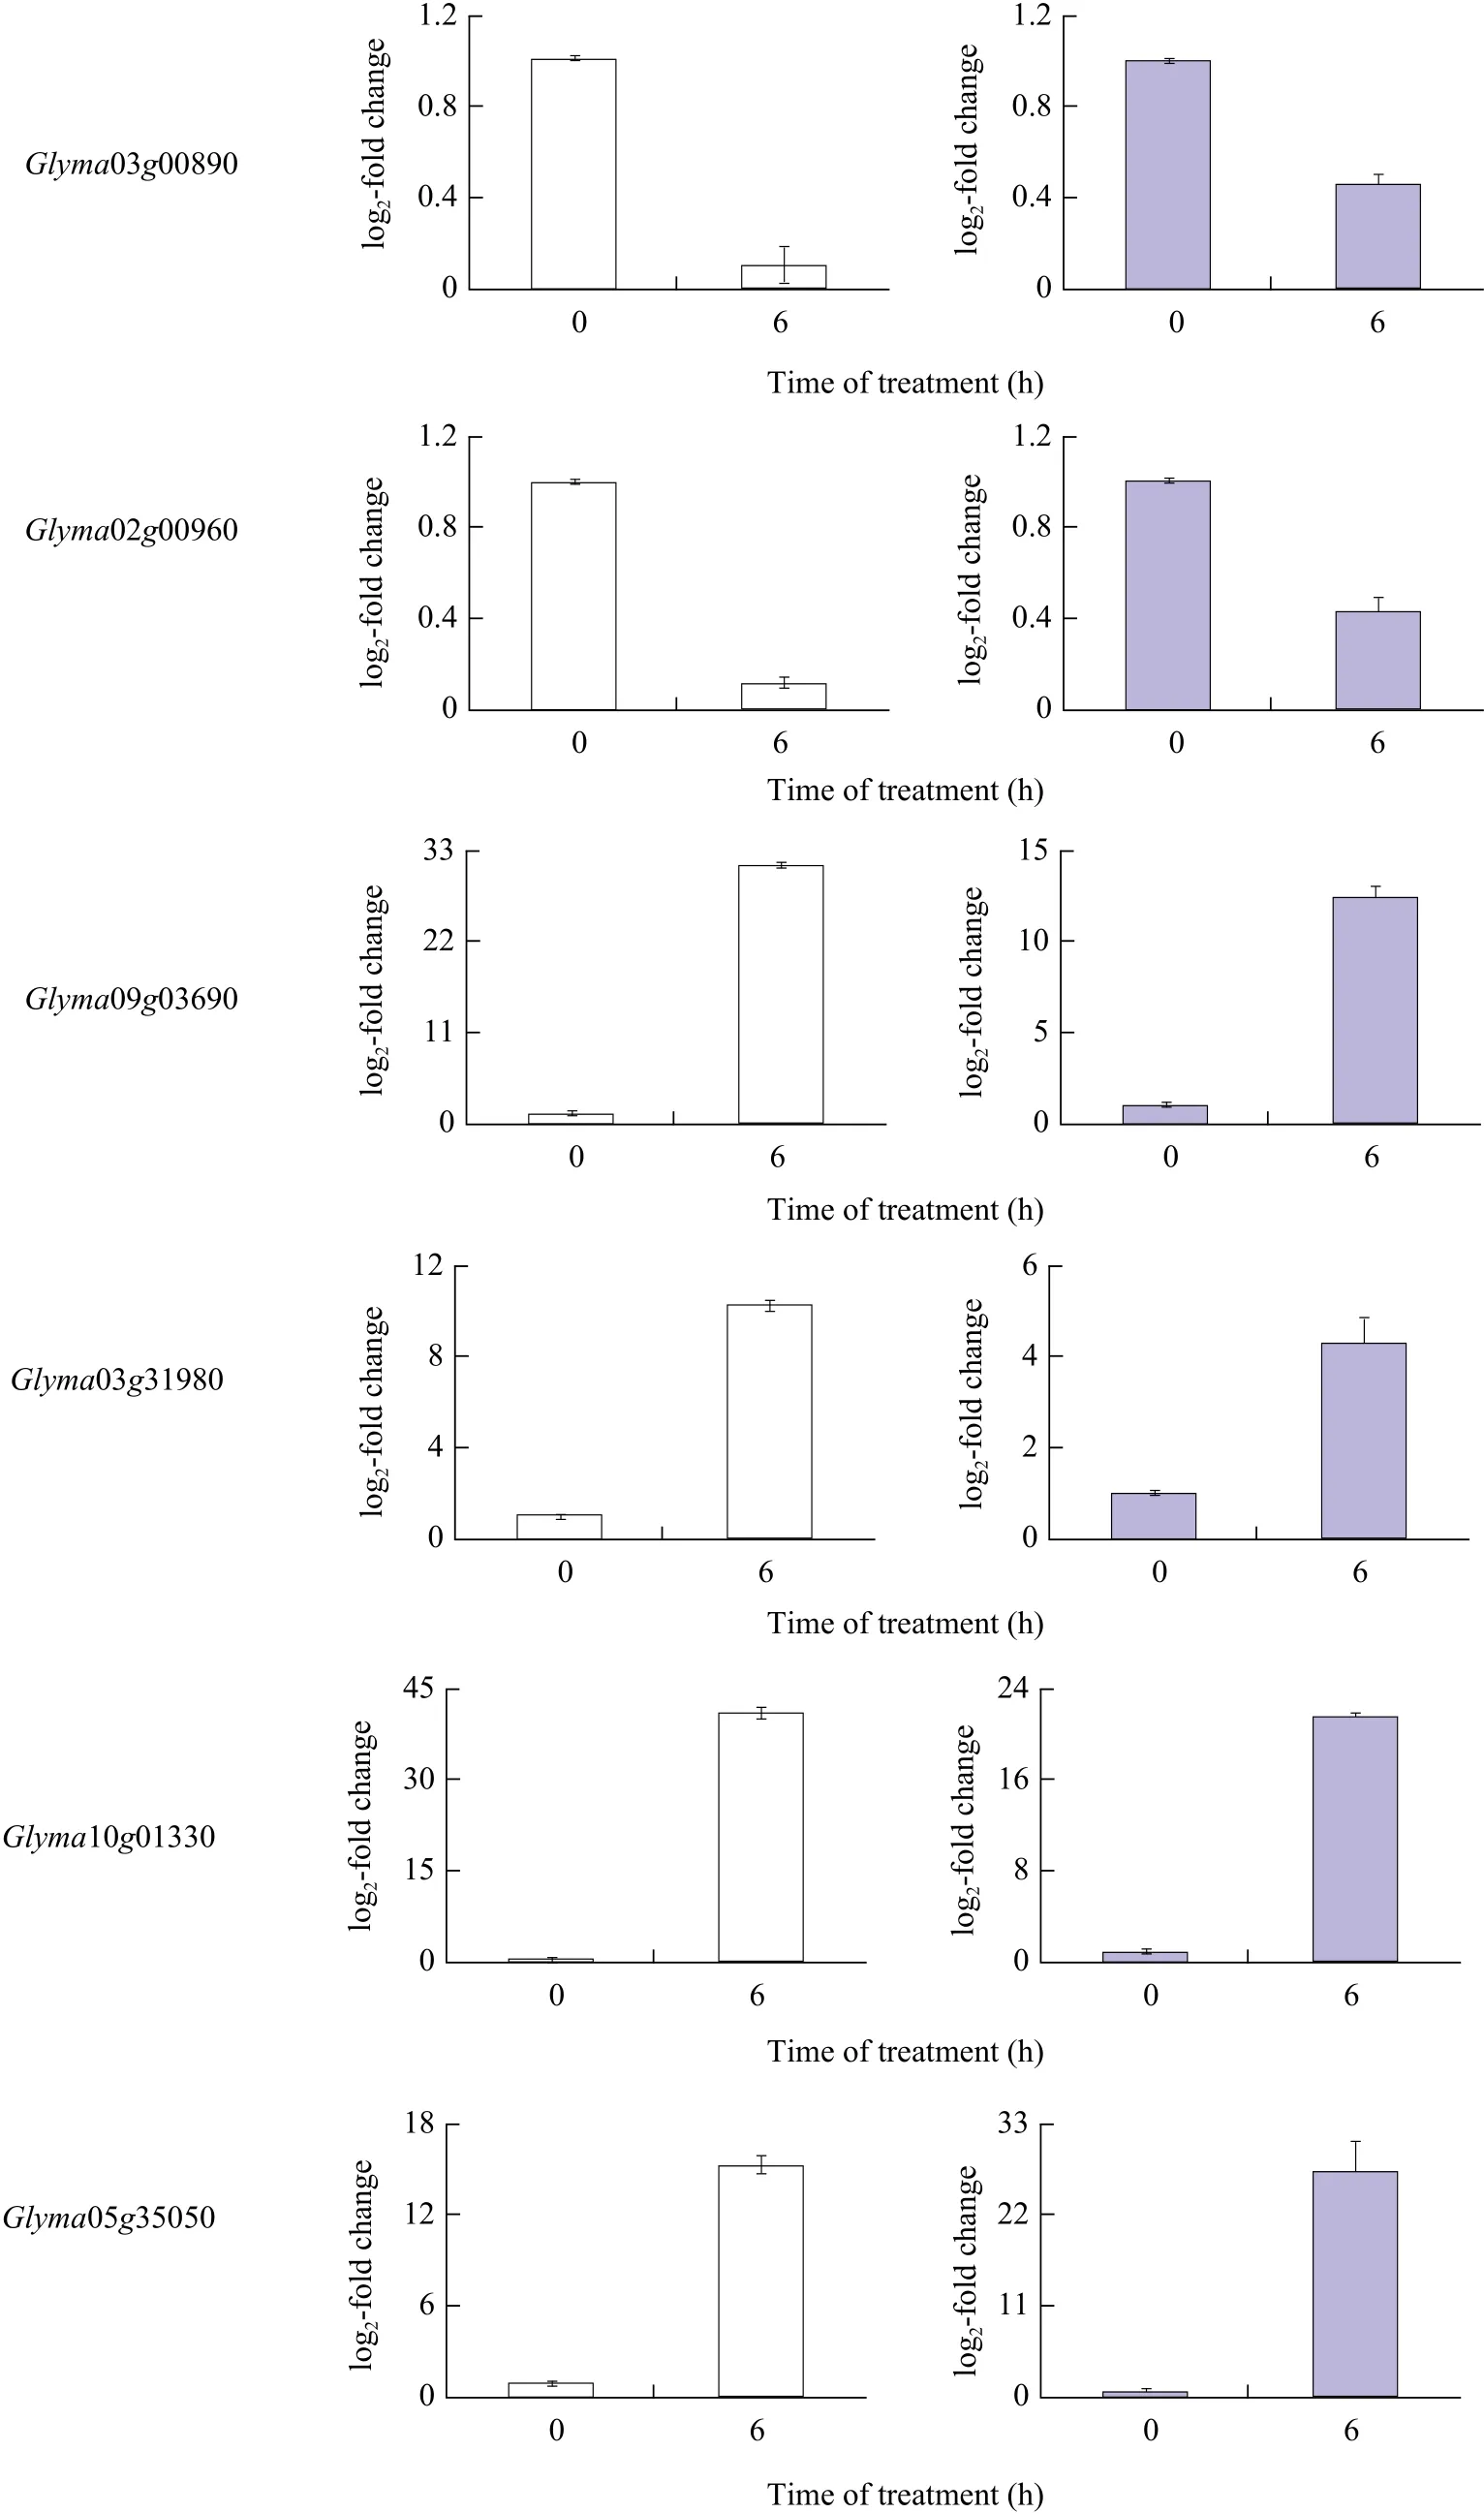
It was found that TFs, which were selected from differentially-expressed TFs under salt and alkali stresses, had conserved domains similar to those of MYB TFs. In the present study, 48 MYB TFs were differentially expressed under salt and alkali stresses,and these differentially-expressed MYBs belonged to R2R3-MYB subfamilies. The heat map showed that 48 MYB TFs clustered into three categories: up-regulated,down-regulated and unaltered. Among these 48 MYB TFs (Fig. 5), eight MYB TFs were selected for validation by qRT-PCR. Among the eight MYB TFs shown in Table 2, the expression of four MYB TFs(Glyma05g06410, Glyma20g22230, Glyma03g00890 and Glyma02g 00960) were down-regulated under salt stress and alkali stress, and four MYB TFs(Glyma09g03690, Glyma03g31980, Glyma10g01330 and Glyma05g 35050) were up-regulated under salt and alkali stresses after qRT-PCR validation. This result showed that the expression pattern of eight MYB TFs revealed by qRT-PCR were consistent with those revealed by RNA-seq (Fig. 6).

Fig. 5 Heat map showing expression profile of MYB TFs in roots of G. soja under NaCl and NaHCO3 stresses


Fig. 6 qRT-PCR analysis of eight MYB TFs expression from 48 differentially expressed MYBs
Discussion
G. soja had high gene homology with cultivated soybean and physiological mechanisms for adapting to salinity stress. Therefore, G. soja was a valuable genomic resource for improving salt tolerance of cultivated soybean species (Chen et al., 2013).Previous studies focused on transcriptome profiling of G. soja roots under alkaline stress using RNA-seq(DuanMu et al., 2015). However, little was known about the difference between the effects of salt and alkali stresses on transcriptome profiling of G. soja.The paper focused on the differences in the transcriptome profiles of G. soja roots under NaCl and NaHCO3stresses by RNA-seq, providing essential information for genetic control of germplasm resources, and would facilitate unraveling the molecular regulatory mechanism under salt and alkaline stresses of wild soybean.
The present study provided novel information about unique DEGs at 6 h under salt and alkali stresses by RNA-seq. Among 775 DEGs under salt and alkali stresses, the numbers of up-regulated DEGs (659) at 6 h were much more than those of down-regulated DEGs (116) at 6 h under salt and alkali stresses.It indicated that most of DEGs were involved in the process of salt and alkali stresses. Some of 659 DEGs, which were up-regulated at 6 h under salt and alkali stresses, were involved in many abiotic stress tolerance mechanisms. The gene Glyma11g09250 was involved in the process of drought tolerance mechanism (Tripathi et al., 2016),and Glyma02g35190 responded to cold stress (Zhang et al., 2014). In addition, after verification by qRT-PCR,as expected, the seven DEGs with the highest expression level under salt stress and seven DEGs with the highest expression level under alkali stress were consistent with the expression level of RNA-seq.
A list of DEGs related to salt and alkali stresses were identified, and GO enrichment analysis indicated that most of DEGs involved in the regulation of salt and alkali stresses had similar functions. Some DEGs specifically expressed under salt stress were enriched for GO term "reproduction", whereas DEGs, which were specifically expressed under alkali stress, were enriched for GO term "multi-organism" and "structural molecule activity". In addition, these subdivision GO terms of DEGs involved in "biological process"indicated that these DEGs might participate in mitosis or purine metabolism in wild soybean. In addition, it was found that some DEGs, which were co-expressed under salt and alkali stresses, were particularly enriched in "enzyme regular activity", "electron carrier activity" and "response to stimulus". These findings indicated that these genes, which were involved in both salt and alkali stresses, participated in complex regulatory processes of plants.
A previous study had shown that many TFs played important roles in certain stages of plant growth and development and were involved in the response to salt and alkali stresses in plants (Gates et al.,2016). Four TFs (AP2-EREBP, MYB, WRKY and NAC) were differentially expressed under salt and alkali stresses. AP2-EREBP TFs were implicated in plant development and hormone-dependent gene expression (Dietz et al., 2010). WRKY TFs were emerging players in plant signaling and had been reported to play important roles in plants under biotic stress (Banerjee and Roychoudhury, 2015). NAC TFs were plant-specific TFs, and more than 100 NAC genes had been identified in Arabidopsis and rice (Nakashima et al., 2012). MYB TF family was divided into four subfamilies, R2R3-MYB, 1R-MYB,R1R2R3-MYB and 4R-MYB (Gao et al., 2017).R2R3-type MYB proteins in plants were reported to be involved in environmental stress responses (Yang et al., 2012). Fourty-eight MYB TFs (Fig. 6), which were differentially expressed under salt and alkali stresses of G. soja, were R2R3-type MYB. The function of MYB TFs had been reported in different model plants (Mondal and Roy, 2017). Moreover,MYB TFs in Arabidopsis and rice were responsive to salt and alkali stresses (Katiyar et al., 2012), and the number of MYB TFs in soybean was similar to that in Arabidopsis but more than that in rice (Tian et al., 2004). MYB TFs had highly conserved amino acid residues-tryptophan (W) in R2 domain and R3 domain. Usually, the first tryptophan residue (W)of R3 domain was replaced by other hydrophobic amino acids, this is the same as phenylalanine (F).These conserved amino acid residues (W and F) were beneficial for maintaining the stability of helix-anglehelix (HTH) structure of MYB TFs (Tombuloglu et al., 2013).
Totally, the expression pattern of 48 MYB TFs showed that the majority of MYB TFs were upregulated under salt and alkali stresses whereas only a few MYB TFs were down-regulated (Fig. 6).Therefore, it was possible that TFs responded to salt and alkali stresses through changes in expression levels, followed by the initiation of the expression of downstream response genes, thereby enhancing the tolerance of plants under salt and alkali stresses.Among 48 MYB TFs, the expression patterns of two MYBs (Glyma07g30860 and Glyma20g34140)occurring under slat stress contrasted those occurring under alkali stress. Glyma07g30860 of G. soja was homologous with AtMYB102 of Arabidopsis thaliana, AtMYB102 was strongly induced by abiotic stress (Denekamp, 2003). The homologous protein of Glyma20g34140 was MYB305. Previous studies found that the gene upstream of NtMYB305 (NtCOI1)was related with Jasmonate (JA) synthesis, JA was known to play an essential role in the regulation of plant stress response (Wang et al., 2014). However, it was unknown whether these genes (Glyma07g30860 and Glyma20g34140) had similar functions in wild soybeans; therefore, it needed to be verified in the future experiments.
Conclusions
In summary, by using RNA-seq, the expression profiles of G. soja under NaCl and NaHCO3stresses were compared. Based on the analysis of DEGs and TFs, potential salt and alkali tolerance genes and novel TFs were identified. These results provided candidate genes and valuable insights for exploring mechanisms underlying the responses of G. soja to salt and alkali stress tolerance.

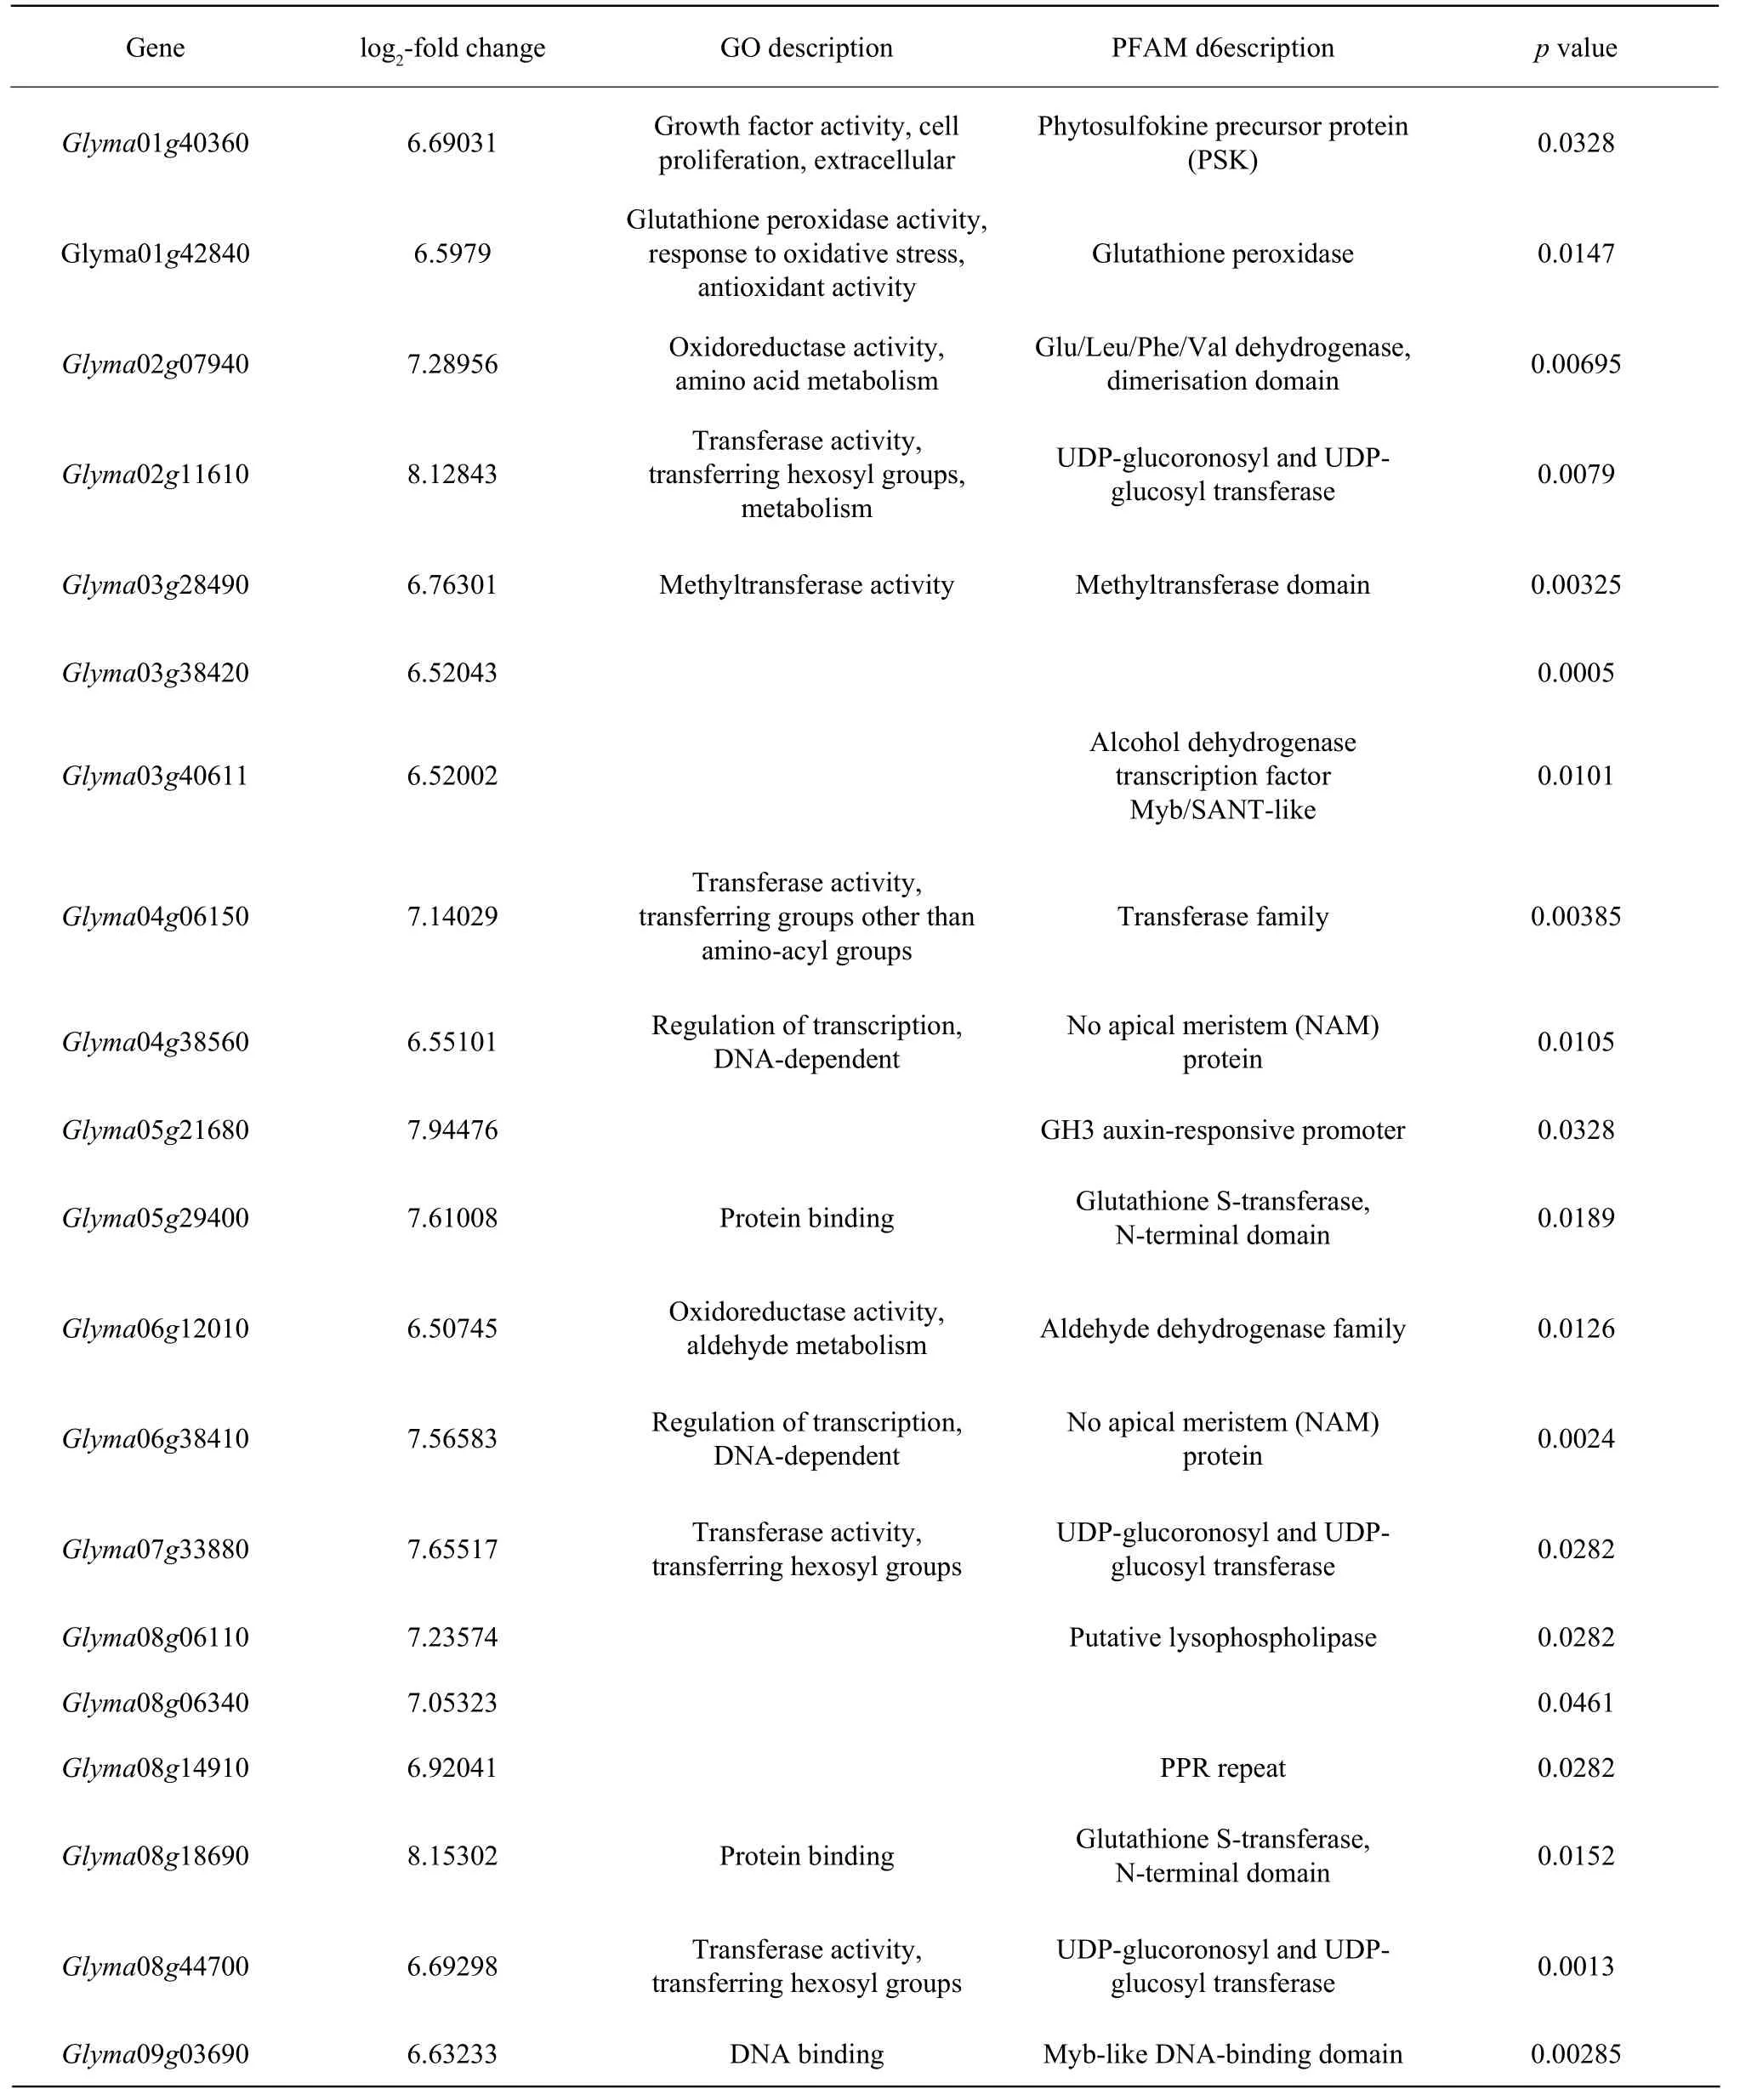
Attached List 1 Top 20 DEGs with the largest fold change under NaHCO3 stress

Attached List 2 Top 20 DEGs with the largest fold change under NaCl stress
杂志排行
Journal of Northeast Agricultural University(English Edition)的其它文章
- Mapping and Candidate Gene Screening of Tomato Yellow Leaf Curl Virus Resistant Gene ty-5
- Mowing Height and Mowing Frequency Interactions on Turf Performance of Kentucky Bluegrass
- Molecular Cloning and Expression Analysis of AcFT3 in Allium cepa
- Screening of Actinomycetes from Medicinal Plant Rhizosphere Soils for Industrial Enzymes and Antimicrobial Activity
- A Novel Bacillus thuringiensis Cry57 Protein Domain Swap In fluence on Insecticidal Activity
- Distribution of Selenium and Mercury in Heilongjiang Province and Its Effect on Body of Beef Cattle
