Subseasonal Change in the Seesaw Pattern of Precipitation between the Yangtze River Basin and the Tropical Western North Pacific during Summer
2018-08-14XinyuLIandRiyuLU
Xinyu LIand Riyu LU∗
1State Key Laboratory of Numerical Modeling for Atmospheric Sciences and Geophysical Fluid Dynamics,Institute of Atmospheric Physics,Chinese Academy of Sciences,Beijing 100029,China
2University of the Chinese Academy of Sciences,Beijing 100049,China
ABSTRACT There is a well-known seesaw pattern of precipitation between the tropical western North Pacific(WNP)and the Yangtze River basin(YRB)during summer.This study identified that this out-of-phase relationship experiences a subseasonal change;that is,the relationship is strong during early summer but much weaker during mid-summer.We investigated the large-scale circulation anomalies responsible for the YRB rainfall anomalies on the subseasonal timescale.It was found that the YRB rainfallis mainly affected by the tropical circulation anomalies during early summer,i.e.,the anticyclonicor cyclonicanomaly over the subtropical WNP associated with the precipitation anomalies over the tropical WNP.During mid-summer,the YRB rainfall is mainly affected by the extratropical circulation anomalies in both the lower and upper troposphere.In the lower troposphere,the northeasterly anomaly north of the YRB favors heavier rainfall over the YRB by intensifying the meridional gradient of the equivalent potential temperature over the YRB.In the upper troposphere,the meridional displacement of the Asian westerly jet and the zonally oriented teleconnection pattern along the jet also affect the YRB rainfall.The subseasonal change in the WNP–YRB precipitation relationship illustrated by this study has important implications for the subseasonalto-seasonal forecasting of the YRB rainfall.
Key words:Yangtze River basin,tropical western North Pacific,precipitation,subseasonal change
1.Introduction
The variability of summer rainfall over the Yangtze River basin(YRB)is affected by circulation anomalies in both the lower and upper troposphere.In the lower troposphere,the anticyclonic(cyclonic)anomaly over the subtropical western North Pacific(WNP)favors enhanced(suppressed)rainfall in the East Asian rainy belt,including the YRB,by modifying water vapor transport(e.g.,Kurihara and Tsuyuki,1987;HuangandSun,1992;Lu,2001a,2001b;LuandDong,2001;Zhou and Yu,2005;Kosaka et al.,2011;Hu et al.,2017).On the other hand,the subtropical WNP anticyclonic(cyclonic)anomaly is induced by the suppressed(enhanced)precipitation anomalies over the tropical WNP,as a result of a Gill response(Lu,2001a).In the upper troposphere,the meridional displacement of the East Asian westerly jet(EAJ)in the midlatitudes,as the leading mode of the interannual variability in upper-tropospheric zonal wind(Li and Lin,2015a;Lin and Lu,2005),also greatly affects the YRB rainfall.A southward(northward)displaced EAJ is favorable for enhanced(suppressed)rainfall over the YRB(Liang and Wang,1998;Lu,2004;Xuan et al.,2011;Du et al.,2016).
The aforementioned studies indicate that both the tropical and extratropical circulation anomalies affect rainfall over the YRB.In addition,there is strong tropical–extratropical interaction over the WNP and East Asia during summer,which is manifested by a meridional teleconnection pattern,frequently referred to as the Pacific–Japan pattern(Nitta,1987)or the East Asia–Pacific pattern(Huang and Sun,1992).Both the enhanced(suppressed)precipitation anomalies over the tropical WNP and EAJ southward/northward displacement are the components of this teleconnection pattern(e.g.,Lau et al.,2000;Lu,2004;Lu and Lin,2009;Lin et al.,2010).Therefore,considering the close relationship in precipitation between the tropical WNP and the YRB,the extratropical circulation associated with the YRB rainfall anomalies may be a response to the tropical heating forcing but does not physically affect the YRB rainfall.
Recently,Li and Lu(2017)investigated the extratropi-cal factors that affect the variability in summer precipitation in the YRB by removing the extratropical anomalies associated with the precipitation variability over the tropical WNP.Through this approach,the extratropical circulation anomalies affecting the YRB rainfall were highlighted.In the lower troposphere,the anomalous northeasterly north of the YRB is found to play an important role in the YRB rainfall.The anomalous northeasterly intensifies the meridional gradient of the equivalent potential temperature over the YRB and favors the YRB rainfall.In the upper troposphere,on the other hand,the meridional displacement of the Asian westerly jet can affect the precipitation in the YRB,while the longitudinal position of the anomalous centers is located westward compared to that related to the precipitation anomalies in the tropical WNP.In addition,the zonally oriented teleconnection pattern along the Asian westerly jet,which is often called the“SilkRoadPattern”(Luetal.,2002;Enomotoetal.,2003;Kosaka et al.,2009;Kosaka et al.,2012;Hong and Lu,2016;Hong et al.,2018),is also found to play an important role in the variability of precipitation over the YRB.Li et al.(2017)also found that the Silk Road Pattern in August,particularly in August of 2016,can affect precipitation over the YRB.
It is well known that the circulations over East Asia during summer experience remarkable subseasonal evolution(e.g.,Ding,1992,2004,2007;Chen et al.,2004;Ding and Chan,2005).Specifically,the subtropical high in the lower troposphere advances northward and retreats eastward(Ding,1992;Lu,2001a;Su and Xue,2010)and the EAJ in the upper troposphere jumps northward(Lin and Lu,2008).These changes in large-scale circulations,as basic mean flows,can affect the extratropical circulation responses to the tropical forces.For instance,Kosaka and Nakamura(2010)reported that the subtropical WNP anticyclonic anomaly forced by identical tropical heat forcing tends to extend northward when the upper-tropospheric westerly jet is located northward.Therefore,it can be inferred that the impact of the precipitation anomalies over the tropical WNP on the YRB rainfall may be different between periods with distinct circulation features—for instance,before and after the northward jump of the EAJ.The main objective of this study is to test this hypothesis,i.e.,to investigate the subseasonal change in the factors affecting the interannual variability of precipitation over the YRB.Actually,rainfall is characterized by a subseasonal step-wise march during summer over East Asia and the WNP(Tao and Chen,1987;Ding,1992;Wu and Wang,2001;Chu et al.,2012;Oh and Ha,2015).In addition,the interannual variation of rainfall in East China also exhibits a subseasonal change during summer(Ye and Lu,2011;Hu et al.,2017).
The rest of this paper is structured as follows:In section 2,the data and methods used in the study are described.Section 3 presents the subseasonal change of the seesaw relationship in precipitation between the tropical WNP and the YRB.In that section,the seesaw relationship is demonstrated to be strong and statistically significant during early summer and becomes weak during mid-summer.Therefore,section 4 further shows the circulation anomalies associated with the interannual variation of the YRB rainfall during early summer and mid-summer.Section 5 provides a summary.
2.Data and methods
The data used in this study include daily data from JRA-55(Kobayashi et al.,2015)and the pentad precipitation data from CMAP(Xie and Arkin,1997).Also used are the daily rainfall data from 824 stations in the China Daily Ground Climate Dataset(Version 3.0),which were developed by the National Meteorological Information Center of the China Meteorological Administration.In this study,we use the daily rainfall data at these stations as prepared by Han et al.(2014),who excluded those stations with large amounts of missing data.Ultimately,the data from 679 stations are available.The analysis period is 1979–2014,and summer(June–August,JJA)is focused on in this study.
We de fine the YRB as the land area that lies 107.5°E eastward and between 27°and 34°N,which is identical to the de finition used in Li and Lu(2017).There are 151 stations evenly located across this region.The precipitation anomalies averaged over these stations are used to represent the Yangtze River Basin Precipitation Index(YRBPI).Figure 1 shows the correlation coefficients between the JJA-mean YRBPI and precipitation based on the CMAP data.Significant positive anomalies appear over the YRB and extend eastward to southern Japan and negative anomalies appear over the tropical WNP.These anomalies confirm the seesaw relationship in precipitation between the YRB and the tropical WNP.We use the precipitation anomalies averaged over the region(10°–20°N,115°–150°E),where the correlation coefficients are basically greater than 0.3,to de fine the WNP precipitation index(WNPPI).The correlation coefficient between the YRBPI and the WNPPI is−0.6,significant at the 99%confidence level.In addition,there are negative anomalies over North China and Northeast Asia.All of these anomalies exhibit the features of the meridional teleconnection,consistent with previous studies(e.g.,Lau et al.,2000;Lu,2004;Li and Lu,2017).

Fig.1.Correlation coefficients between the JJA-mean YRBPI(see text for details)and precipitation.The highlighted region is used to de fine the WNPPI(see text for details).The contour interval is 0.15 and absolute values less than 0.30 are omitted.The zero line is not shown.Shading denotes the 95%confidence level based on the Student’s t-test.Solid line for positive values and dashed line for negative values,and hereafter.
3.Subseasonal change of the YRBPI–WNPPI relationship
Figure 2a shows the three-pentad running correlation between the YRBPI and WNPPI.The YRBPI is basically negatively correlated with the WNPPI during the entire summer,which is expected.However,the seesaw relationship between the YRBPI and the WNPPI exhibits prominent subseasonal change:the YRBPI–WNPPI relationship is significant before the 39th pentad and after the 45th pentad,but it is weak from pentad 39 to pentad 45.
The YRBPI–WNPPI relationship is strongest during pentad 36–38 and weakest during pentad 39–41(Fig.2a),with a correlation coefficient of−0.62 and 0.01,respectively.Figures 2b and c show the spatial distributions of correlation coefficients between the WNPPI and precipitation over China during these two periods,respectively.Significant negative precipitation anomalies appear over the YRB during pentads 36–38(Fig.2b),confirming the seesaw pattern of precipitation between the YRB and the tropical WNP during this period.The correlation coefficients are highest over the lower reaches of the Yangtze River and relatively weak over the middle reaches.By contrast,the anomalies during pentads 39–41 are characterized by very weak anomalies over the YRB(Fig.2c),consistent with the weakest correlation coefficient between the YRBPI and the WNPPI during this period.In addition,positive and negative anomalies appear over South China and North China,respectively.
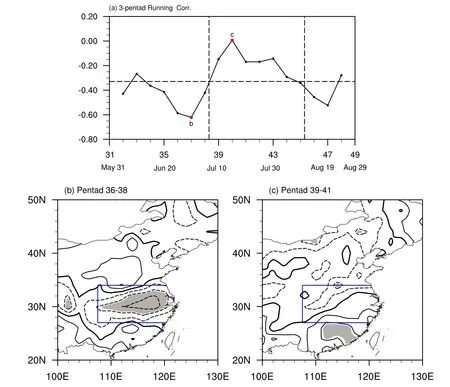
Fig.2.(a)Three-pentad running correlation between the YRBPI and WNPPI.The horizontal dashed line represents the significance of the correlation coefficient at the 95%confidence level according to the Student’s t-test.Here,pentad 31 refers to 31 May to 4 June,and pentad 49 refers to 29 August to 2 September.There are a total of 19 pentads for summer.(b,c)Correlation coefficients between the WNPPI and precipitation at stations in China during(b)pentads 36–38 and(c)pentads 39–41.The highlighted region represents the YRB.The contour interval is 0.15 and the zero line is emboldened.Shading denotes the 95%confidence level based on the Student’s t-test.
The correlation coefficients shown in Fig.2 are obtained by three-pentad running windows.To obtain a more exact period for the subseasonal change of the YRBPI–WNPPI relationship,we analyzed this relationship for each pentad,but only show the results for pentad 39 and pentad 45(Fig.3).During pentad 39(Fig.3a),there are no significant anomalies over the YRB,and negative anomalies mainly appear over the Huanghe–Huaihe River.During pentad 45(Fig.3b),the anomalies over the YRB are also weak.Therefore,pentad 39 and pentad 45 are both considered as in mid-summer,when the YRBPI–WNPPI relationship is weak.In the following,we de fine the period from pentad 31 to 38(from 31 May to 9 July)as early summer and the period from pentad 39 to 45(from 10 July to 13 August)as mid-summer.
4.Anomalies associated with the YRB rainfall in early summer and mid-summer
In the previous section,it was shown that the relationship between the tropical convection and YRB rainfall is strong and significant during early summer but weak during midsummer.Therefore,it can be inferred that the YRB rainfall is affected by tropical factors during early summer but mainly by other factors during mid-summer.In this section,we investigate the anomalies associated with the YRB precipitation in early summer and mid-summer to test this hypothesis.
4.1.Lower-tropospheric anomalies
Figure 4 shows the regression of precipitation with respect to the normalized YRBPI in early summer and midsummer.In early summer,precipitation anomalies expectedly exhibit the seesaw relationship between the YRB and the tropical WNP.There are positive anomalies over the YRB and the positive anomalies also extend eastward to southern Japan and there are negative anomalies over the tropical WNP(Fig.4a).These anomalies are similar to those for the JJA mean(Fig.1).The correlation coefficient between the YRBPI and the WNPPI during this period is−0.66,significant at the 99%confidence level.By contrast,the anomalies over the tropical WNP are sharply reduced in mid-summer and the weak negative and positive anomalies tend to offset one another(Fig.4b).The correlation coefficient between the YRBPI and the WNPPI during this period is only 0.01.These results are consistent with Fig.2a and confirm that the impact of the convection anomalies over the tropical WNP on the YRB rainfall is weak during mid-summer.
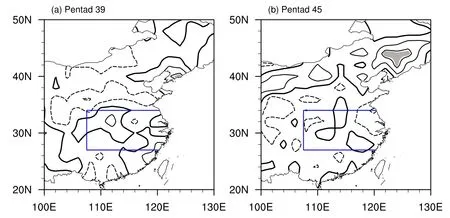
Fig.3.Correlation coefficients between the WNPPI and precipitation at stations in China during(a)pentad 39 and(b)pentad 45.The highlighted region represents the YRB.The contour interval is 0.15 and zero lines are emboldened.Shading denotes the 95%confidence level based on the Student’s t-test.

Fig.4.Regression of precipitation with respect to the normalized YRBPI during(a)early summer(ES)and(b)midsummer(MS).The highlighted region represents the averaging area for the WNPPI.The contour interval is 0.5 mm d−1.The zero line is not shown.The shading denotes the 95%confidence level based on the Student’s t-test.
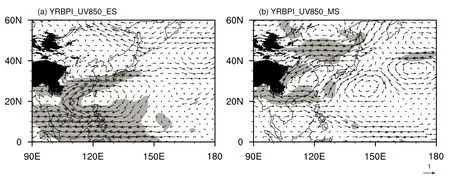
Fig.5.Regression of 850-hPa horizontal winds(vectors;units:m s−1)with respect to the normalized YRBPI during(a)early summer(ES)and(b)mid-summer(MS).Shading indicates that either zonal or meridional wind anomalies are significant at the 95%confidence level.
Figure 5 shows the wind anomalies at 850 hPa regressed onto the normalized YRBPI during early summer and midsummer.The wind anomalies in early summer show a significant anticyclonic anomaly over the subtropical WNP(Fig.5a).The anomalous anticyclone indicates a westward extension of the WNP subtropical high and favors enhanced rainfall over the YRB by transporting water vapor along the northwest flank of the high.The anticyclonic anomaly also corresponds to the negative precipitation anomalies over the tropical WNP(Fig.4a)and this correspondence has become well known as the Pacific–Japan pattern(e.g.,Nitta,1987;Lu,2001a,2001b;Lu and Dong,2001;Kosaka et al.,2011).On the other hand,the extratropical circulation anomalies are weak and insignificant.There are slight northeasterly anomalies north of the YRB,but with marginal significance.These results indicate that the YRB rainfall is mainly affected by the tropical circulation anomalies in early summer.
In mid-summer,the wind anomalies are characterized by a cyclonic anomaly over East China(Fig.5b).Associated with this cyclonic anomaly are the northeasterly anomalies north of the YRB and westerly south of the YRB.Li and Lu(2017)reported that the northeasterly anomalies play a vital role in precipitation anomalies over the YRB by increasing the meridional gradient of equivalent potential temperature(θe)and water vapor accumulation.On the other hand,the anticyclonic anomaly over the subtropical WNP disappears.These results indicate that the YRB rainfall is mainly affected by the extratropical circulation anomalies during midsummer.
To better illustrate the subseasonal change in the impact of the northeasterly anomalies on the YRB rainfall,we use the northeasterly anomalies averaged over the region(32.5°–40°N,107.5°–120°E)to de fine a northeasterly index(NEI):

Here,Aaveis the area average,and u and v are the zonal and meridional wind anomalies at 850 hPa,respectively.This definition is similar to that in Li and Lu(2017),who used the 700-hPa wind anomalies.We also de fined the NEI at 700 hPa and obtained similar results.
Figure 6 shows the 15-day running correlation coefficient between the YRBPI and the NEI.The YRBPI–NEI relationship is weak and insignificant during early summer and becomes strong and significant during mid-summer.The correlation coefficient between the YRBPI and the NEI is 0.27 during early summer and 0.51 during mid-summer,confirmingthat the impact of the northeasterly anomalies on the YRB rainfall is enhanced during mid-summer.

Fig.6.Fifteen-day running correlation between the YRBPI and the NEI(see text for definition).The horizontal dashed line represents the significance of the correlation coefficient at the 95% confidence level according to the Student’s t-test.
It is well known that the mei-yu rainfall over the YRB is characterized by a strong humidity gradient in the lower troposphere.Therefore,the equivalent potential temperature(θe),which combines the temperature and humidity,is widely used in mei-yu rainfall analyses(e.g.,Zhu et al.,2000;Ninomiya,2000;Zhou et al.,2004;Ding,2005;Park et al.,2015;Chen and Zhai,2015).A higher θevalue indicates a warmer and more humid weather condition.Climatologically,the θedecreases with latitude over East China and shows a strong meridional gradient over the YRB during summer(not shown),which favors the enhanced precipitation there by inducing convection instability(e.g.,Ninomiya,1984;Ninomiya and Shibagaki,2007).
Figure 7 shows the θeanomalies at 700 hPa with respect to the normalized YRBPI during early summer and midsummer.The significant precipitation and wind anomalies are also shown to facilitate comparison.The right-hand panels show the corresponding meridional gradient anomalies of θe,averaged over 107.5°–120°E.A positive value indicates the decrease in θein the northward direction,i.e.,the intensified θegradient.Forearly summer(Fig.7a),there are positive θeanomalies over the YRB and negative θeanomalies north of the YRB,which enhance the meridional gradient of the θeover the YRB.The difference in θeanomalies between the southern edge[averaged over(27.5°N,107.5°–120°E)]and the northern edge[averaged over(33.75°N,107.5°–120°E)]of the YRB is 0.82 K,which is 9%of the climatological difference during this period(9.34 K).The enhanced θegradient anomalies(right-hand panel of Fig.7a)agree well with the enhanced precipitation anomalies,but show a slight northward shift compared to that of precipitation.This northward shift,as explained by Li and Lu(2017),is due to the northward tilt of the enhanced gradient with height in the lower troposphere.In addition,the anomalous south westerlies correspond to the positive θeanomalies over the YRB,which suggests that the tropical circulation anomalies are responsible for the intensified θegradient over the YRB and the associated enhanced precipitation.
In mid-summer(Fig.7b),there are positive anomalies south of the YRB.A sharp contrast to the early summer is the enhancement of the negative anomalies north of the YRB.These positive and negative anomalies enhance the meridional gradient of θeover the YRB.The difference in θeanomalies between the southern and northern edges of the YRB is 1.67 K,and this increase is about 68%of the climatological difference during this period(2.47 K).The enhanced θegradient is also in agreement with the enhanced precipitation.In addition,the circulation anomalies also correspond well to the θeanomalies.Enhanced northeasterlies north of the YRB correspond to the negative θeanomalies,and south westerlies south of the YRB correspond roughly to the positive θeanomalies.
To better illustrate the correspondence between the rainfall and θe,we choose the years in which the absolute values of the YRBPI are greater than 0.7 standard deviations and perform composite analyses based on these years,for both early summer and mid-summer.Table 1 shows the positive and negative cases based on this criterion.Besides the criterion of 0.7 standard deviations shown here,we also used some other criteria,such as 0.8 standard deviations or 1.0 standard deviation,and obtained similar results(not shown).
Figure 8 shows the 700-hPa θeand rainfall for positive and negative YRBPI cases during early summer and midsummer.For all categories,the high θevalues stretch from southwest to northeast in a tongue-shaped pattern,which is induced by the warm and moist air transported by the south westerlies associated with the subtropical high.The θedecreases with latitude over the north of the tongue and shows a maximum meridional gradient over the northeast of thetongue,corresponding to the heavy rainfall there.

Table 1.Cases for different categories of the YRBPI in early summer(ES)and mid-summer(MS).σ denotes the standard deviation of the YRBPI.

Fig.7.Regression of 700-hPa θeanomalies with respect to the normalized YRBPI during(a)early summer(ES)and(b)mid-summer(MS).The contour interval is 0.2 K and the zero line is not shown.Shading denotes the 95%confidence level based on the Student’s t-test.The scopes(red lines)of the significant positive precipitation anomalies and the significant wind anomalies at 700 hPa are also given for comparison.Precipitation anomalies are based on the station data.The curves in the right-hand panels show the corresponding meridional gradient anomalies(units:10−3K km−1)of θe,which are averaged over 107.5°–120°E.

Fig.8.Composite 700-hPa θe(contour interval:2.0 K)and precipitation(shading;units:mm d−1)over East China in the(a,c)positive and(b,d)negative YRBPI cases for(a,b)early summer(ES)and(c,d)mid-summer(MS).Precipitation anomalies are based on the station data.
However,the distributions of θeare distinct between the positive and negative cases.For early summer,the warm and moist tongue is located over South China in the positive cases and the maximum meridional gradient of θeappears over the YRB(Fig.8a),which corresponds well to the heavy precipitation there.For the negative cases(Fig.8b),the tongue retreats southward and the meridional gradient of θeover the YRB is reduced,in agreement with the rain band appearing over South China and precipitation being less over the YRB.
In contrast to early summer,the meridional scope of the high θe,or the warm and moist tongue,becomes wider and moves northward during mid-summer for both positive and negative cases(Figs.8c and d versus Figs.8a and b),which is consistent with the subseasonal march of the θeover East Asia during summer.As a result,the θegradient over the YRB is greatly reduced,corresponding to the reduced precipitation over the YRB and increased precipitation over North China.This phenomenon is associated with the northward advance of the subtropical high.During mid-summer,the distributions of θeare also distinct between the positive and negative cases.For the positive cases,the high θeappears over South China,and largeθegradient appears over the YRB(Fig.8c),corresponding to the high precipitation there.By contrast,the scope of high θeis extended,occupying both South China and the YRB,and the location of the high θegradient moves northward for the negative cases(Fig.8d),corresponding to the heavier rainfall over North China but less rainfall over the YRB.These θedistributions are consistent with the lower-tropospheric circulations:the anomalous northeasterlies prevent the subseasonal march over East China for the positive cases in comparison with the negative cases.
The above results demonstrate that the relationship in precipitation between the tropical WNP and the YRB rainfall is strong during early summer but weak during mid-summer.In the following,we analyze the anomalies associated with the rainfall over the tropical WNP,in an attempt to illustrate the reason for the weakened impact of the precipitation anomalies over the tropical WNP on the YRB rainfall during midsummer.Figure 9 shows the 850-hPa horizontal wind and precipitation anomalies regressed onto the normalized neg-ative WNPPI during early summer and mid-summer.Here,the anomalies associated with the negative WNPPI are shown to facilitate comparison with the anomalies that are favorable for the enhanced YRB rainfall(Fig.5).The anomalies over East China are highlighted in the bottom panels.For both early summer and mid-summer,there are negative precipitation anomalies over the tropical WNP(Figs.9a and b).The negative precipitation anomalies induce the meridional teleconnection pattern over the WNP and East Asia,i.e.,the anticyclonic/cyclonic/anticyclonic anomalies over the region from the tropics to high latitudes,which has been well reportedin previous studies(Nitta,1987;HuangandSun,1992;Lau et al.,2000;Lu,2001b;Lu and Dong,2001;Kosaka et al.,2011).However,there is an appreciable difference between early summer and mid-summer:the WNP anticyclonic anomaly trenches further northward during mid-summer than in early summer(Figs.9b and d versus Figs.9a and c).The northern boundary of the anomalous anticyclone is located around 30°N during early summer(Figs.9a and c)and is similar to the location of the WNP anticyclonic anomaly that favors the YRB rainfall(Fig.5a),which indicates there is water vapor convergence over the YRB.Accordingly,significantly enhanced precipitation appears over the East Asian rainy belt,including the YRB.Meanwhile,the northern boundary of the WNP anticyclonic anomaly reaches around°N during midsummer(Figs.9b and d),which suggests that water vapor is transported further northward into the Huaihe River region,and there is less water vapor convergence over the YRB during this period.Accordingly,the enhanced rainfall anomalies tend to move northward in East China and are much weaker over the YRB(Figs.9b and d).It should be mentioned that the rainfall anomalies over the tropical WNP during early summer and mid-summer are roughly similar,for both the scope and amplitude(Figs.9a and b).The northward extension of the subtropical WNP anticyclonic anomaly during mid-summer can be explained by the results of Kosaka and Nakamura(2010),who indicated that identical tropical heat forcing can trigger a northward-extended cyclonic anomaly over the subtropics when the upper-tropospheric westerly jet axis,as the basic flow,is located northward.During sum-mer over East Asia,the upper-tropospheric westerly jet experiences a northward shift(Lin and Lu,2008).Therefore,the subtropical WNP anticyclonic anomaly extends northward during mid-summer,in comparison with early summer.A similar northward extension of the WNP anticyclonic anomaly,associated with the preceding wintertime ENSO,has been found in previous studies(Ye and Lu,2011;Hu et al.,2017).

Fig.9.Regression of the 850-hPa horizontal winds(vectors;units:m s−1)and precipitation(shading;units:mm d−1)with respect to the normalized negative WNPPI during(a,c)early summer(ES)and(b,d)mid-summer(MS).The color shading in(a,b)is based on the CMAP data.The anomalies over East China are magnified in the bottom panels(c,d)and color shading is based on the station precipitation data.The black shading represents mountains higher than 1500 m.Red lines refer to 30°N.The dots denote the 95%confidence level for precipitation anomalies based on the Student’s t-test,and only the vectors of either zonal or meridional wind anomalies significant at the 95%confidence level are shown.
4.2.Upper-tropospheric anomalies
Figure 10 shows the zonal and meridional wind anomalies at 200 hPa regressed onto the normalized YRBPI during early summer and mid-summer.In early summer,there are significant anomalies over the tropical WNP for both zonal and meridional winds(Figs.10a and c),and the extratropical anomalies are very weak and insignificant, consistent with thelower-tropospheric circulation anomalies(Fig.5a).These results confirm that the precipitation anomalies over the YRB are mainly affected by the tropical circulation anomalies in early summer.
By contrast,the anomalies in mid-summer mainly appear over the extratropical regions(Figs.10b and d).For the zonal wind anomalies,there are significant positive anomalies south of the jet axis and significant negative anomalies north of the jet axis over West Asia and East Asia(Fig.10b),suggesting a southward displacement of the westerly jet in these regions.The zonal wind anomalies are remarkably weaker over Central Asia.On the other hand,the meridional wind anomalies show a zonally oriented teleconnection pattern along the westerly jet,or the Silk Road Pattern(Fig.10d).These zonal and meridional wind anomalies resemble the JJA-mean results of Hong and Lu(2016),who suggested the connection between the jet axis displacement and the Silk Road Pattern.Furthermore,these upper-tropospheric circulation anomalies suggest a cyclonic anomaly over East Asia,and this cyclonic anomaly shifts poleward compared to its counterpart in the lower troposphere(Fig.5b).The meridional displacement of the EAJ and the Silk Road Pattern have been documented as the mainly extratropical circulation anomalies that affect the YRB rainfall for the JJA mean(Li and Lu,2017).Here,we show that these anomalies mainly affect the YRB rainfall during mid-summer.The anomalies over the tropical WNP are very weak for both the zonal and meridional wind,consistent with the weak relationship in rainfall between the tropical WNP and the YRB.
5.Conclusions
It is well known that summer precipitation over the YRB is negatively correlated with that in the tropical WNP.In this study,we show that this out-of-phase relationship experiences a subseasonal change.This relationship is strong during early summer and becomes weak during mid-summer,which suggests that the factors affecting the YRB rainfallalso experience a subseasonal change.According to the change in the relationship,we de fine the early summer as pentad 31 to pentad 38(31 May to 9 July)and mid-summer as pentad 39 to pentad 45(10 July to 13 August)and investigate the circulation anomalies associated with the YRB rainfall in these two periods,respectively.

Fig.10.Regression of the 200-hPa(a,b)zonal and(c,d)meridional winds with respect to the normalized YRBPI during(a,c)early summer(ES)and(b,d)mid-summer(MS).The bold black lines represent the corresponding climatological jet axis for ES and MS.The contour intervals are 0.5 and 0.3 m s−1for the zonal and meridional wind anomalies,respectively.The zero contour lines are not shown.Shading denotes the 95%confidence level based on Student’s t-test.
The results show that the YRB rainfall is mainly affected by the subtropical circulation anomalies during early summer.The precipitation anomalies over the tropical WNP induce the anticyclonic or cyclonic anomaly over the sub-tropical WNP.The subtropical WNP anticyclonic(cyclonic)anomaly corresponds to a westward extended(eastward retreated)subtropical high and exerts an in fluence on the YRB rainfall by modulating the water vapor transport along the northwest flank of the high,as previous studies suggested.During mid-summer,meanwhile,the YRB rainfall is mainly affected by the extratropical circulation anomalies in both the lower and upper troposphere,and the impact of the tropical circulation anomalies is weakened.The extratropical circulation anomalies manifest as northeasterly anomalies north of the YRB in the lower troposphere.These northeasterly anomalies greatly intensify the meridional gradient of the θeover the YRB and result in enhanced rainfall there during mid-summer.In addition,the meridional displacement of the Asian westerly jet and the zonal teleconnection pattern along the jet in the upper troposphere also play a role in the YRB rainfall during mid-summer.
The weakened impact of the subtropical circulation anomalies on the YRB rainfall during mid-summer is due to the more northward extension of the subtropical WNP anticyclonic/cyclonic anomaly associated with the tropical WNP precipitation,which leads to the northward shift of associated rainfall anomalies in East China and results in weak precipitation anomalies over the YRB.Therefore,the subtropical WNP anticyclonic/cyclonic anomaly,which is closely associated with the tropical forcing,affects precipitation in the different regions between early summer and mid-summer.
This study illustrates the different factors affecting YRB rainfall between early summer and mid-summer.These factors,including both tropical and extratropical ones,may exhibit multiple time scales.Previous studies have documented that intraseasonal oscillations can significantly affect rainfall,especially persistent heavy rainfall events,in East Asia,including the YRB(e.g.,Mao and Wu,2006;Yun et al.,2008;Mao et al.,2010;Cao et al.,2012;Ren et al.,2013,2015;Li et al.,2015;Sun et al.,2016;Li et al.,2018;Wei et al.,2017;Wang et al.,2018).Besides intraseasonal oscillations,synoptic-and mesoscale disturbances can also affect YRB rainfall.It would be interesting to investigate whether these oscillations and disturbances exhibit distinct features of in fluence between early summer and mid-summer.
Current climate models show a high skill in the seasonal forecasting of summer precipitation over the tropical WNP(Li et al.,2012,2014;Lu et al.,2012;Kosaka et al.,2013),providing an encouraging basis for reliable YRB rainfall forecasting,which is of great concern in China(Li and Lin,2015b;Li et al.,2016).However,our results suggest that this tropical basis for the forecasting of YRB rainfall may be valid only in early summer.For mid-summer,extratropical circulation anomalies should be emphasized.Therefore,different factors should be considered between the different episodes of summer to achieve better subseasonal-to-seasonal predictions of YRB rainfall.
Acknowledgements.We thank Dr.Yunhuan HAN and Ms.Yawen DUAN for offering the screened daily station rainfall data.We also thank the two anonymous reviewers for their comments,which were helpful in improving the presentation.This work was supported by the National Natural Science Foundation of China(Grant No.41320104007).
杂志排行

Advances in Atmospheric Sciences的其它文章
- Circulation Features Associated with the Record-breaking Typhoon Silence in August 2014
- Investigating the Initial Errors that Cause Predictability Barriers for Indian Ocean Dipole Events Using CMIP5 Model Outputs
- Assimilation of Sea Surface Temperature in a Global Hybrid Coordinate Ocean Model
- Possible Sources of Forecast Errors Generated by the Global/Regional Assimilation and Prediction System for Landfalling Tropical Cyclones.Part II:Model Uncertainty
- High-Order Statistics of Temperature Fluctuations in an Unstable Atmospheric Surface Layer over Grassland
- Impact of Global Oceanic Warming on Winter Eurasian Climate