Seasonal phenology of the heterotrophic dino flagellate Noctiluca scintillans (Macartney) in Jiaozhou Bay and adjacent coastal Yellow Sea, China*
2018-08-02WANGWeicheng王卫成SUNSong孙松SUNXiaoxia孙晓霞ZHANGFang张芳ZHANGGuangtao张光涛ZHUMingliang朱明亮
WANG Weicheng (王卫成) SUN Song (孙松) SUN Xiaoxia (孙晓霞) ZHANG Fang (张芳) ZHANG Guangtao (张光涛) ZHU Mingliang (朱明亮)
1 Key Laboratory of Marine Ecology and Environmental Sciences, Institute of Oceanology, Chinese Academy of Sciences,Qingdao 266071, China
2 Jiaozhou Bay Marine Ecosystem Research Station, Institute of Oceanology, Chinese Academy of Sciences, Qingdao 266071,China
3 University of Chinese Academy of Sciences, Beijing 100049, China
4 Laboratory for Marine Ecology and Environmental Science, Qingdao National Laboratory for Marine Science and Technology,Qingdao 266071, China
Abstract Seasonal variations in numerical abundance, cell diameter and population carbon biomass of the heterotrophic dino flagellate Noctiluca scintillans were studied for 10 years from 2004 to 2013 in Jiaozhou Bay and adjacent coastal Yellow Sea, China, and their ecological functions were evaluated. In both areas, N. scintillans occurred throughout the year and demonstrated an essentially similar seasonality;the cell abundance increased rapidly from the winter minimum to an annual peak in late spring and early summer, and decreased gradually toward the autumn-winter minimum. The peak abundance differed by years, and there was no consistent trend in long-term numerical variations. The cell diameter also showed a seasonal fluctuation, being larger in spring and early summer than the other seasons. Estimated carbon biomass of N. scintillans population reached to a peak as high as 90.3 mg C/m 3, and occasionally exceed over phytoplankton and copepod biomass. Our results demonstrate that N. scintillans in northwestern Yellow Sea displays the seasonal phenology almost identical to the populations in other temperate regions, and play important trophic roles as a heterotroph to interact with sympatric phytoplankton and copepods.
Keyword: cell size; biomass; copepods; phytoplankton; ZooScan
1 INTRODUCTION
In recent decades, the frequency of occurrence,intensity and geographical range of harmful algal blooms (HABs) have increased worldwide(Hallegraeff, 1993; Anderson, 1997; Glibert et al.,2005; Anderson, 2009). HABs have received wide attention because they are harmful to coastal ecosystems, fisheries, aquaculture, and even to human health (Huang and Qi, 1997; Mohanty et al., 2007).Hence, monitoring, predicting and mitigating of HAB events have become very signi ficant research topics and effective management is of vital importance for prevention and/or reduction of the ecological as well as economical losses caused by the HABs.

Fig.1 Map of study area with location of sampling stations in Jiaozhou Bay (St. 5) and coastal Yellow Sea (St. 10)
Noctiluca scintillans, hereafter referred to as Noctiluca, is a large-sized heterotrophic and omnivorous dino flagellate, which is one of the causative species of HABs and distributed widely over temperate and tropical coastal waters, and frequently blooms massively to cause negative impacts on the marine ecosystems (Huang and Qi,1997; Elbrächter and Qi, 1998; Tseng et al., 2011).This species is phagotrophic and capable of ingesting a broad range of food items: phytoplankton, detritus,protozoans, bacteria, copepod eggs and larvae, fish eggs (Daan, 1987; Kirchner et al., 1996; Tiselius and Kiørboe, 1998; Frangópulos et al., 2011; Isinibilir et al., 2014), and such a feeding habit may facilitate more extensive and more frequent blooms in eutrophic waters (Mohamed and Mesaad, 2007; Mohanty et al.,2007; Harrison et al., 2011; Turkoglu, 2013).
The first HAB event caused by Noctiluca in China was reported in 1933 in Zhejiang coastal waters(unpublished data of Fei H.N., cited in Zhou et al.,2008). The magnitude, frequency and geographical range of Noctiluca blooms along Chinese coast have increased in recent years. In the Changjiang (Yangtze)River estuary, for example, a single Noctiluca red tide was reported to occur in an area of only 10 km2in August 1982, but the area widened to 6 100 km2in August 1988 (Huang and Qi, 1997; Qi et al., 1993).To date, many investigations of Noctiluca, such as the spatial and temporal distributions, and mechanisms for the population variations, have been carried out in the South China Sea (Huang and Qi, 1997; Yin, 2003),the Changjiang River estuary, and the East China Sea(Zhou et al., 2008; Tseng et al., 2011). Although,HAB events caused by Noctiluca have been recorded in coastal waters of northeast China, e.g. the Yellow Sea (Tang et al., 2006; Yuan et al., 2016) and the Bohai Sea (Wu et al., 2013; Song et al., 2016), the population dynamics and ecological roles of this species have been rarely studied in these areas.
Jiaozhou Bay, a shallow semi-enclosed bay (area:390 km2, average depth: 7 m) located on the southern coast of the Shandong Peninsula, China, and the adjacent coastal Yellow Sea constitute traditionally a productive fishing ground as well as a spawning and nursery area of local fish and shrimp populations (Jin et al., 2010; Sun et al., 2011a; Tang et al., 2016). At least 10 small rivers, most of which connect to trenches of industrial effluent and sewage treatment plants from Qingdao City flow into Jiaozhou Bay, so that eutrophication became prominent in recent decades. In addition, Jiaozhou Bay was impacted heavily by various human activities both in and around the bay (e.g., reclamation, bridge construction,industry, agriculture and aquaculture), and the ecosystem of the bay has been greatly degraded(Shen, 2001; Yuan et al., 2016). Since the beginning of the 1990s, HAB events, including ones by Noctiluca, have become prominent in and around Jiaozhou Bay (Wu et al., 2005; Liu et al., 2009; Yuan et al., 2016), and in 2000 the largest Noctiluca red tide took place to cause severe damage in bivalve aquaculture (Wu et al., 2005). Noctiluca constitutes the large part of the plankton community, particularly in spring and early summer, but its detailed seasonal variations in numerical abundance and cell size have been poorly investigated.
Taking views of an increasing population size of Noctiluca in human-perturbed coastal ecosystem into consideration (Gai et al., 2012), it is important to investigate the mechanisms for the seasonal population dynamics and trophic roles of this heterotrophic dino flagellate species in Jiaozhou Bay and the adjacent coastal Yellow Sea. In this paper, we describe changes in the cell numerical density, cell size, population carbon biomass of Noctiluca based on 10-year observations-collected zooplankton samples, and discuss its trophic relationship to phytoplankton and copepods.
2 MATERIAL AND METHOD
2.1 Zooplankton sampling
Zooplankton samples used in this study were collected with vertical tows of a conical plankton net(mouth diameter: 31.6 cm, mesh size: 160 μm) from near the bottom to the surface at two stations, St. 5(36°06′00″N, 120°15′00″E) in southern Jiaozhou Bay(depth: 15 m) and St. 10 (35°59′00″N, 120°25′30″E)in coastal Yellow Sea (depth: 18 m) in the vicinity of the mouth of Jiaozhou Bay, monthly from February 2004 to December 2013 (excluding no sampling period from January to May, 2011, Fig.1). The samples were immediately preserved in 5% neutralformaldehyde seawater solution. At the same time,the sea surface temperature (SST) and salinity (SSS)were determined by MiniPack CTD-F (Chelsea Technologies Group, England) from January 2004 to October 2007 and AAQ 1183-1F CTD (Alec Electronics Co., Japan) from November 2007 to December 2013.Chlorophyll a (Chl a) concentration was determined fluorometrically with a Turner Designs model-10 fluorometer (Parsons et al., 1984) for seawater taken with a rosette sampler near the surface. However, the temperature and salinity data were available only seasonally (i.e. February, May, August and November)from 2004 to 2006, and Chl a data in 2004, because of limited hydrographic surveys in these years.
2.2 Zooplankton analysis
The preserved zooplankton samples were subjected to image analysis using a Hydroptic ZooScan (http://www.zooscan.com). Subsamples of 1/4 to 1/64 of the original samples, containing ca. 1 000 individuals,were scanned in the scanning cell with a transparent frame (11 cm×24 cm) and digitized at 4 800 dpi resolution according to the protocol (Schultes and Lopes, 2009),and analyzed by the program called Zooprocess(Grosjean et al., 2004). Zooplankton specimens with an equivalent spherical diameter (ESD) >300 μm were counted and identi fied to major taxonomic groups. For N octiluca, cell diameter was also determined assuming that the cells are spherical, and crumpled cells, usually fewer than 2% of the total cell numbers, were excluded.Cell carbon content was estimated from a regression equation determined by Miyaguchi et al. (2006):C=0.24×ln( V)–3.71, where C is cell carbon content(μg C/cell) and V is cell volume (μm3/cell). Copepods were also enumerated and their carbon content was obtained by an equation: C=0.165+0.069 5 V, where C and V are carbon content (mg C/copepod) and body volume (mm3/copepod), respectively (Alcaraz et al.,2003). In addition, the carbon biomass of phytoplankton was calculated from Chl a, assuming a C/Chl a ratio of 56.5, which was determined for seston samples from eutrophic Seto Inland Sea, Japan (Tada and Morishita,1997). The speci fic growth rate of the Noctiluca population was calculated for a prominent growth period (the sampling data preceding the month with maximum abundance as the start point) of each year by: μ(/d)= ln( Nt/ N0)/ t, where N0and Ntare the observed cell density at the beginning and end of the period, and t (days) is the duration.
2.3 Data analysis
Spearman correlation analysis was used to assess the relationship between Noctiluca abundance and environmental factors. Regression analysis was applied to the analysis of Noctiluca cell size with the environment factors. Monthly differences of Noctiluca cell diameter were compared using one-way analysis of variance (ANOVA) and Fisher’s protected leastsquares difference (PLSD) method, and difference in the same month between the two stations were analyzed by t-test.
3 RESULT
3.1 Environmental variables
The surface temperature at Sts. 5 and 10 showed marked seasonal fluctuations ranging generally between 3 and 28°C; the annual fluctuation was slightly wider at St. 5 than at St. 10 (Fig.2a). The salinity varied also on a seasonal basis; it was higher than 31 from January to June, but lower and more variable from July to September due to seasonal rain falls, which caused extremely low salinity (19.8) in August, 2007 (Fig.2b). Mean salinity from July to September was slightly lower at St. 5 (29.6) than at St. 10 (30.4). The Chl a concentration fluctuated more widely, and the annual peak concentrations were higher at St.5 compared to St.10, but the seasonal pattern was basically similar each other, being low and less variable in autumn and winter, and high and more variable in spring and summer (Fig.2c).
3.2 Abundance, cell diameter and carbon biomass of Noctiluca
Noctiluca repeated an almost similar seasonal fluctuation per annum for 10 years at respective stations (Fig.3a), and hence the 10-year average abundance in each month is shown in Fig.3b. It started to increase in February, followed by a rapid increase to an annual maximum in April (16.4×10³and 18.6×10³cells/m3at Sts. 5 and 10, respectively),maintaining high densities until June, and then abruptly declined from July onward. The average density during the period from November to January was low (53 and 112 cells/m3at Sts. 5 and 10,respectively). Noctiluca multiplied faster in early spring at St. 10 compared to the population at St. 5,where it maintained higher densities for longer period after the annual peak in April (Fig.3b). In this study,Noctiluca cell densities greater than 25×103cells/m3were usually observed when temperatures ranged from 3.4 to 15°C, salinity from 30.4 to 32 and Chl a lower than 2.35 μg/L (Fig.4). The intrinsic growth rate of the population was calculated in each year except for 2011; it ranged from 0.04 to 0.17/d with mean of 0.10/d at St. 5, and from 0.01 to 0.25/d with mean of 0.12/d at St. 10 (Table 1).

Fig.2 Temporal variations in surface (a) temperature, (b) salinity and (c) chlorophyll a concentration at Sts. 5 and 10 from February 2004 to December 2013

Fig.3 Temporal variations in abundance of Noctiluca scintillans at Sts. 5 and 10 from February 2004 to December 2013 (a);monthly average abundance at Sts. 5 and 10 (b)
The cell diameter changed seasonally, with wider variations at St. 10 than at St. 5 (Fig.5a). The average diameter differed signi ficantly by month at each station (ANOVA: F11,4820=98.4, P <0.001 at St. 5, F11,5592=184.6, P <0.001 at St. 10, Table 2, Fig.5b); it was larger from March to June (peak period) than in the remaining months ( t-test: P <0.01 at St. 5, P <0.01 at St. 10, Table 3). The average cell diameter between the stations was compared in each month, and the result of t-test showed that it was signi ficantly( P <0.01) larger at St.10 than St.5, except in September and December (Table 2). The carbon biomass of Noctiluca exhibited a sharp annual peak usually between April and June, but also showed occasionally peaks in autumn (Fig.6). The highest carbon biomass(90.3 mg C/m3) was recorded at St. 5 in June of 2004,and the maximum biomass (57.9 mg C/m3) was observed at St.10 in April of 2008.

Table 1 Intrinsic growth rate (/d) of N. scintillans,calculating for a prominent growth period of each year at Sts. 5 and 10 from 2004 to 2013

Fig.4 The relationship between abundance of Noctiluca scintillans and surface water temperature (a), salinity (b) and chlorophyll a concentration (c) during the study period

Fig.5 Temporal variations in N. scintillans cell diameter at Sts. 5 and 10 from February 2004 to December 2013 (a); monthly average cell diameter at Sts. 5 and 10 (b)

Table 2 Comparison of monthly average cell diameter of N.scint i llans between Sts. 5 and 10
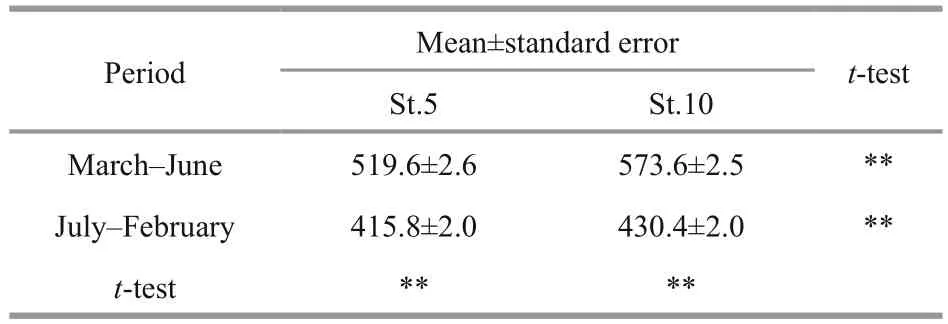
Table 3 Comparison of average cell diameter of Noctiluca sci ntillans between the peak periods (March–June)and other time (July–February) at Sts. 5 and 10

Fig.6 Temporal variations in carbon biomass of N. scintillans at Sts. 5 and 10 from February 2004 to December 2013
3.3 Abundance and carbon biomass of copepods
Copepod abundance and biomass exhibited similar seasonal trends, generally attaining an annual peak during the period between April and June, and then abruptly declined to the minimum level from September to January at respective stations (Fig.7).The maximum copepod abundance and biomass recorded at St. 5 were 24 727 ind./m3and 80.5 mg C/m3, respectively, and the maximum values at St. 10 were 19 350 ind./m3and 134.9 mg C/m3, respectively.
3.4 Relationship between Noctiluca and environmental factors
It was assumed that the factors controlling growth of Noctiluca are more obvious during the period with peak densities. During the peak period (abundance>25×103cells/m3), no signi ficant correlation was observed between Noctiluca abundance and temperature and salinity (Table 4). The abundance of N octiluca was signi ficantly ( P <0.05) negative correlated with Chl a. Analysis the relationship between Noctiluca abundance and the biomass of copepods revealed a signi ficant ( P <0.05) positive correlation.
In the decadal study, there were signi ficantly correlations between environmental variables (i.e.temperature and Chl a) and cell size (Fig.8).Speci fically, a quadratic regression was observed between temperature and Noctiluca cell size (Fig.8a).In addition, Chl a were signi ficantly negative correlated with Noctiluca cell size (Fig.8b).

Table 4 Correlation analysis of N. scintillans abundance in the peak period (abundance >25×10 3 cells/m 3) with environmental factors in Jiaozhou Bay and adjacent coastal Yellow Sea
4 DISCUSSION
4.1 Seasonal dynamics of Noctiluca
As a result of similar environmental conditions in Jiaozhou Bay and adjacent Yellow Sea, the Noctiluca populations at respective sampling stations showed almost similar seasonal patterns for 10 years from 2004 to 2013 without any detectable long-term trend.Every year, they regularly bloomed in spring and early summer, usually attaining an annual peak in April. These seasonal patterns were consistent with the results that had been reported previously in many temperate coastal waters (Tada et al., 2004; Miyaguchi et al., 2006; Mikaelyan et al., 2014).

Fig.7 Temporal variations in (a) abundance and (b) biomass of copepods at Sts. 5 and 10 from January 2004 to December 2013
In the present study, environmental variables, such as temperature and salinity were considered to in fluence the seasonal variation of Noctiluca. Water temperature and salinity during the spring was considered the optimum range from 3.4 to 15°C and 30.4 to 32, respectively. Previous studies reported that the optimum temperature and salinity ranges for Noctiluca were 10–28°C and 28–36 (Huang and Qi,1997; Tada et al., 2004; Miyaguchi et al., 2006). At our study sites, the Noctiluca cell density remained at the lowest level until water temperature warmed to 3.4°C, and culminated the annual peak at ca. 10°C.This lowest temperature to trigger the population increase and the temperature range to sustain the annual blooms seem to be lower compared to those in other locations (Table 5), which might be attribute to adaptation by local Noctiluca populations to colder temperatures in the northern Yellow Sea. It was assumed that the factors controlling growth of Noctiluca are more obvious during the peak period(Mikaelyan et al., 2014). Noctiluca abundance in this study showed a negative correlation, though not signi ficant, with water temperature during the bloom period (Table 4, Fig.4a), which have also been recorded in the Indian Ocean (Mohanty et al., 2007).Many studies have reported the low abundances of Noctiluca during the summer period, and it was probably due to high water temperatures since the growth rate of Noctiluca drastically decreased when water temperature above 25°C (Huang and Qi, 1997;Tada et al., 2004; Dela-Cruz et al., 2008). In this study, we found that Noctiluca was rare or absent in the samples during the summer period, especially when water temperatures were as high as 26°C.Huang and Qi (1997) reported that Noctiluca occurred within the salinity range from 19.1 to 33.4 with its bloom occurred at salinities over 29. We believe that salinity values of the surface water did not in fluence the Noctiluca population during peak periods (March–June), since they usually higher than 30 (Fig.2b).However, heavy rainfall caused low Noctiluca abundance in summer. In August, 2007, a sharp decrease in Noctiluca abundance (about 80 cells/m3),signi ficantly lower than the monthly average value(920 ind./m3), was in accordance with the low salinity(19.7) at St. 5. Similarly, the abrupt and dramatic drop in salinity due to heavy rainfall have also caused sharp decline or breakdown of Noctiluca population in other coastal waters (Huang and Qi, 1997;Sulochanan et al., 2014). The food supply is essential for the growth of Noctiluca population (Al-Azri et al.,2007). Noctiluca was signi ficant correlated with Chl a concentration during the peak period in this study(Table 4), which are consistent with previous studies in Dapeng Bay, China (Huang and Qi, 1997).It is con firmed that high abundance of diatoms is considered to be a contributing factor to the increase of Noctiluca especially during the initial phase of the bloom development, and Noctiluca blooms generally occurred after diatom blooms (Tiselius and Kiørboe,1998; Dela-Cruz et al., 2002; Turkoglu, 2013). In Jiaozhou Bay and adjacent Yellow Sea, Chl a peaks were generally observed during late winter and spring(Fig.2c), which preceded the spate of Noctiluca and the contribution of diatoms to total Chl a was high(Liu et al., 2011). These diatoms were mainly composed of Chaetoceros spp., Thalassiosira spp.,and Pseudonitzschia spp. (Sun et al., 2011c), and were considered to be the major prey for Noctiluca(Sato et al., 2010).

Fig.8 Relationship between environmental variables, i.e. sea surface temperature ( T) and chlorophyll a (Chl a) concentrations,and cell diameter (CD) of N. scintillans in Jiaozhou Bay and its adjacent waters from January 2004 to December 2013

Table 5 Occurrence and abundance of N. scintillans with water temperature and salinity from different areas of the world
In this study, the speci fic growth rate of the Noctiluca population (0.04–0.17/d at St. 5, 0.01–0.25/d at St. 10), which was calculated for a prominent growth period of each year, were similar to those found in previous studies (-0.06–0.35/d, Nakamura,1998; 0–0.52/d, Buskey, 1995; -0.22–0.65/d, Tada et al., 2004). During the period, Noctiluca population multiplied faster and its numerical abundance possibly become high to some extent by increase of the growth rate under favorable food conditions. The cell size of Noctiluca exhibited seasonal fluctuations, with larger sizes in spring-early summer and smaller sizes in remaining seasons. Temperature was considered to be the limiting factor for the growth of this species(Yılmaz et al., 2005). With the increase of temperature from late winter, Noctiluca diameters continued to increase in the following months and reached a maximum in early summer, and then abruptly decreased from July onward. The smaller cell sizes in late summer was attributed to high temperature (Ara et al., 2013). Many studies have proposed that Noctiluca cell size increased with decreasing food availability (Tiselius and Kiørboe, 1998). In the present study, cell size of Noctiluca exhibited a negative correlation with Chl a (Fig.8b), as has been found in other coastal waters (Dela-Cruz et al., 2003).According to Buskey (1995), growth rates of Noctiluca decreased with increasing cell size. The cell size of Noctiluca under the environment of lower temperature and food availability (spring–early summer) was larger than that in higher temperatures and Chl a (late summer–Autumn). Hence, the cell size of Noctiluca was considered to be an indicator of nutritional condition and population growth of Noctiluca (Miyaguchi et al., 2006; Ara et al., 2013).
4.2 Trophic role of Noctiluca
We estimated the biomass of Noctiluca, copepods and phytoplankton in Jiaozhou Bay and adjacent coastal Yellow Sea. The carbon biomass of phytoplankton ranged from 1.1 to 710.2 mg C/m3and 0.6 to 434.5 mg C/m3at Sts. 5 and 10, respectively.During the bloom period, the carbon biomass of Noctiluca population, reaching to 90.3 mg C/m3,sometimes exceeded that of phytoplankton. In addition, the average biomass of Noctiluca exceeded that of copepods, and comprised up to 450% copepod biomass. Thus, N octiluca was an important member of the mesozooplankton in terms of biomass in Jiaozhou Bay and adjacent Yellow Sea.
It is reported that Noctiluca could affect copepods by preying on their egg/larva numbers (Elbrächter and Qi, 1998). In neritic waters off the central Cantabrian coast, the eggs of Acartia clausi were the most conspicuous prey item within the vacuoles and 73% of the total stock of A. clausi eggs was ingested by Noctiluca (Quevedo et al., 1999). Similarly, a maximal value (more than 70% of copepod eggs) has also been recorded in the Ise Bay, Central Japan(Sekiguchi and Kato, 1976) and southern North Sea(Daan, 1987). In our study areas, higher egg production of the dominant copepod species (i.e.Acartia bi filosa, Acartia paci fica and Paracalanus parvus) mainly occurred in spring and early summer(Sun et al., 2011b), which matched the massive occurrence of N octiluca. In order to qualify prey items and quantify their contributions to Noctiluca bloom, detailed information of the component of its prey items are hereafter necessary to be collected in field work.
In addition, Noctiluca could affect copepod population through competition for food resources,mainly phytoplankton (Umani et al., 2004; Yılmaz et al., 2005). Negative community effects of Noctiluca on phytoplankton have been observed in Dapeng Bay,South China Sea (Huang and Qi, 1997), the Seto Inland Sea, Japan (Tada et al., 2004) and the coastal region of Black Sea (Drits et al., 2013). In this study,phytoplankton biomass was not evident during the bloom periods of Noctiluca (Fig.4c). The phytoplankton population clearance by Noctiluca can reach to 12%/d (Nakamura, 1998), which amounts to the grazing pressure by copepods (10%/d) (Zhang et al., 2009). In our studied areas, Noctiluca and copepods have almost similar phenology (Figs.3, 7a).Umani et al. (2004) suggested that the grazing ability of Noctiluca on nano- and picoplankton could considerably reduce suitable prey for net zooplankton.It is particularly important for copepods, since their diet was in agreement with the omnivorous feeding behavior of N octiluca (Turner and Graneli, 1992). It is conceivable that competition may occur where diet spectra overlap. Moreover, because of the species’fast growth (up to 0.25/d, Table 2), large cell size and year round occurrence, Noctiluca have the important advantage over herbivorous zooplanktoners, i.e.copepods. Therefore, in coastal waters of northeast China, N. scintillans seasonally blooms and play important roles as a heterotroph to interact with phytoplankton as well as copepods, the major herbivorous plankton.
5 CONCLUSION
In conclusion, N. scintillans occurred throughout the year and showed an essentially similar seasonality in Jiaozhou Bay and adjacent coastal Yellow Sea, its blooms generally occurred during spring and early summer. Our results suggest that the seasonal phenology of N. scintillans in northwestern Yellow Sea is in fluenced by hydrographical and biological factors. In terms of biomass, N octiluca was an important member of the mesozooplankton in northwestern Yellow Sea. Given its fast growth and euryphage, further research is needed to make clear the ecological signi ficance of Noctiluca in the coastal ecosystem, such as the impacts of Noctiluca on other plankton groups and its role in the bioenergy of the ecosystem.
6 ACKNOWLEDGEMENT
We sincerely thank Prof. S. Uye, Hiroshima University, for investing his time and effort in revising this manuscript. We are grateful for all the staff of Jiaozhou Bay Marine Ecosystem Research Station for their valuable helps with field work and collecting the samples. Thanks are due also to the anonymous reviewers for their valuable comments and suggestions on the manuscript.
猜你喜欢
杂志排行
Journal of Oceanology and Limnology的其它文章
- Editorial Statement
- Effects of seawater acidi fication on the early development of sea urchin Glyptocidaris crenularis*
- Dietary effects of A zolla pinnata combined with exogenous digestive enzyme (Digestin™) on growth and nutrients utilization of freshwater prawn, Macrobrachium rosenbergii(de Man 1879)
- Preliminarily study on the maximum handling size, prey size and species selectivity of growth hormone transgenic and non-transgenic common carp Cyprinus carpio when foraging on gastropods*
- Hydrodynamic characteristics of the double-winged otter board in the deep waters of the Mauritanian Sea*
- De novo transcriptome sequencing reveals candidate genes involved in orange shell coloration of bay scallop Argopecten irradians*