虫子的不同侵染程度对血红铆钉菇质地、营养及风味成分的影响
2018-07-24孙丽斌张晓玉温晓雯孟宪军张佰清
贺 微,孙丽斌,辛 广,*,张 博,张晓玉,宫 雪,温晓雯,孟宪军,张佰清
(1.沈阳农业大学食品学院,辽宁 沈阳 110866;2.鞍山师范学院化学与生命科学学院,辽宁 鞍山 114007)
Gomphidius rutilus (G. rutilus), which belongs to the subphylum Basidiomycotina, is a wild traditional Chinese edible fungus often found beneath pine trees[8]. This mushroom is widely distributed in China; it can be found in Hebei, Shanxi, Liaoning, Jilin, Heilongjiang, Hunan, Sichuan,and Tibet[9]. As the awareness and consumption of wild-grown mushrooms have been increased[10], the discoveries of G.rutilus have also been increased in many countries; however,a similar trend has not been observed in China. G. rutilus can’t be harvested by artif i cial cultivation. Similar to most ectomycorrhizal fungi, the fruiting bodies of this fungus are usually accompanied by worm infections; however, G. rutilus infected with worms possesses no poisonous effect. Instead,worm infection might be related to the quality, nutritional content, and fl avor of the mushroom. This is a question that remains unexplored and need to be addressed.
At the present, domestic and foreign research have mostly focused on polysaccharides from G. rutilus and its antioxidant activities in vitro[11]. Therefore, this study aimed to investigate whether the non-volatile taste components(including its texture profile, nutrients, free amino acids(AAs), 5′-nucleotides, flavor components, and equivalent umami concentration (EUC)) of G. rutilus infected by worms can be distinguished from those of G. rutilus without worms.We hope that our research will provide a theoretical basis for the future study of the mechanism by which worms enhance the properties of these mushrooms and provide scientific evidence for the future study of ectomycorrhizal fungi.
1 Materials and Methods
1.1 Mushrooms
Fresh fruiting bodies of G. rutilus were collected from local producers in Chaoyang, Liaoning Province, China, and then transported to the Food Analysis Laboratory at Shenyang Agricultural University on the second day of collection. After collection, each mushroom was isolated and identified for its degree of worm infection. Based on this, G. rutilus were divided into three types: G. rutilus without worms (GW), G.rutilus with a small amount of worms (GS; infected area less than 50%), and G. rutilus with a large amount of worms (GL;infected area more than 50%). Subsequently, the classified mushrooms were stored in a freezer at -40 ℃. Before use,each type of mushroom was sampled randomly and then ground separately.
1.2 Methods
1.2.1 Assay of texture prof i le
A texture prof i le analysis was carried out for hardness,springiness, cohesiveness, and chewiness, using the Brookfield CT3 texture analyzer[12]. Briefly, mushroom samples were placed on the platform. Then, a cylindrical plunger with a TA3/100 (25.4 mm diameter cylinder) probe was attached to a 10-kg load cell and compressed to 60% of its original height (pretest speed:2 mm/s, test speed:1 mm/s,post-test speed:1 mm/s, trigger type-auto:7 g, and data acquisition rate: 10 pps) to determine the entire texture profile according to the method proposed by Bourne[13]and Khan et al.[14], with some modif i cations. The values reported are the means of six replications.
1.2.2 Assay of nutrients
Moisture content was measured gravimetrically by drying approximately 20 g fresh mushrooms in an oven at 105 ℃, according to Karathanos[15]with some modif i cations.Fat was determined according to the AOAC g/kg official procedures by extracting 10 g of mushrooms in a Soxhlet apparatus, using 30–60 ℃ petroleum ether. The Coomassie brilliant blue G250 method was used to determine the concentration of soluble protein[17]. Crude fiber content of mushrooms (20 g) was determined using a standard method[18].
1.2.3 Assay of free amino acids
我点点头,打开了鞋柜一侧的伞柜。结果我看到了那天丢失的伞,那把爷爷留下的伞。我绝对不可能认错那个烫着一串英文的伞柄——那可是堂哥从英国买回来送给爷爷的礼物。方圆十公里恐怕不会有第二把这个式样的伞。
Sample preparation for the analysis of free amino acids (FAAs) followed the method of Li et al.[19], with some modifications. G. rutilus slurry samples (5 g) were shaken with 30 mL of 0.1 mol/L HCl (36%) for 30 min at ambient temperature, using an ultrasonic machine at 200 W power(KQ-300DE; Kunshan Ultrasonic Instrument Co. Ltd.,China), and centrifuged at 11 000 r/min for 15 min. The retained supernatant was mixed with 5% 5-sulfosalicylic acid dihydrate reagent in an Eppendorf tube, centrifuged at 11 000 r/min for 15 min. The resulting supernatant was fi ltered through 0.22-μm cellulose fi lter (Millipore)prior to analysis. Free amino acid (FAA) contents were determined using an L-8900 automatic AA analyzer (Hitachi,Japan)[20]. Separation was primarily achieved on an ion exchange column #2650L, and the mobile phases used were PH-1, PH-2, PH-3, PH-4, PH-RG, R-3, C-1 ninhydrin solution, and buffer solution (Wako, Japan). Standard AA solutions were obtained from Wako (Wako-shi, Japan).
1.2.4 Assay of 5’-nucleotides
5’-Nucleotides were extracted and analyzed as described by Taylor et al.[21], with some modif i cations. A suspension of G. rutilus slurry (20 g in 20 mL deionized water) was heated to boiling point for1 min, cooled, and then centrifuged at 11 000 r/min for 30 min; this step was repeated with 20 mL of deionized water. The combined supernatants were redissolved to a final volume of 50 mL and fi ltered through a 0.22-μm cellulose membrane (Millipore) prior to analysis by highperformance liquid chromatography (HPLC) using a Waters 1525 instrument (Waters Corporation, Shanghai, China)equipped with an Li Chrospher RP-18 (4.6 mm × 250 mm,5 μm). HPLC conditions were set as follows: mobile phase,0.1 mol/L KH2PO4-H3PO4(pH 4.20); fl ow rate, 1.0 mL/min;UV detection wavelength, 254 nm; oven temperature, 30 ℃;and injection volume, 20 μL. Each 5’-nucleotide was quantified by using the calibration curve of the authentic 5’-nucleotide (Shanghai Yuanye Bio-technology Co., Ltd.,Shanghai, China).
1.2.5 Assay of electronic tongue
In this study, a commercial electronic tongue (E-tongue;Taste Sensing System SA402B, Japan) was used, which contains an array of7 chemical sensors with cross-selectivity for food (SB2AAE, SB2CTO, SB2CAO, SB2COO, SB2AE1,SB2ACO, and SB2ANO) with a standard Ag/AgCl3 mol/L KCl reference electrode and an automatic sampler unit. The sensor array was immersed into the sample solution, and the response signals at equilibrium were collected as variables for statistical analysis. Each sample was measured for 120 s,and distilled water was used to clean the sensors before each subsequent measurement, to ensure that stable potentials were obtained. Each sample was analyzed in triplicate, and the average values were used for subsequent analysis[22].G. rutilus slurry samples were measured after being diluted(20 times dilution,5 g in 100 mL) with pure water at room temperature.
1.2.6 Equivalent umami concentration
The equivalent umami concentration (EUC, mg monosodium glutamate (MSG) per g raw material (wet base),which is the concentration of MSG equivalent to the umami intensity of the mixture of MSG and the 5’-nucleotide, is represented by the following addition equation[23]:

Where Y is the EUC of the mixture in terms of MSG equivalent (mg/g); aiis the concentration (mg/100 g)of each umami AA (aspartic acid (Asp) or glutamic acid (Glu)); ajis the concentration (mg/100 g) of each umami 5’-nucleotide (5’-guanosine monophosphate(5’-GMP), 5’-inosinemonophosphate (5’-IMP),5’-xanthosine monophosphate (5’-XMP), or 5’-adenosine monophosphate (5’-AMP)); biis the relative umami concentration (RUC) for each umami AA to MSG (Glu,1 and Asp, 0.077); bjis the RUC for each umami 5’-nucleotide to 5’-IMP (5’-GMP, 2.3; 5’-IMP, 1; 5’-XMP, 0.61; and 5’-AMP, 0.18); and 1.218 is a synergistic constant based on the concentration of mg/100 g used.
1.3 Statistical analysis
All the analyses were performed in at least triplicates,and data are expressed as ± s. Statistical analyses were performed using Excel (Microsoft Office Excel 2007) and SPSS (SPSS 20.0 for Windows, Chicago, IL, USA)[24]. The confidence limits used in this study were based on 95%(P < 0.05) and 99% (P < 0.01).
2 Results and Analysis
2.1 Texture prof i les

Table1 Texture prof i les of three G. rutilus samples
In this study, the four indicators of G. rutilus quality,including, hardness, elasticity, cohesiveness, and chewiness were investigated. It was observed that as the hardness,elasticity, cohesiveness, and chewiness of G. rutilus were decreased with increasing degree of worm infection (Table 1).GW was 2.62 times and 4.58 times harder than GS and GL,respectively. Moreover, GW showed 3.18 times and 6.14 times higher in chewiness than GS and GL, respectively.There were no significant differences in the influence of varying worm-infection degrees on the springiness and cohesiveness of G. rutilus. The texture of GW was better than those of GS and GL, possibly due to the reason that worm infection causes damages on the inner structure of the mushroom, thus altering its quality. Therefore, as the degree of worm infection increased, the quality of the mushrooms was decreased. In summary, from the texture prof i le perspective,GW is the most desirable form.
2.2 Nutritional prof i les

Table2 Nutrient levels in three G. rutilus samples g/kg
The impact of different degrees of worm infection on the nutritional profiles of these mushrooms was examined using the following4 indicators: moisture content, crude fiber, crude fat, and soluble protein. With the increase in worm-infection degree, moisture content was increased(Table 2). GL had the highest moisture content at 819.92 g/kg, whereas GW had the lowest one at 810.80 g/kg.Yang et al.[25]reported that most fresh mushrooms contained 90% moisture, or 900 g/kg. However, this result indicates that G. rutilus is less moist and denser than those of most other mushrooms. From the consumer’s point of view, lower water content is more suitable for purchase. The increase in moisture content possibly occurred because the worm infection damaged the cell structure of the mushroom,leading to the apparent loss of enchylema; alternatively, the worm infection can accelerate the decay of the mushroom,leading to the increase in moisture content. These trends in the changes in the crude fi ber content are contrary to those of moisture content; as the degree of worm infection increased,the crude fiber content was decreased (Table 2), but there was no significant difference between the three. A possible explanation is that worms consume the fi ber in mushrooms,but this has little influence on the crude fiber content of mushrooms. With regard to the fat content of G. rutilus,there was no signif i cant difference between GW and GL, but the levels were greater than that in GS; GS had the lowest fat at 2.58 g/kg. The lipid content in the mushrooms ranged from 1.1%–8.3% dry mass, with the mean being 4.0%[25],or 0.4% fresh mass. Therefore, this result indicates that G.rutilus has lower fat content than most other mushrooms do. From the point of view of consumption, GS is more suitable for people who want to lose and control their mass.GS exhibited the highest soluble protein content, and GW exhibited the lowest one (Table 2). GS and GL contained 1.42 times and 1.24 times the amount of soluble protein in GW. In general, mushrooms are a good source of protein,and their protein contents ranges from 19%–35% of their dry mass[25], which when converted to fresh mass are in the range of 1.9%–3.5%. Therefore, it may be concluded that the soluble protein content in G. rutilus is lower than those of other mushrooms. GL and GS are superior to GW in terms of soluble protein. A possible explanation is that worms secrete certain enzymes, which contribute to the composition of protein. The other possibility is that worms destroy the inner structure of mushrooms, which also alters the protein composition.
2.3 Free amino acids

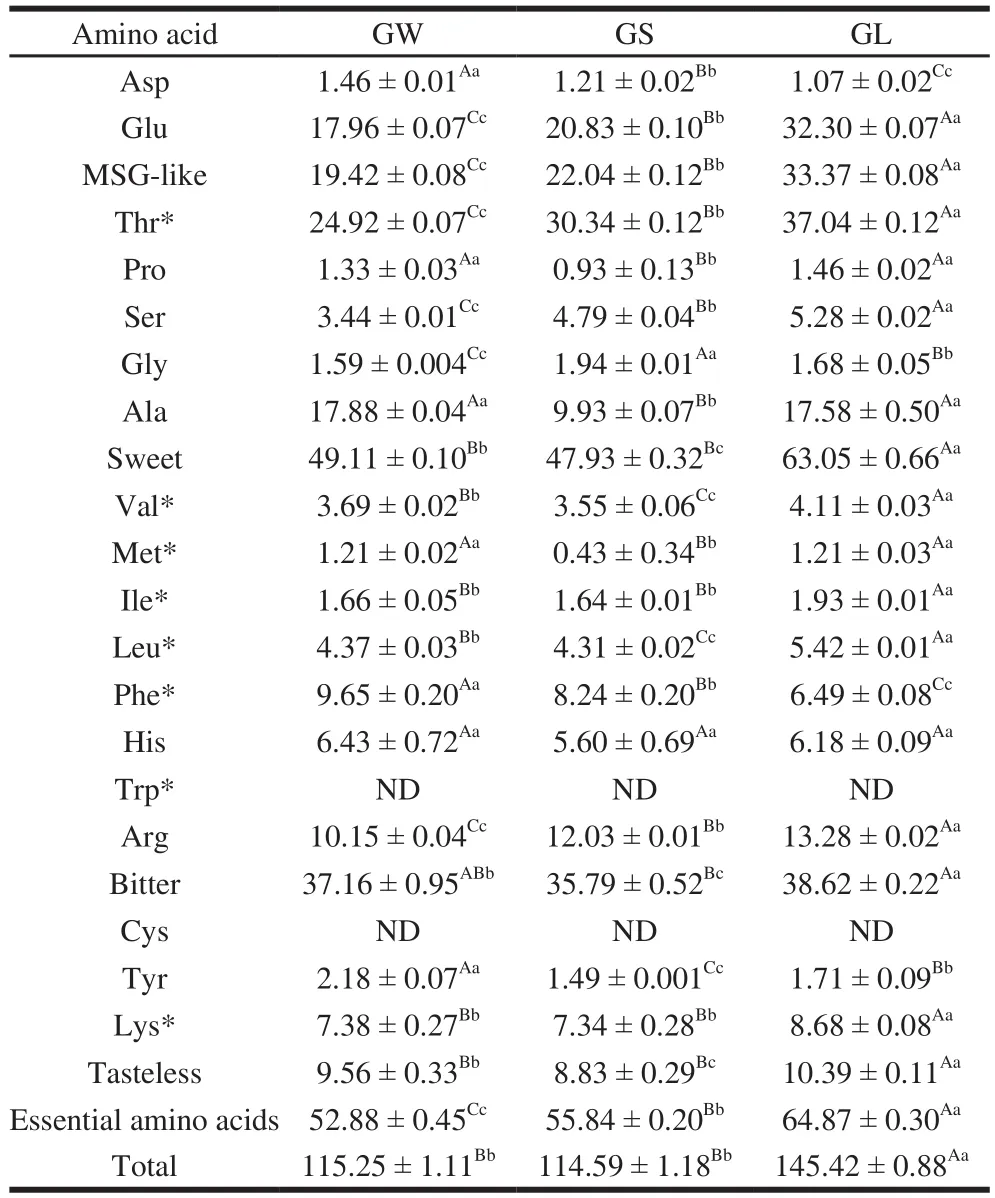
Table3 Free amino acid levels in three G. rutilus samples mg/100 g
The degree of worm infection influenced the FAA content in the mushrooms (Table 3). In this study, the total FAA content in GL was higher than those in GW and GS;the total FAA content in GL was 1.26 times that in GW and 1.27 times that in GS, whereas no signif i cant difference was observed between the FAA contents in GW and GS. The trends of Ile and Lys were consistent with the changes of total FAAs content. Essential AA content was increased with worm infection degree. Essential AA content in GL was 1.23 times that in GW and 1.16 times that in GS. The other AAs with increasing tendency were Glu, Thr, Ser, and Arg (Table 3). In contrast, the AAs with decreasing tendency were Asp and Phe. Thr was the highest in GL, followed by GS and GW. Met was the lowest in GS, whereas Asp was the lowest in GL. The contents of Pro, Ala, Met, Leu, Val, Ile, Lys,Tyr, and total amino acids were the lowest ones in GS. In addition, there was no signif i cant difference between the His levels in the three groups. Collectively, among all the AAs,the content of Gly was the highest one in GS. Hence, GS is most suited for the extraction of Gly. The contents of Asp,Phe, and Tyr were higher in GW than in the other kinds of mushrooms. Therefore, if these AAs were to be processed or extracted, GW could be selected. The contents of Glu, Thr,Ser, Leu, Val, Ile, Arg, Lys, essential amino acids, and total amino acids were the highest in GL. If these 10 amino acids are needed, GL could be selected. In addition, there was no significant difference in the contents of Pro, Ala, and Met between GW and GL, but all of them were higher in GW and GL than in GS. Therefore, if Pro, Ala, and Met are needed,GW or GL could be selected.
The amino acids can also enhance the taste of food[26].Table3 tabulates the FAAs into several classes based on their taste characteristics, as described by Komata[27]. Aspartic and glutamic acids are monosodium glutamate (MSG)-like components and give the most typical mushroom taste, i.e.,the umami or palatable taste, that is characteristic of MSG and 5’-nucleotides[28]. The contents of MSG-like components have been found to be 22.7–47.1 mg/g in common mushrooms(dry mass)[29]. The MSG-like content was higher in GL and GS than in GW. GL displayed the highest amount of MSG-like components at 33.37 mg/100 g, which was 1.72 times that of GW and 1.51 times that of GS. Worm infestation could lead to the secretion of a certain substance that increases the MSG-like content. Thus, to choose a mushroom with a high content of MSG-like components, for extraction or processing, GL would be the ideal one. Regarding the other taste-related AAs, such as sweet, bitter, and tasteless AAs, their changing tendency differed from that of flavor AAs, with the content in GL being the highest and that in GS being the lowest; the content in GW was higher than that in GS, and the content in GL was higher than that in GW.The sweet AA content was the highest, whereas the tasteless AA content was the lowest. Thus, if one needs to consume or process sweet, bitter, and tasteless amino acids, we recommend GL, followed by GW. Chen[30]conducted a series of sensory evaluations on synthetic mushroom extracts prepared by omitting and adding soluble components and found that alanine, glycine,and threonine (sweet), as well as aspartic and glutamic acids(MSG-like), were taste-active AAs in common mushrooms,whereas none of the bitter components was found to be tasteactive. Therefore, MSG-like and sweet components are responsible for the natural taste of mushrooms.
2.4 Flavor 5’-nucleotides

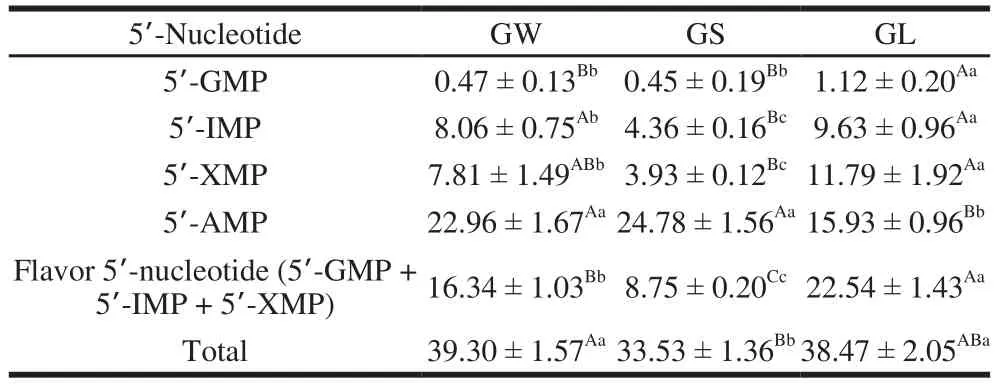
Table4 5’-Nucleotide levels in three G. rutilus samples mg/100 g
Flavor 5’-nucleotides responsible for the umami or palatable tastes were previously identif i ed as 5’-guanosine monophosphate (5’-GMP), 5’-inosine monophosphate(5’-IMP), and 5’-xanthosine monophosphate (5’-XMP)[30].5’-GMP imparts a meaty fl avor, and is a stronger fl avor enhancer than MSG[31]. The synergistic effect of fl avor 5’-nucleotides with MSG-like components might greatly increase the umami taste of mushrooms[23]. Yang et al.[32]def i ned three ranges of fl avor 5’-nucleotides: low (<1 mg/g),medium (1–5 mg/g), and high (>5 mg/g). Contents of fl avor 5’-nucleotides were found to be in the range of 4.19–6.30 mg/g in common mushrooms (dry mass)[29]. In the present study,the fl avor 5’-nucleotide content in GL was the highest at 22.54 mg/100 g, whereas that in GS was the lowest at 8.75 mg/100 g(Table 4). GL had 1.38 times the content of GW and 2.58 times that of GS. The fl avor 5’-nucleotide content of G. rutilus was not very high. Among the four types of 5’-nucleotides,5’-AMP was the highest one, and 5’-GMP was the lowest one. The changes in 5’-GMP, 5’-IMP, and 5’-XMP contents were in accordance with those of fl avor 5’-nucleotides, i.e.,GL had the highest, and GS the lowest. One possible reason is that the internal synthetic pathway of GS may have been changed, and its content is reduced. However, with increase in worm-infection (GL), the synthesis pathways of other substances may have also been changed, thus promoting the synthesis of flavor 5’-nucleotides. Regarding 5’-AMP, GS had the highest content, and GL the lowest. However, there was no significant difference between GW and GS, which showed that the 5’-AMP content was almost unchanged when the infestation minimal. GW and GS showed the highest and lowest total contents of the four types of 5’-nucleotides,respectively. Collectively, the total nucleotide content of GW was higher than those of the other three kinds of mushrooms,and if nucleotides are required for extraction, GW could be chosen. The content of 5’-AMP was highest in GS; therefore,GS can be selected if 5’-AMP is required to be processed and
extracted. The contents of 5’-GMP, 5’-IMP, 5’-XMP, and flavor 5’-nucleotides were highest in GL. Hence, if these4 nucleotides are needed, GL could be selected. The contents of 5’-AMP in GW and GS were not signif i cantly different, but was higher than that in GL; therefore, if 5’-AMP is needed,either GW or GS could be chosen. There was no signif i cant difference in the total nucleotide content between GW and GL, but the level was higher than that in GS; therefore, if total nucleotides are needed, GW or GL could be selected.
2.5 Equivalent umami concentration

Table5 Equivalent umami concentration values of three G. rutilus samples
Using the equation derived from the sensory evaluation[23], Mau[33]designated EUC values, expressed as MSG per g dry matter, which were calculated to one of four levels: >10 000 mg/g,1 000–10 000 mg/g, 100–1 000 mg/g,and <100 mg/g respectively. An EUC value of 100%means that the umami intensity per1 g of dry matter is equivalent to the umami intensity given by1 g of MSG[34]. The EUC values of Volvariella volvacea (eggto bell-shaped), Agaricus bisporus, and Flammulina velutipes (yellow and white strains) are1 048%–1 181%,1 144%, and 139%–363%, respectively[34]. In the present study, the EUC value of GL was 9.10 mg/g, the highest among the three, whereas that of GS was 3.34 mg/g, the lowest one (Table 5). The EUC value of GL was 2.19 times that of GW and 2.73 times that of GS. The contents of 5’-GMP, 5’-IMP, 5’-XMP, and Glu were highest in GL,whereas those of 5’-GMP, 5’-IMP, and 5’-XMP were the lowest one in GS, resulting in GL having the highest EUC value and GS the lowest. Collectively, considering the EUC value, GL could be enjoyed as the most preferred delicacy and GS as the least preferred one.
2.6 Evaluation of electronic tongue
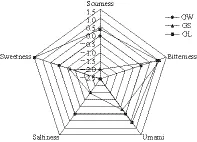
Five sensory indicators, including sourness, bitterness,umami, saltiness, and sweetness, were analyzed using an E-tongue (Fig. 1). The five indicators of GW were used as blanks and compared with those of GS and GL. GL was sourer and had higher umami and sweetness than GW did, whereas GW was sourer and had higher umami and sweetness than GS did. GS was more bitter than GL was,whereas GL was more bitter than GW was. GW had higher saltiness than GS did, and GS had higher saltiness than GL did. Among the fi ve sensory indicators, the sweetness value was the highest, possibly due to the reason that the sweet AA content and saccharides are comparatively higher in this mushroom. Umami was also comparatively higher and was in accordance with the changes in the EUC values.Saltiness was the lowest.

Fig.1 Relative contents of5 taste indicators in three G. rutilus samples
3 Conclusions
Different degrees of worm infection affect the quality,nutritional and flavor components of G. rutilus to some extent. Integrated with signif i cance analysis, worm-infected G. rutilus was better than GW in the following 13 indicators:moisture content; soluble protein; Glu, Thr, Ser, Gly, Arg,Ile, Lys, and MSG-like AA components; essential AA;total AA; and 5’-GMP. GW was better than worm-infected G. rutilus in the following 10 indicators: hardness, chewiness,Asp, Ala, Phe, Tyr, Pro, Met, 5’-AMP, and the total of four 5’-nucleotides. GL was better than GW, and GW was better than GS, in the following 10 indicators: Crude fat, Val, Leu,sweet AA components, bitter AA components, tasteless AA components, 5’-IMP, 5’-XMP, flavor 5’-nucleotides, and EUC. GS was superior to GW in 13 indicators, whereas GS was inferior to GW in 20 indicators. GL was better than GW in 23 indicators, whereas GL was inferior to GW in 10 indicators. This research indicates that from the perspective of the texture prof i le analysis, the quality of GW is the best,because as the increase in degree of worm infection, all the indicators of texture prof i le showed a downward trend. From the nutritional standpoint, because of its lower fat content and high protein content, as well as there being no signif i cant differences in moisture content and crude fiber, GS has the best nutritional profile. From the point of view of flavor components, GL had the highest EUC value and, therefore,should have the best taste. This study provides a theoretical basis for further development and study of G. rutilus and ectomycorrhizal fungi. However, the limitation of this study is that our results are direct, and the reasons for their specif i c impact require further investigation.
