Chemical characterization and sources of PM2.5 at 12-h resolution in Guiyang,China
2018-06-27LongchaoLiangNaLiuMatthewLandisXiaohangXuXinbinFengZhuoChenLihaiShangGuangleQiu
Longchao Liang•Na Liu•Matthew S.Landis•Xiaohang Xu•Xinbin Feng•Zhuo Chen•Lihai Shang•Guangle Qiu
1 Introduction
Associations between atmospheric fine fraction(aerodynamic diameter≤ 2.5 μg)particulate matter(PM2.5)and adverse human health outcomes have been extensively reported(Pope et al.2004;U.S EPA 2009;Stanek et al.2011;Solomon et al.2012;HEI 2013).Due to its ability to penetrate deep into the lungs and its solubility,components of PM2.5are considered to be respirable and bio-available(Raes et al.2000;Kelly and Fussell 2012).Moreover,PM2.5can contain toxic heavy metals such as chromium(Cr),cadmium(Cd),titanium(Ti),manganese(Mn),nickel(Ni),lead(Pb),arsenic(As),and zinc(Zn)(Kim et al.2004;Figueroa et al.2006).Those PM2.5associated toxic elements have been demonstrated to detrimentally affect cardiovascular and respiratory health risks,as well as pose a lung cancer risk(Gao et al.2015a,b;Costa and Dreher,1997;Kodavanti et al.1998;Adamson et al.2000;Lewtas,2007;Wallenborn et al.2009).PM2.5can also remain in the atmosphere for a considerable period time and transport over regional and global scales,hence it plays an important role in the dispersion of its combined toxic elements in the environment.
Since PM2.5in ambient air is a broadly recognized environmental and public health issue,it has received considerable attention worldwide and is currently regulated in most industrialized countries(WHO 2005).Numerous studies on PM2.5and its toxic element constituents were conducted in many countries(Toledoet al.2008;Crilley et al.2014;Morishita et al.2011;Cristaldi et al.2013).China is the world’s largest emitter of atmospheric PM2.5,and the government has been increasingly taking actions to reduce emissions(Li et al.2016).Investigations into ambient PM2.5air pollution have focused primarily on developed capital cities,such as Beijing,Xi’an,Shanghai,and Guangzhou.Those studies mainly focused on PM2.5mass and major components,temporal and spatial distribution characteristics,and identification of its sources(Dan et al.2004;Huang et al.2015;Chan et al.2016;Lai et al.2016).For example,Huang et al.(2014)revealed that severe haze events were largely driven by secondary aerosol formation.Gao et al.(2015a,b)reported the risk levels for the carcinogenic heavy metals such as Cr>Cd>Ni,suggesting that Cr may pose a carcinogenic risk in Beijing daily PM2.5.Ye et al.(2003)reported weekly PM2.5mass concentrations and components with a PM2.5mass ranging from 21 to 147 μg m-3.Results indicated that coal combustion was the largest contributor to PM2.5in ambient air in Shanghai.Wang et al.(2006)reported an average concentration of 98 μg m-3of PM2.5in Guangzhou,observing that the major components were organic matter and sulfate.Shen et al.(2014)investigated day-night diurnal variations of water soluble ions in PM10in Xi’an and found low NO3-/SO42-ratios,suggesting that coal combustion was the major contribution.
With ambient levels of PM2.5continuing to increase in China,the identification of responsible sources has become an area of active and necessary research.In Xi’an,source apportionment of PM2.5using the positive matrix factorization(PMF)receptor model showed that motor vehicular emissions,coal combustion,secondary inorganic aerosol,and fugitive dust were the major sources,accounting for 80%of total PM2.5mass(Xu HM et al.2016).The authors also indicated that the contribution of coal combustion decreased from 31%±5%in 2006 to 24%±3%in 2010,owing to the coal- fired power plants’ flue gas controlling implement,while the mobile source contribution remained essentially the same from 2006(19%±5%)to 2010(21%±5%).In Beijing,eight sources of PM2.5were identified,which consisted of biomass burning(11%),secondary sulfates(17%),secondary nitrates(14%),coal combustion(19%),general industrial(6%),motor vehicles(6%),road dust(9%),and yellow dust(Song et al.,2006).Yang et al.(2015)investigated the chemical composition of PM2.5in Beijing and reported that the total mass concentrations of metals in PM2.5ranged from 0.4 to 13.2 μg m-3.Gu et al.(2011)investigated chemical composition of PM2.5during the winter in Tianjin and found that SO42-,NO3-,Cl-,and NH4+were four major ions,accounting for 17,12,5,and 6%of total PM2.5mass,respectively.
Currently,few studies of ambient PM2.5have been conducted in Guiyang,a quickly developing inland capital city of Guizhou Province,in southwestern China.The primary goals of this pilot study were to(1)characterize the temporal distribution pattern of potentially toxic PM elemental components,(2)investigate elemental composition and their enrichment factors,and(3)identify potential emission sources and affecting meteorological factors of ambient PM2.5in Guiyang.
2 Experimental methods
2.1 Study domain
Guiyang,the capital city of Guizhou Province,is a large and rapidly growing inland city in southwestern China(Fig.1)with an estimated population in 2014 of approximately 4.3 million within an area of 8030 km2.The climate in Guiyang is characterized as subtropical humid monsoon.Annual predominant winds are from the northeast and south in summer/spring and are more northeasterly in autumn and winter(Xu XH et al.2016).Major industries in Guiyang include petrochemical, metallurgy, energy extraction,electricity generation,and medicine.The sampling site is located at the Guiyang Environmental Monitoring Station(EMS),which is a residential area and approximately 100 m away from a roadway(106°43′03′E;26°33′56′N).It is also located approximately 7.0 km from a coal- fired power plant.In addition,a cement production plant is located to the southwest of the sampling site,and an iron/steel plant and another cement production plant are located in the east.
2.2 Methods and materials
A total of 180 twelve hour(12-hr)integrated PM2.5filter samples were collected daily during the fall season of September,October and November using a URG Corporation(Chapel Hill,NC,USA)Model 2000-01 J Weekly Air Particulate Sampler(WAPS).The WAPS sampler was located on the roof of an approximately 30 m high building.The WAPS sampled at a 16.7 L min-1flow rate onto 47 mm Teflon filters(Millipore,PGTRISLIDETM).During the sampling campaign,the 12-h integrated samples were collected from 08:00–20:00(daytime)and 20:00–08:00(nighttime).After collection,samples were stored in a freezer(-20°C)waiting for shipment.When the sampling campaign was finished,all filters were shipped at ambient temperature to U.S.EPA Office of Research andDevelopment,National Exposure Research Laboratory for weighing and chemical analysis.
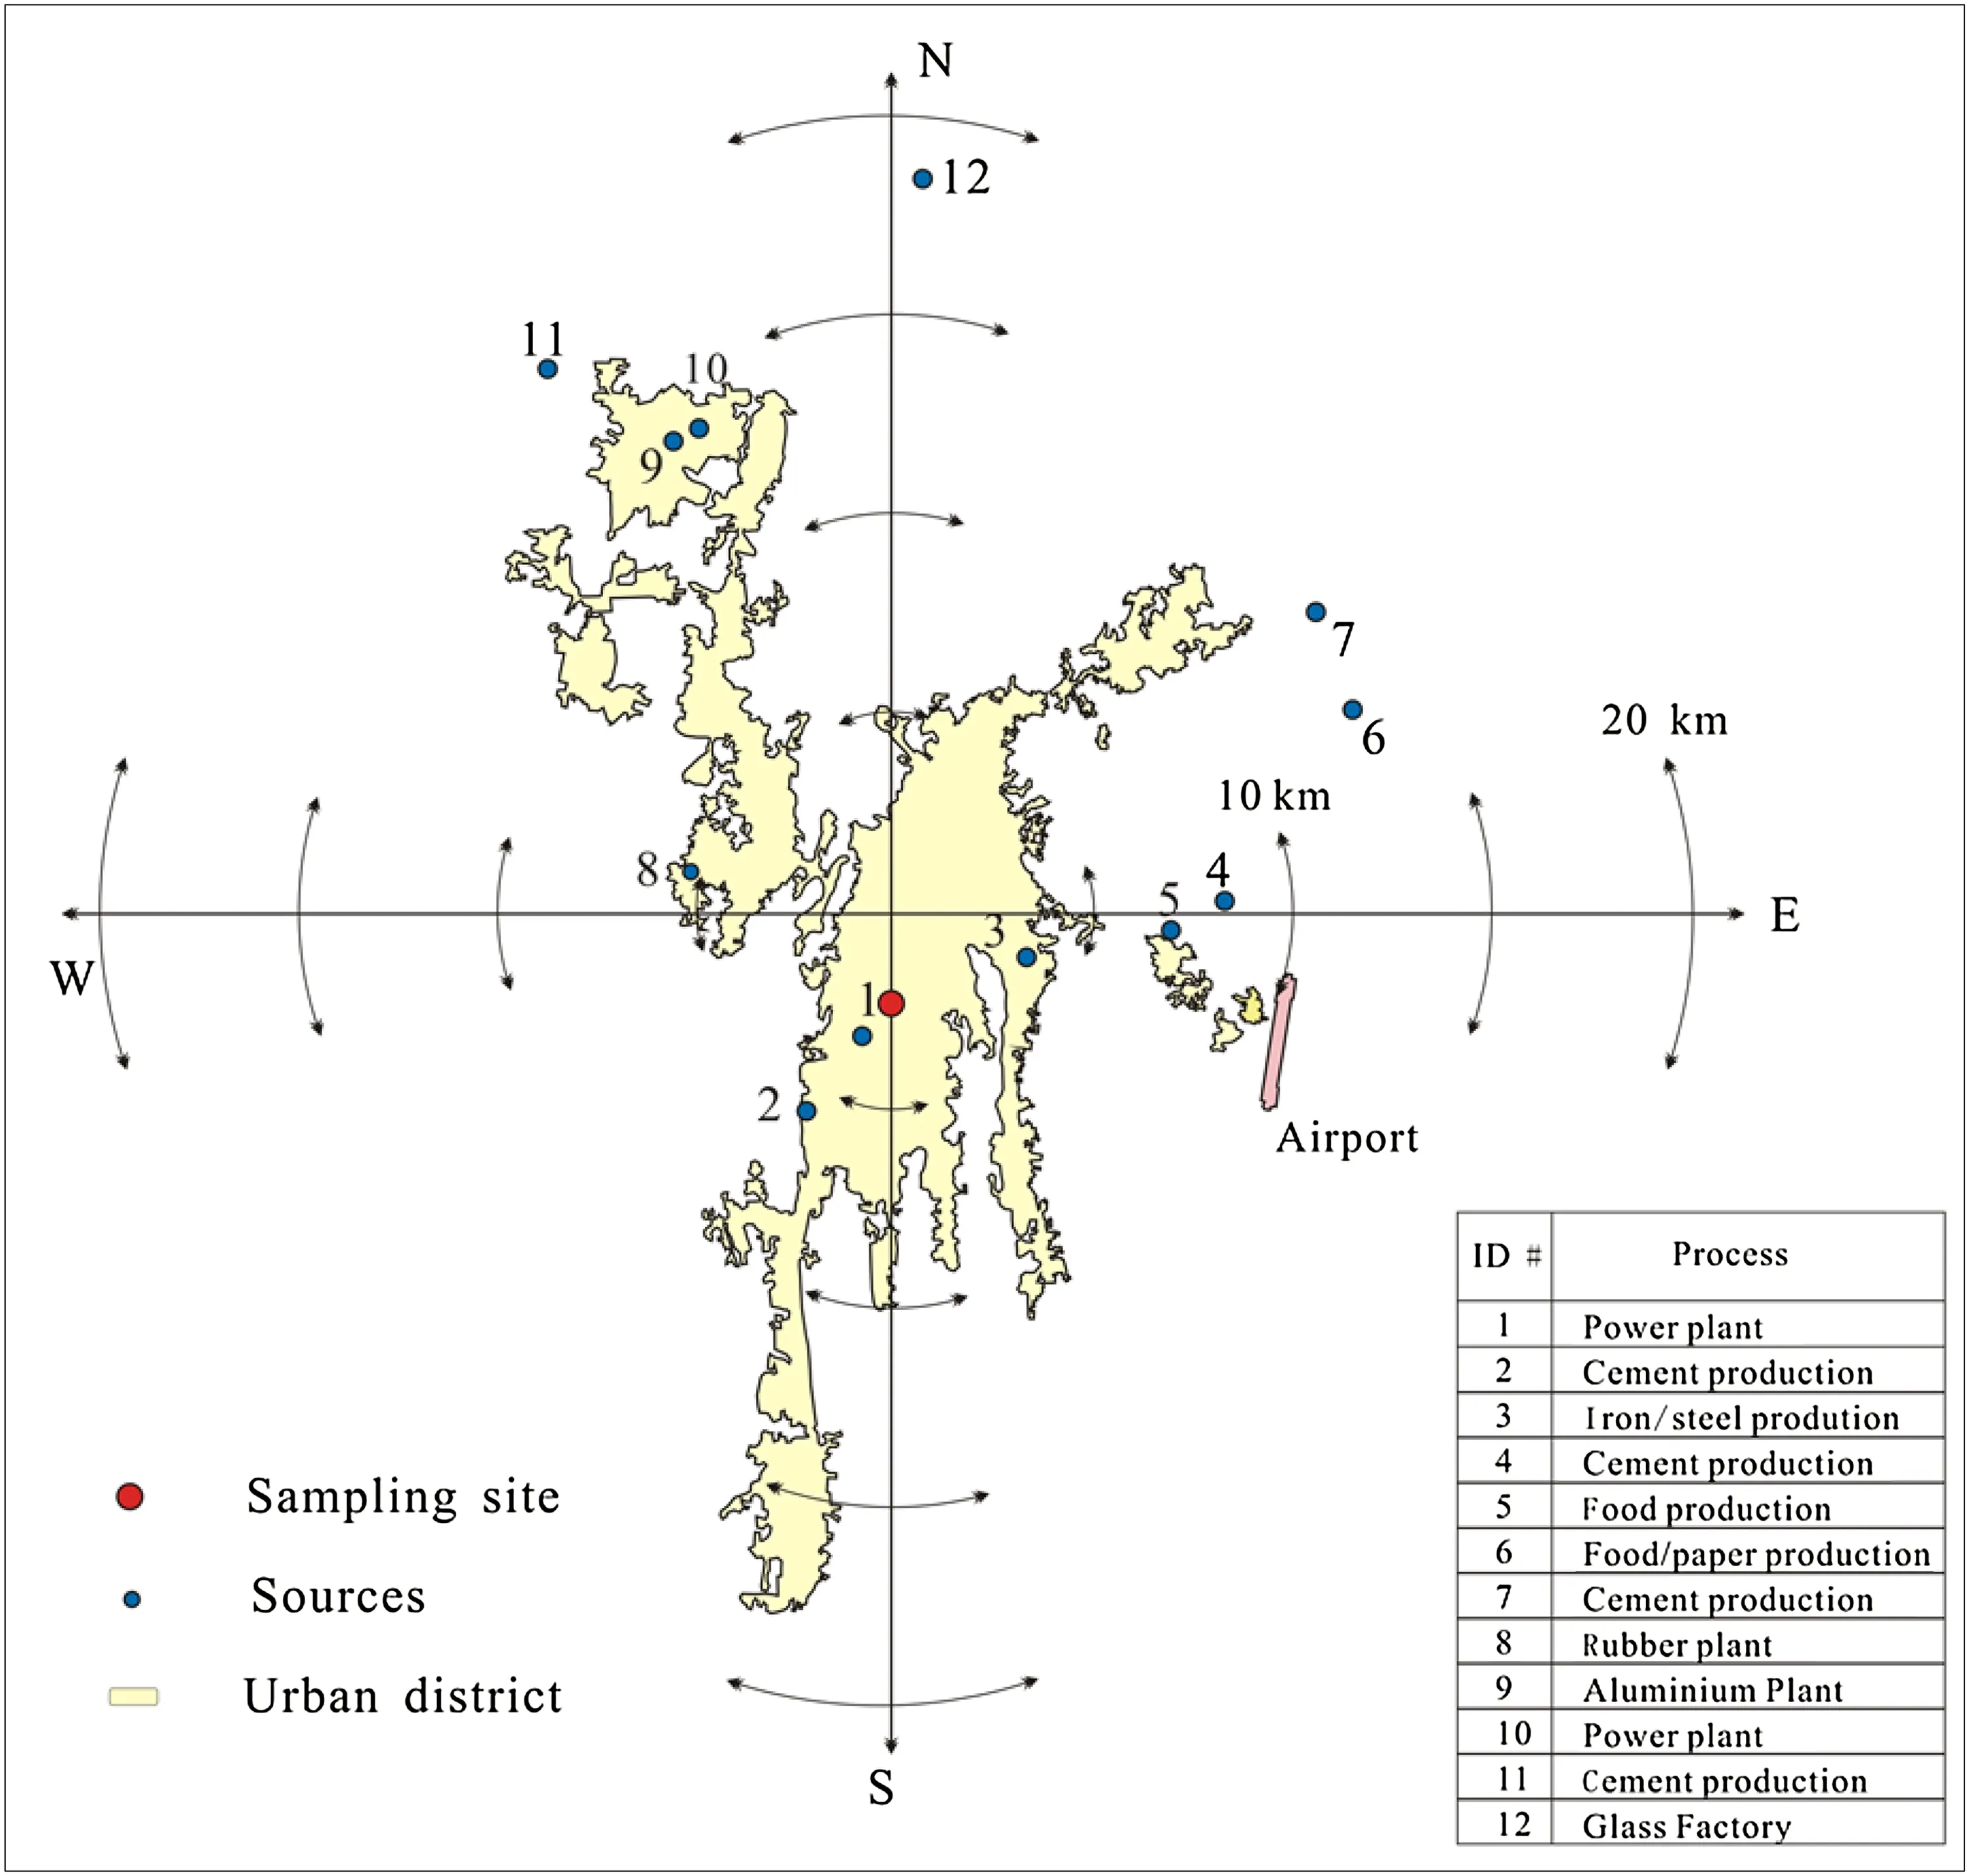
Fig.1 Sampling location in Guiyang located in southwestern China and surrounding major emission sources
To determine the mass of PM2.5that was collected, filters were equilibrated for a minimum of 24-h in a temperature-controlled room at 25°C with 40% relative humidity.Filters were weighed before and after sample collection using a Mettler Toledo(Columbus,OH,USA)Model UMX2 microbalance.Weights were only deemed valid if duplicates were within 3 μg of each other on another day.Sampled filters were individually stored in petri dishes and sealed in polythene bags for preservation.Once PM2.5mass was determined,sample filters were analyzed by energy dispersive X-ray fluorescence spectrometry(XRF)for total elemental concentrations(Oakes et al.,2016).For the filters measured by XRF,the limit of determination(LOD;deposition area=6.61 cm2, flow rate=10 L min-1)varied by element from 2.0 ng m-3for Zn to 230 ng m-3for Na.
The meteorological parameters were measured from a 10 m meteorological tower operated at the monitoring site and provided by the Guiyang Meteorological Administration,using an ambient air quality automatic measurement system (model Ambient gas MS,USA).The12-h integrated wind speed,wind direction,ambient temperature,and relative humidity were calculated for each filter sampling period.Precipitation was also obtained at the sampling site.All study data analyses were performed using SPSS 11.0(SPSS Inc.,USA)and Microsoft Excel 2007(Microsoft Corp.,USA).
2.3 Quality assurance
The data for the particulate matter samples were acquired using a Kevex energy-dispersive XRF spectrometer,as described by Landis et al.(2001).To monitor the accuracy of the spectrometer,NIST certified reference standard,Standard Reference Material SRM1833-1111 and SRM 1832-249,were analyzed at the beginning and end and met the accepted criterion for accuracy.Average sample concentrations were generally higher than or comparable to average lot and field blank concentrations(within the standard deviation)for all elements measured.The limit of detection(LOD)was calculated as three times the standard deviation of a set of field blanks.
3 Results and discussion
3.1 Characteristics of PM2.5
The 12-h integrated PM2.5concentrations showed a daytime average of 51 ± 22 μg m-3(mean ± standard deviation)ranging from 17 to 128 μg m-3(n=89),and a nighttime average of 55 ± 32 μg m-3ranging from 3.7 to 186 μg m-3(n=89),respectively.Nighttime PM2.5concentrations exhibited a wider range in concentration compared to daytime PM2.5concentrations.Generally,low PM2.5concentrations were observed during episodes of precipitation,highlighting the importance of rain washout.The lowest mean daily value of PM2.5concentration of 15 μg m-3was recorded on October 31 and was the result of washout from a significant wet deposition event(Fig.2).Large variations of PM2.5observed in Guiyang were a function of differences in meteorological dispersion and the intensity of anthropogenic emissions.
In Guiyang,the daily 24-h(defined as 08:00–08:00)integrated PM2.5levels varied from 15 to 157 μg m-3,with a mean value of 53 ± 25 μg m-3,which was comparable with our recent average value of 68 ± 30 μg m-3observed in the fall of 2014(unpublished data).The daily average concentrations of PM2.5in Guiyang were lower than results obtained in other domestic developed capital cities,such as Beijing,Shanghai,Guangzhou,and Xi’an,which exhibited as much as 119±14, 94±52, 108±94, and 141 ± 109 μg m-3,respectively(Yan et al.2016;Zhao et al.2015;Wang JZ et al.2016;Wang et al.2015).Compared to cities abroad,however,the PM2.5concentrations in Guiyang were higher than that those observed in Steubenville,Ohio(26 ± 11 μg m-3),USA,but lower than concentrations measured in Korogocho(166 μg m-3),Kenya,and Agra(71 μg m-3),India(Egondi et al.2016).
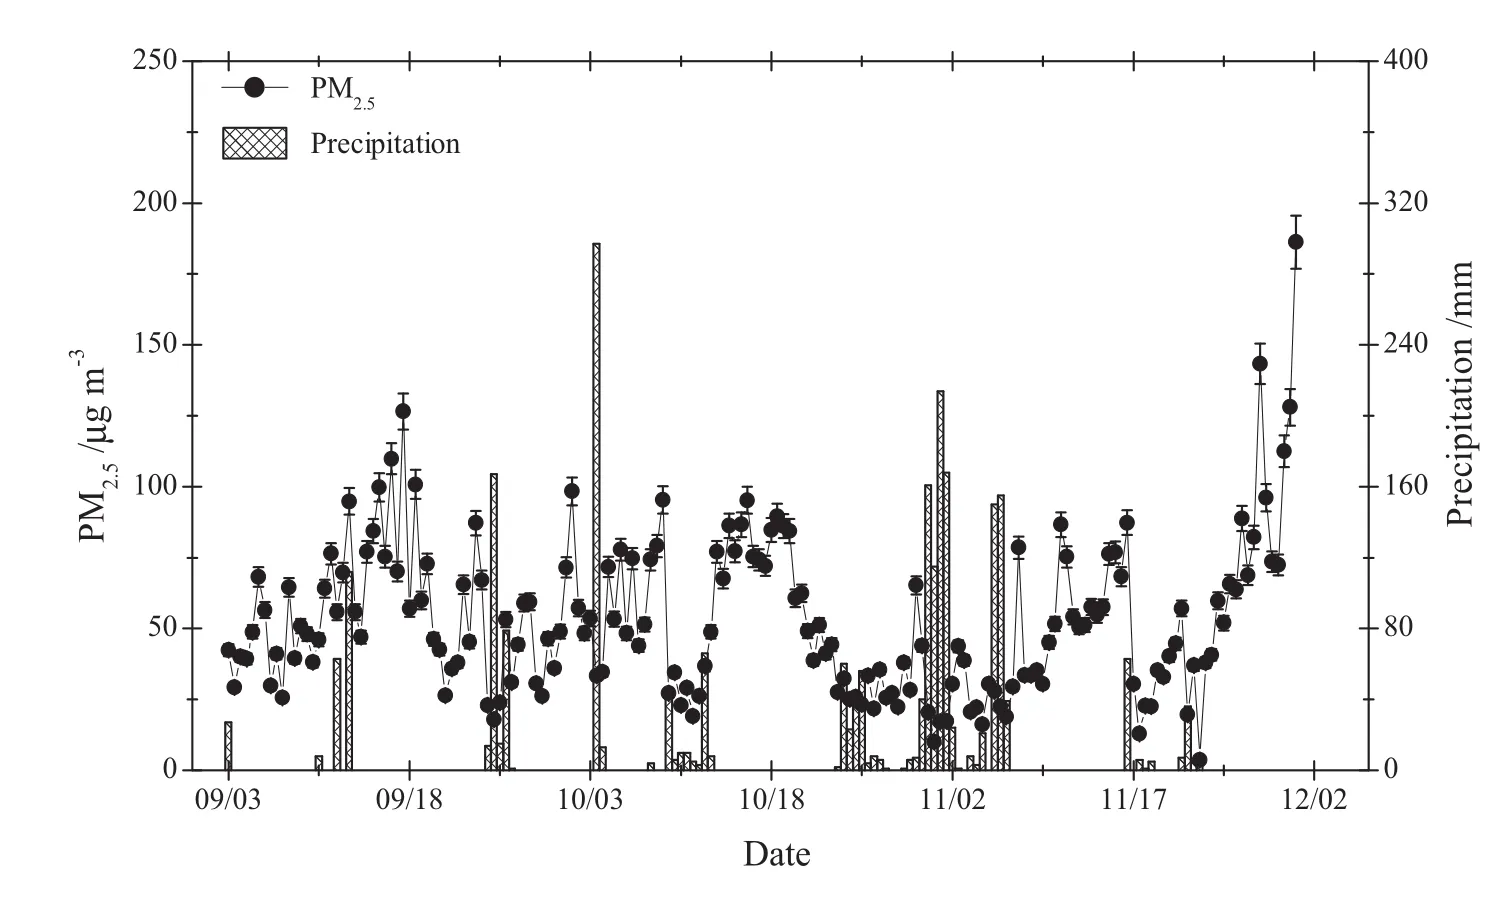
Fig.2 The distribution pattern of 24-h integrated PM2.5 concentrations incorporated with precipitation depth during the sampling campaign
Negative correlations among PM2.5and wind speed(r=-0.31,p<0.0001) and relative humidity(r=-0.46,p<0.0001)were observed(Fig.3)during this study,and this highlights the influence of meteorological dispersion on local anthropogenic emissions.Precipitation accompanied by high wind can remove and spread a significant portion of PM2.5from the air due to below cloud scavenging(Charron and Harrison 2005;White et al.2013),and the efficiency of removal is a function of aerosol size,morphology,and hydrophobicity(Chate et al.2003;Jung et al.2003).Hence,meteorological conditions will result in changes to the composition of PM2.5in the air.Guiyang is a city characterized by high annual average rainfall between 110 and 130 cm,with up to 178 days rainy days per year(Xu et al.2008).The PM2.5concentrations in Guiyang City were lower than other domestic cities(Shen ZX et al.2016;Wang YL et al.2016)and might be attributed to the frequent rainfall events.
WHO(2005)has set three interim target values for PM2.5of 24-hr,including interim target-1(IT-1),interim target-2(IT-2),and interim target-3(IT-3).The highest limit value is 75 μg m-3for IT-1.However,air quality guidelines(AQG)for human health protection recommended a 24-h PM2.5limit of 25 μg m-3.The current U.S.EPA National Ambient Air Quality Standard(NAAQS)for 24-h integrated PM2.5is 35 μg m-3(USEPA,2012).Currently,China MEP has proposed a national target for 24-h average PM2.5,which is 75 μg m-3.Although the overall study average 24-h PM2.5concentration of 53 ± 25 μg m-3observed in Guiyang during the study period met the WHO’s IT-1 standard,the 24-h concentration limit was exceeded 20 times.In addition,the observed concentrations were much higher than the values set by the AQG and U.S.EPA NAAQS.

Fig.3 Ambient PM2.5concentrations relative to wind speed and relative humidity
3.2 PM2.5chemical composition
The measured elemental mass(the total mass of specific oxides,Table 1)of 18 elements constituted an average of 25%,varying from 22%to 29%of the total PM2.5.As expected,S,and K showed high average concentration of 6.7 μg m-3with a range of 0.61–16 μg m-3,and an average of 1.7 μg m-3and a range of 0.14–8.0 μg m-3,respectively.In general,K in particles mainly originated from biomass combustion(Yamasoe et al.2000)and other anthropogenic sources like iron/steel slag and sintering operations(Pancras et al.2013).During the study period,local agricultural burning of crop residues,such as rice and corn straws,was observed and resulted in relatively high concentration of K in particles.Similarly,major elements of Si,Fe,Ca and Al,which are considered as crustal elements(Zíkováet al.2016),also exhibit high concentrations with averages of 2.2,0.63 and 0.34 μg m-3,and range from 0.16–10,0.016–3.8 and 0.014–1.2 μg m-3,respectively.The high concentrations combined with large ranges of Si and Ca may indicate significant contributions of construction dusts and resuspended mineral particles to PM2.5in Guiyang City.
The daily average concentration trend of most elements was consistent with the corresponding concentration of PM2.5mass,suggesting meteorology as one driving factorinfluencing overall concentrations of PM and composition.In general,elements measured in the PM2.5samples of Guiyang displayed clear daily variation patterns.It is assumed that local anthropogenic sources and seasonal meteorology led to the temporal variability as shown in Fig.4.Stable concentrations of Br,which can be associated with emissions from motor vehicle exhaust(Chan et al.1997),were observed,reflecting a steady contribution of vehicle exhaust emission.All elemental concentrations were relatively high prior to September 20,and the lower concentrations were observed beginning in November.Analysis of meteorological data revealed high rainfall rates in early November with the total precipitation depth reaching 71 cm,which may be responsible for the decreasing concentrations of elements in PM2.5.
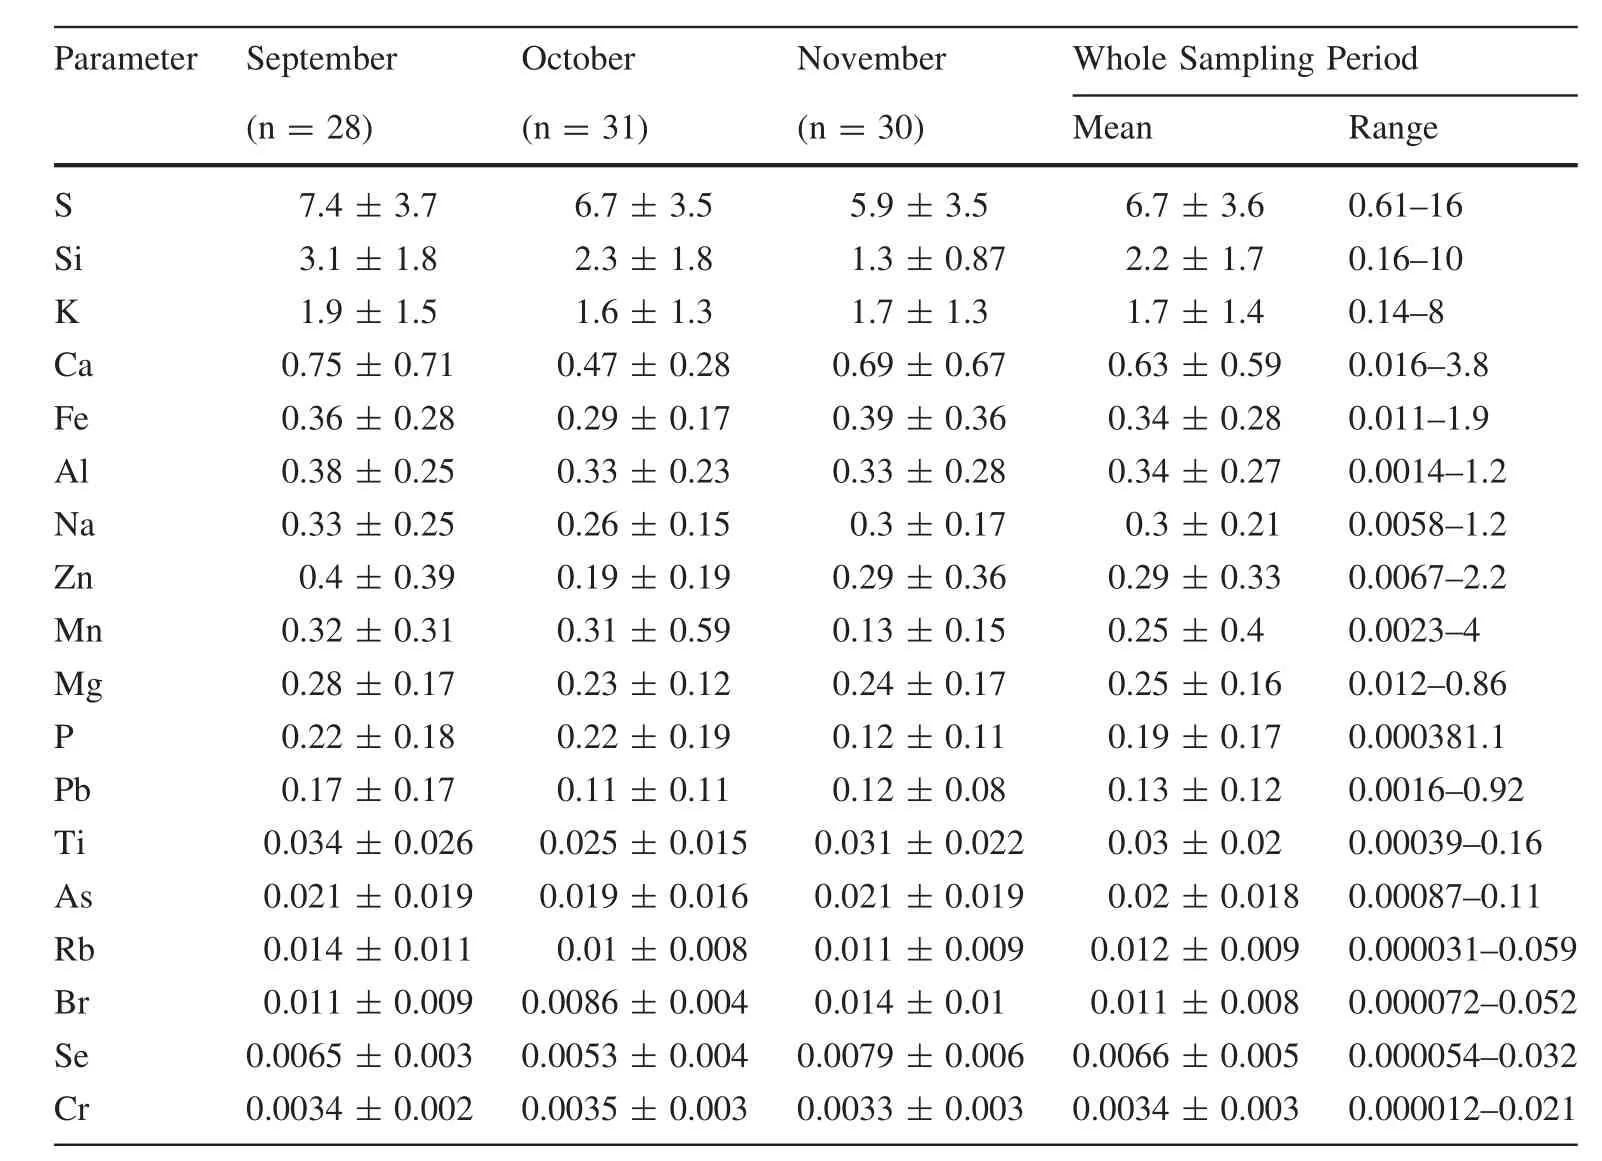
Table 1 Monthly average elemental concentrations(μg m-3,total mass of specific oxides)in descending order of concentration
The comparisons of PM2.5elemental concentrations during daytime and nighttime sampling periods are presented in Fig.5a.The daytime average concentration of all elements was 0.75 ± 0.4 μg m-3and the average nighttime concentration was 0.92 ± 0.6 μg m-3.Concentrations of elements measured at nighttime typically exhibited higher concentrations than during the daytime.For example,the average concentration of Si was 1.7 ± 1.0 μg m-3in daytime and 2.7 ± 2 μg m-3in nighttime.The higher concentration of elements observed at night during this study was consistent with reported results in Jinshan,Shanghai,China(Zhu et al.2015)and suggests that nocturnal radiative cooling inversions,which often result in lower nighttime boundary layer heights,decreased atmospheric dispersion and effectively increased concentrations of local PM2.5emissions near the surface(Querol et al.2001;Marcazzan et al.2001).
Elements exhibited various monthly temporal variation patterns.Elemental concentration trends of Na,Mg,K,Ca,Ti,Zn,Fe,and Pb exhibited a pattern of September>November>October(Fig.5b).While other elements(e.g.,Al,Si,P,S,Mn)showed a different pattern with the highest observed concentrations in September and lowest concentrations in November.These observations may be indicative of seasonal changes in anthropogenic activities(e.g.,local residential coal combustion for heating in winter)and/or meteorological conditions(e.g.,precipitation and wind speed(Feng et al.2004)).
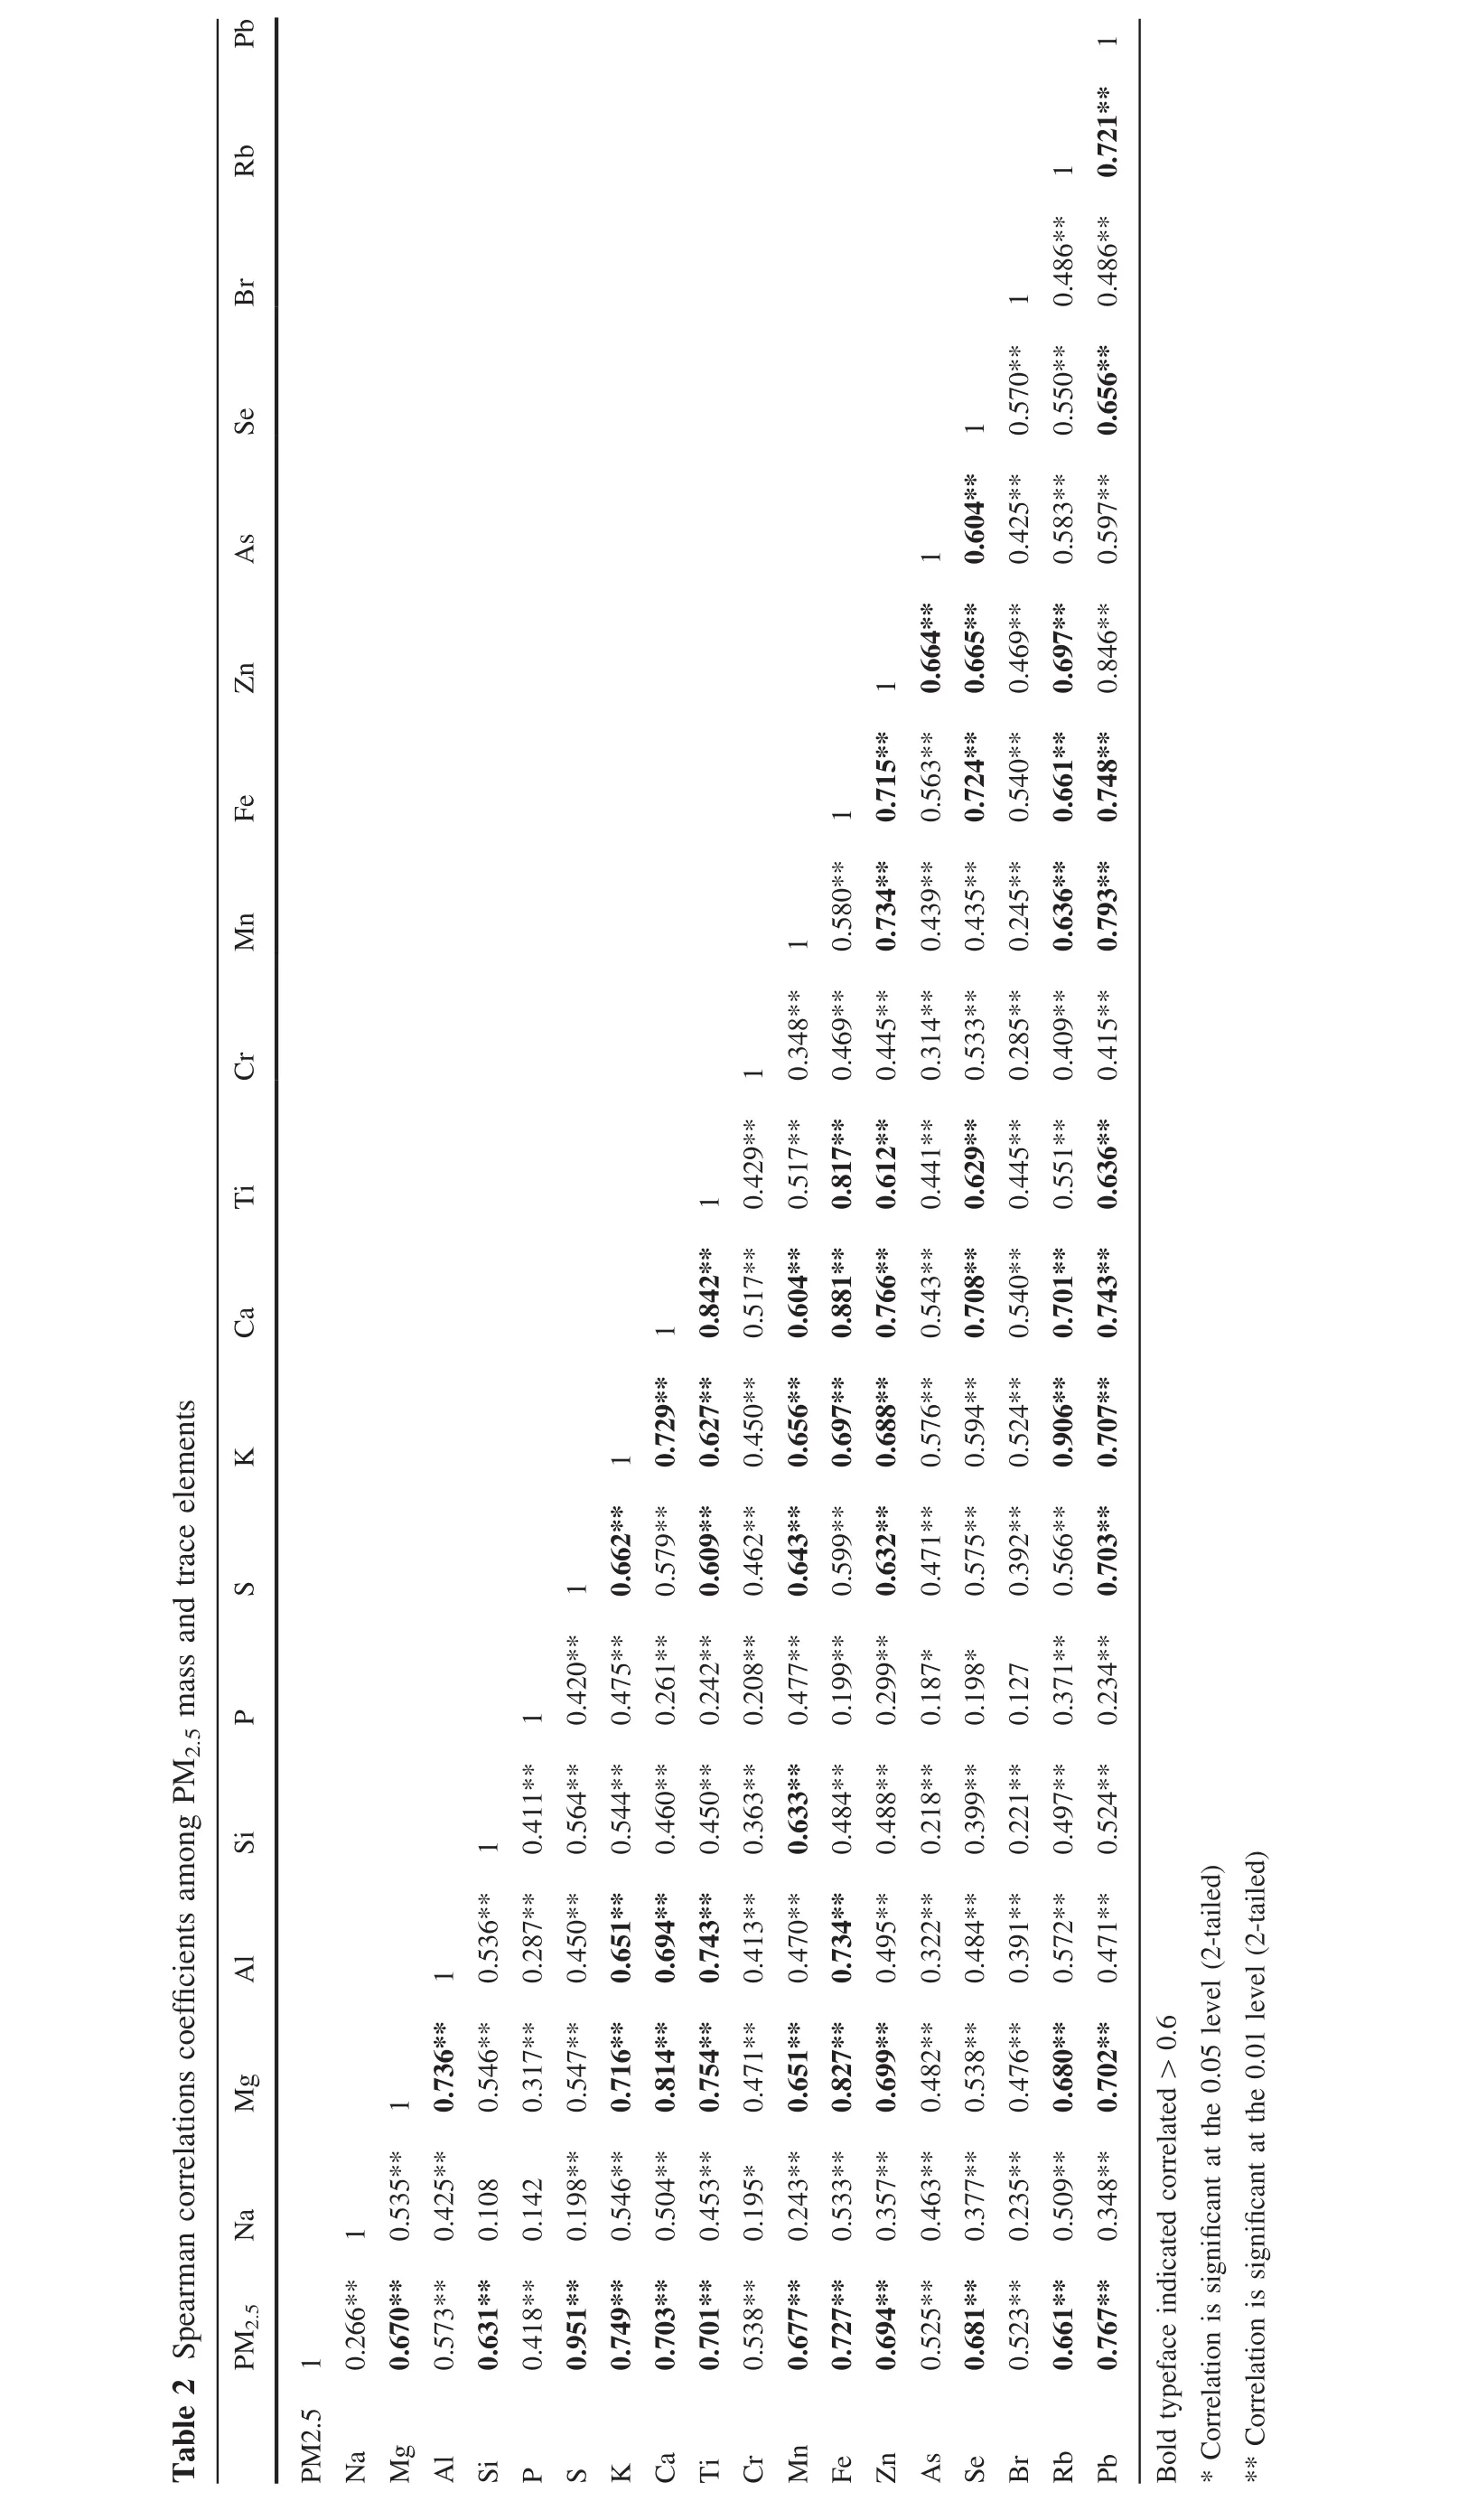
Spearman correlation coefficients among elements and PM2.5mass concentrations in 12-h integrated samples are presented in Table 2.Heavy metals such as Ti,Mn,Fe,Zn,Pb were positively related to PM2.5mass concentrations and to each other,signifying that those elements may have been emitted from the same source type(s).Concentrations of S,likely as sulfate(Pandis and Seinfeld.1992),also exhibited a strong positive correlation to PM2.5,with a coefficient of determination of 0.905.Sulfate,typically secondary sulfate,is often a relatively large fraction of PM2.5mass concentrations in areas impacted by major sources of SO2(Anderson et al.2004).High concentrations of PM2.5in the present study suggest the influence of emissions of primary PM2.5and secondary particle formation from precursors gaseous emitted from local and regional sources.Coal combustion is a major source of energy in Guiyang City,and the coal utilized contains significant quantities of toxic elements such as Pb,As,Hg,and S(Zhao et al.2008;Tian et al.2015).As a result,the large number of coal- fired power plants,residential coal burning boilers,and nonferrous smelting activities,such as Pb–Zn producing facilities may play a vital role in the high levels of heavy metals in observed in PM2.5during this study.
3.3 Enrichment factors
Enrichment factors(EFs)(Soto-Jiménez et al.2003)of elements relative to the earth’s crust were calculated to demonstrate the potential contribution of local anthropogenic sources to the observed elemental levels in the ambient air,which can be applied to identify the potential sources of crustal and anthropogenic components.The EF for each PM2.5element was calculated using Eq.(1):

where:
EFiis the enrichment factor of element i,Ciis the concentration of the element investigated in the PM2.5or the crust,CTiis the concentration of reference element(Ti)in the PM2.5or the crust.
In this study,the concentrations of elements in the local soil were calculated based upon the average composition across the Guizhou Province.In enrichment factor analysis Fe,Ti,and Al are typically used as reference elements(Nováková et al.2016;Wang J et al.2016).For this study Ti was chosen as the reference element for calculating enrichment due to its stability and its propensity to be less susceptible to deterioration,alteration,and weathering.As previously suggested(Chester et al.1999),EF values of less than 10 suggest that the element has a prominent crustal source,while an EF value greater than 10 suggests that a large proportion of that element has anthropogenic origins.
Results indicate that Se was the most enriched element in PM2.5,followed by Pb,Zn,Br,and As(Fig.6).These elements had high average EFs and ranged from 102to 103,suggesting the predominance of non-crustal sources.The EFs of Mg,Cr,Ca,K,Mn,Na,and Rb varied from 10 to 102on average,which suggest an influence from both soil and non-soil emission sources.The high EFs of Se and As suggest a coal combustion source,while high EFs of Pb,Zn,and bromine(Br)may reflect a large contribution from vehicle exhaust emission(Chao and Wong 2002).With low EFs,Al and Fe are thought to originate mostly from resuspended local soil.In 2014,our 1 year data verified the high levels of As in PM2.5in Guiyang,with the highest value recorded 10 times higher than the limit of 6.0 ng m-3for ambient air quality standards in China.Hence,the high EFs of Se,particularly As in PM2.5observed in the present study require further investigation.
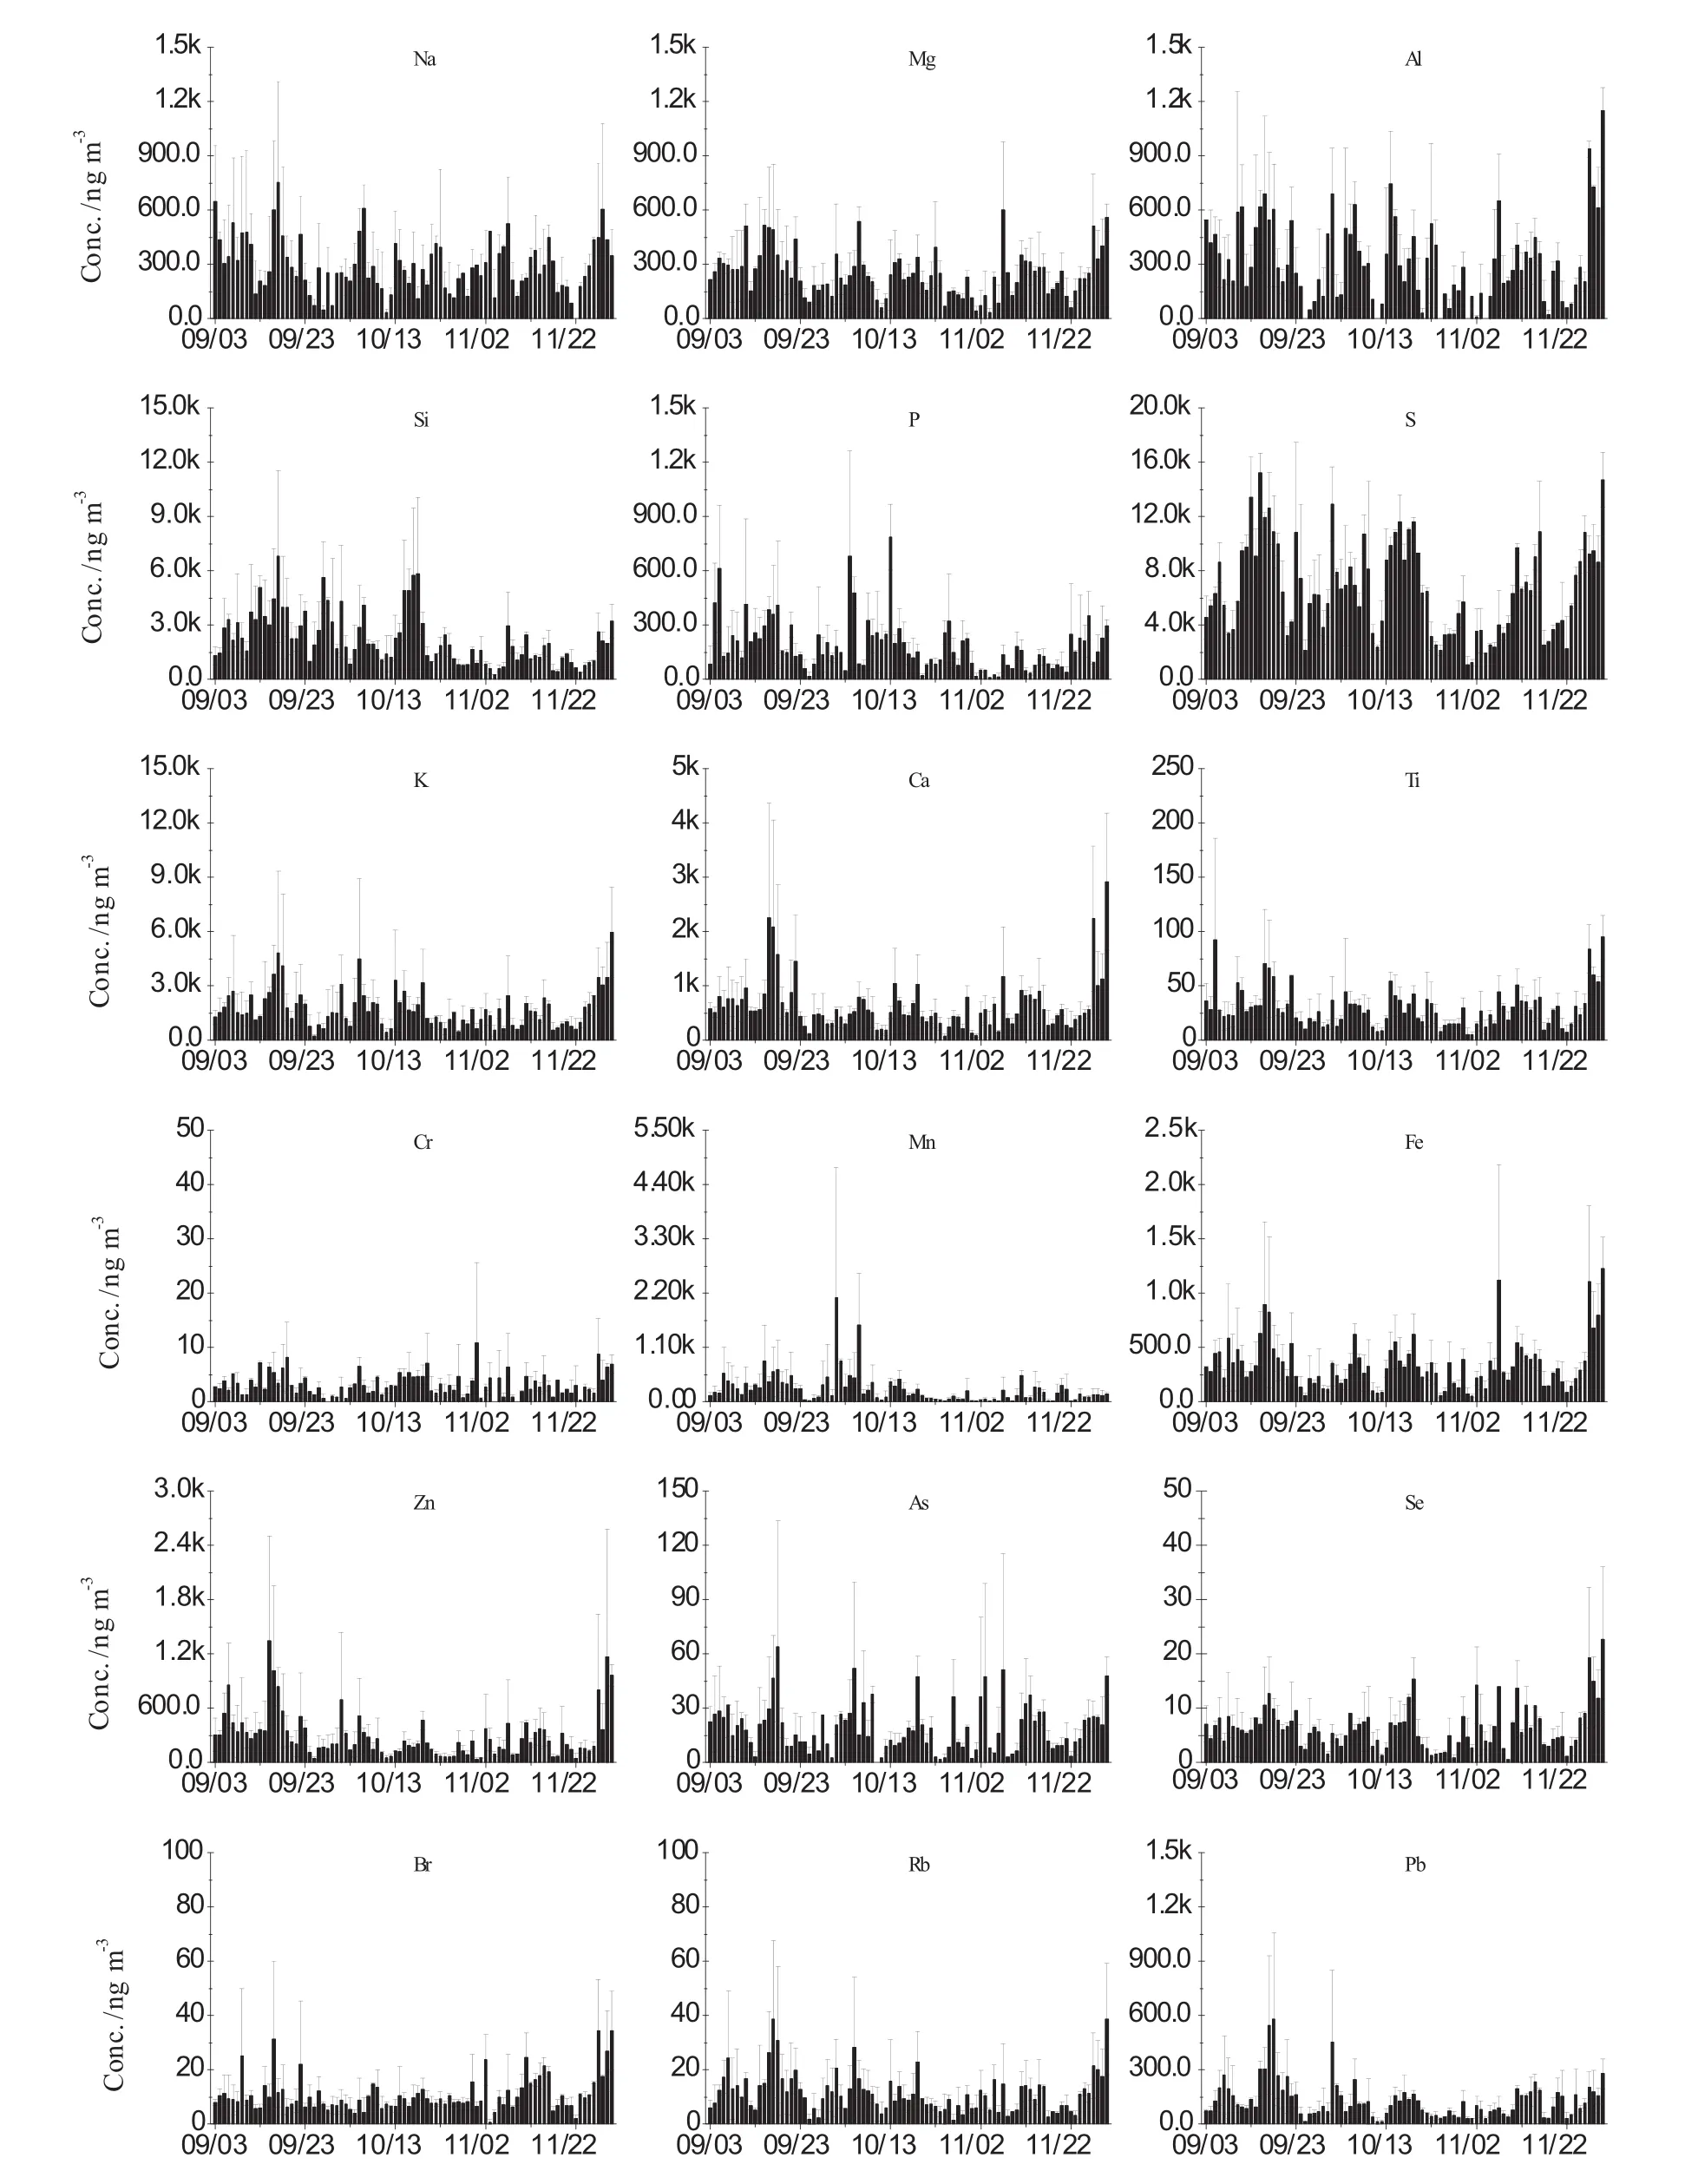
Fig.4 Daily concentrations of chemical elements of PM2.5collected in Guiyang
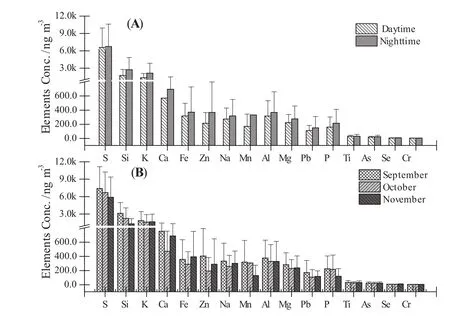
Fig.5 Comparison of trace element concentrations measured in PM2.5during the daytime and nighttime,study average(a)and the monthly average(b)
3.4 Principal component analysis
Principal component analysis (PCA)is commonly employed to reduce the dimensionality of complicated PM2.5datasets,grouping related chemical constituents,and identifying potential sources(Huang et al.2010).In this research,Varimax rotated PCA was conducted using SPSS 18.0 software,and results are presented in Table 3.Three major components were identified with Eigen values greater than 1 and accounted for a sum of 72%of all variances in the dataset.
The first component had high loadings of Fe,Ca,Se,Br,Al,Ti,Mg,Cr,and Zn,most of which were from the fugitive dust(Kong et al.2014).This component constituted 32%of the total variance.These elements were closely linked with the PM2.5mass concentrations.In general,this fugitive dust factor likely includes windblown dust,agricultural tilling,construction dust,coal flyash,and resuspended road dust.The element Se is typically considered an element associated with coal-combustion and has a high EFs;however,Al,Fe with low EFs,mainly originated from soil dust(Shen LJ et al.2016).In general,Cr is an important pollutant from solid waste treatment(Kulshrestha et al.2009).Zn typically comes from various industrial sources and the abrasion of rubber tires along the roads(Rogge et al.1993),and Br mainly originates from vehicle exhaust(Chan et al.1997).Component 1 is generally considered as typical of urban anthropogenic elements.Interestingly,Cr,Zn,and Br had high loadings(0.618,0.583,0.772),demonstrating that the solid waste treatment,industrial emissions,vehicle exhaust,and other pollution sources may somewhat contribute to fugitive dust due to long-term deposition of PM2.5on the surface in this polluted area(Farinha et al.2009).
Component 2 features loadings of Mn,Si,Pb,and S,comprising 19.7%of the total variance.This group of elements may represent multiple sources of industrial emissions.Usually,Mn,Pb,and S are regarded as indicators of the discharge from fuel burning and vehicle emissions(Pacyna and Pacyna 2002).The element Si is an indicator of emissions from soil dust,road dust,and construction dust.
Component 3 comprises 20%of the total variance and was mainly associated with Na,As,K,and Rb,which could be ascribed to solid waste incineration(Pacyna and Pacyna 2002).Combustion of pressure-treated lumber can emit As and K/Rb,both of which are associated with biomass combustion(Tao et al.2013).In addition,K,Rb,and As have been associated with iron/steel slag/sintering operations(Pancras et al.2013).
?
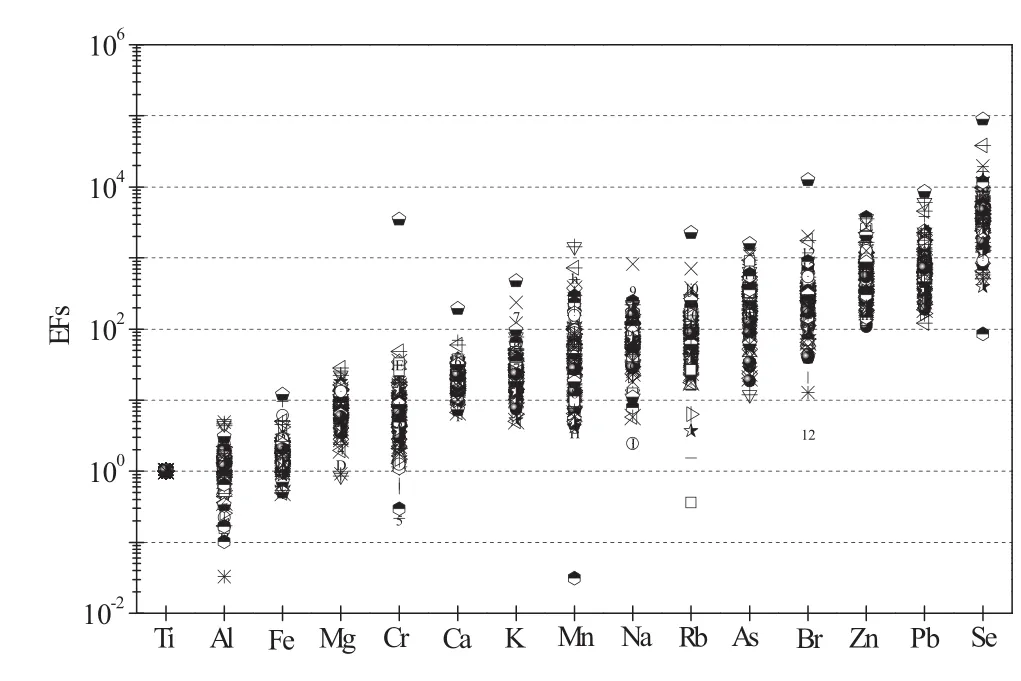
Fig.6 Enrichment factors(EFs)of elements in PM2.5
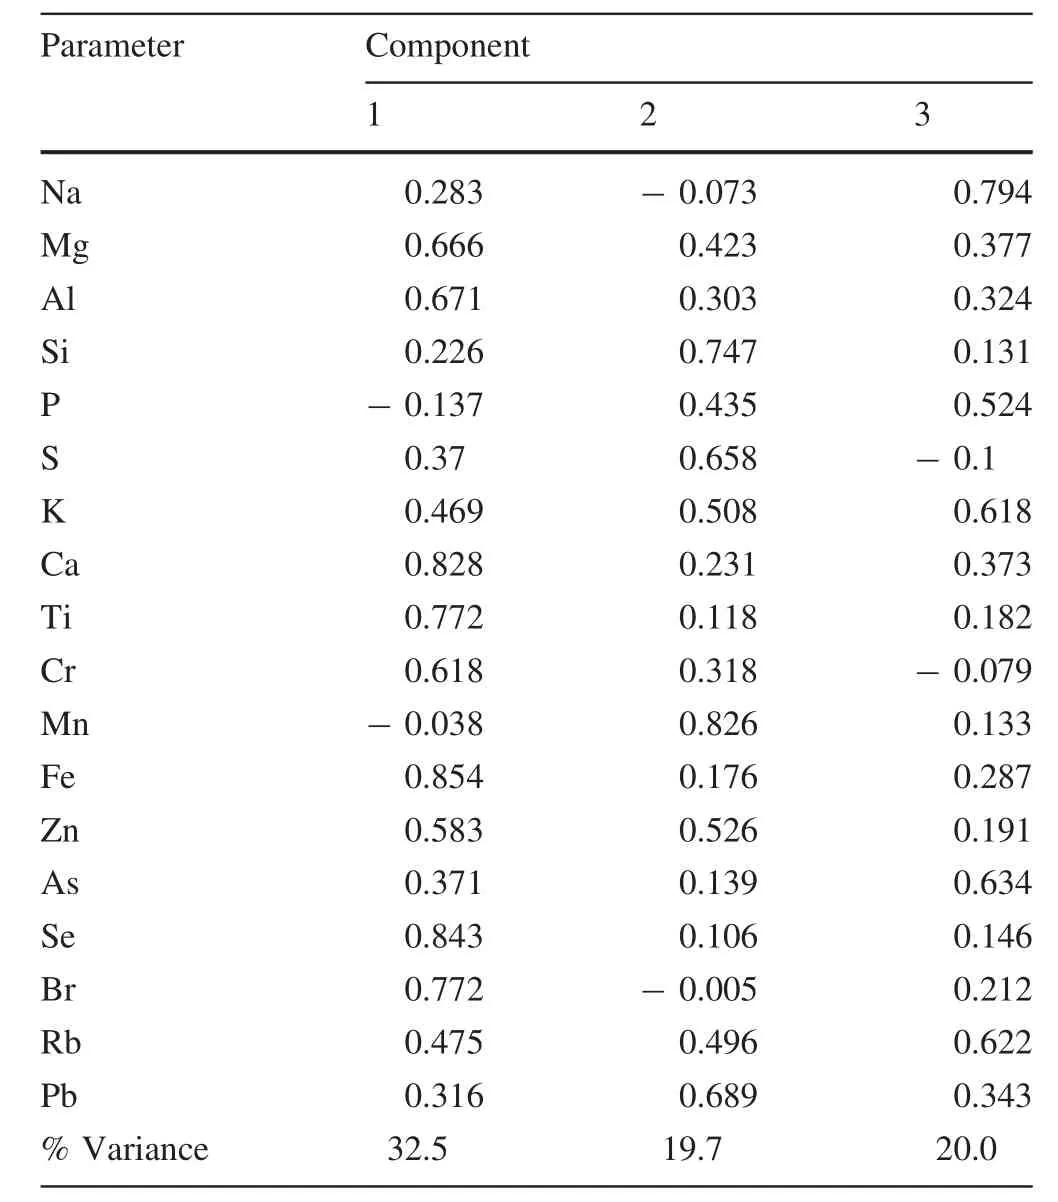
Table 3 Varimax rotated principal component factor analysis(PCA)loading matrix for elements in PM2.5from Guizhou
4 Conclusions
This pilot study presents characterizations of ambient PM2.5as well as its elemental constituents in samples collected in Guiyang,a developing inland city in southwest China.The 12-h integrated PM2.5concentrations showed a daytime average of 51 ± 22 μg m-3and a nighttime average of 55 ± 32 μg m-3,respectively.Nighttime PM2.5concentrations exhibited a wider range and variance compared to daytime PM2.5concentrations.The 24-h integrated PM2.5levels mean concentrations were 53 ± 25 μg m-3.The temporal variation of both PM2.5and its chemical elements suggested the influence of local anthropogenic activities influenced by daily fluctuations in meteorology.Enrichment factor analysis indicated that Se,Pb,Zn,Br,and As likely originated from human activities.The PCA analysis suggested that fugitive dust,combined sources of industrial pollution,motor vehicle emissions,and waste incineration were probably major contributors to atmospheric PM2.5in Guiyang.However,additional PM2.5monitoring covering all seasons and source apportionment modeling will be necessary in the future to further elucidate and refine the atmospheric PM2.5sources in Guiyang.In addition,the development of a local emission inventory from major sources would facilitate deterministic modeling runs that could be compared with receptor-based approaches in Guiyang,thus permitting the further identification of the sources,temporal variability,and chemical composition of ambient PM2.5.Ultimately,studies like these would assist local agencies in developing cost effective and efficient emissions management strategies that would reduce levels of PM to below current standards and better protect public health.
AcknowledgementsThe U.S.Environmental Protection Agency(EPA),through its Office of Research and Development,partially funded and participated in the research described here through cooperative agreement CR-833232-01 through the U.S.National Science Foundation-National Research Council Research Associateship Award.We acknowledge Dr.Teri L.Conner for X-Ray Fluorescence data analysis with her comments.The views expressed in this paper are those of the authors and do not necessarily reflect the views or policies of EPA.It has been subjected to EPA Agency review and approved for publication.Mention of trade names or commercial products does not constitute endorsement or recommendation for use.This research was also partially funded by the National Key Basic Research Program of China(2013CB430004)and the National Natural Science Foundation of China(No.40773067).
Adamson IY,Prieditis H,Hedgecock C,Vincent R(2000)Zinc is the toxic factor in the lung response to an atmospheric particulate sample.Toxicol Appl Pharmacol 166:111–119
Anderson RR,Martello DV,White CM,Crist KC,John K,Modey WK,Eatough DJ(2004)The regional nature of PM2.5episodes in the upper Ohio Rivervalley.JAir Waste Manag 54(8):971–984
Chan YC,Simpson RW,Mctainsh GH,Vowles PD,Cohen DD,Bailey GM(1997)Characterization of chemical species in PM2.5and PM10aerosols in Brisbane,Australia.Atmos Environ 31(22):3773–3785
Chan KL,Wang SS,Liu C,Zhou B,Wenig MO,Saiz-Lopez A(2016)On the summertime air quality and related photochemical processes in the megacity Shanghai,China.Sci Total Environ 580:974–983
Chao CY,Wong KK(2002)Residential indoor PM10and PM2.5in Hong Kong and the elemental composition.Atmos Environ 36(2):265–277
Charron A,Harrison RM(2005)Fine(PM2.5)and coarse(PM2.5-10)particulate matter on a heavily trafficked London highway:sources and processes.Environ Sci Technol 39:7768–7776
Chate DM,Rao PSP,Naik MS,Momin GA,Safai PD,Ali K(2003)Scavenging of aerosols and their chemical species by rain.Atmos Environ 37:2477–2484
Chester R,Nimmo M,Preston MR(1999)The trace metal chemistry of atmospheric dry deposition samples collected at Cap Ferrat:a coastalsite in the Western Mediterranean.MarChem 68(1–2):15–30
Costa DL,Dreher KL(1997)Bioavailable transition metals in particulate matter mediate cardiopulmonary injury in healthy and compromised animal models. Environ Health Perspect 105(Suppl.5):1053–1060
Crilley LR,Ayoko GA,Stelcer E,Cohen DD,Mazaheri M,Morawska L(2014)Elemental composition of ambient fine particles in urban schools:sources of children’s exposure.Aerosol Air Qual Res 14(7):1906–1916
Cristaldi M,Foschi C,Szpunar G,Carlo Brini,Marinelli F,Triolo L(2013)Toxic emissions from a military test site in the territory of Sardinia,Italy.Int J Env Res Publ Health 10(4):1631–1646
Dan M,Zhuang G,Li X,Tao H,Zhuang Y(2004)The characteristics of carbonaceous species and their sources in PM2.5in Beijing.Atmos Environ 38(21):3443–3452
Egondi T,Muindi K,Kyobutungi C,Gatari M,Rocklöv J(2016)Measuring exposure levels of inhalable airborne particles(PM2.5)in two socially deprived areas of Nairobi,Kenya.Environ Res 148:500–506
Farinha MM,Almeida SM,Freitas MC,Verburg TG,Wolterbeek HT(2009)Influence of meteorological conditions on PM2.5and PM2.5–10elemental concentrations on Sado estuary area,Portugal.J Radioanal Nucl Chem 282(3):815–819
Feng XB,Shang LH,Wang SF,Tang SL,Zheng W(2004)Temporal variation of total gaseous mercury in the air of Guiyang,China.J Geophys Res 109(109):215–229
Figueroa DA,Rodríguez-Sierra CJ,Jiménez-Velez BD(2006)Concentrations of Ni and V,other heavy metals,arsenic,elemental and organic carbon in atmospheric fine particles(PM2.5)from Puerto Rico.Toxicol Ind Health 22:87–99
Gao Y,Guo XY,Li HJ,Tang L,Ji HB(2015a)Characteristics of PM2.5in Miyun,the northeastern suburb of Beijing:chemical composition and evaluation of health risk.Environ Sci Pollut Res 22:16688–16699
Gao Y,Guo XY,Li HJ,Tang L,Ji HB(2015b)Characteristics of PM2.5in Miyun,the northeastern suburb of Beijing:chemical composition and evaluation of health risk.Environ Sci Pollut Res 22:16688–16699
Gu JX,Bai ZP,Li WF,Wu LP,Liu AX,Dong HY,Xie YY(2011)Chemical composition of PM2.5during winter in Tanjin,China.Particuology 9(3):215–221
HEI NPACT Review Panel(2013)Executive summary.HEI’s National Particle Component Toxicity(NPACT)initiative.Health Effects Institute,Boston
Huang J,Choi HD,Hopke PK,Holsen TM(2010)Ambient mercury sources in Rochester,NY:results from principle components analysis(PCA)of mercury monitoring network data.Environ Sci Technol 44(22):8441–8445
Huang RJ,Zhang YL,Bozzetti C,Ho KF,Cao JJ,Han YM,Daellenbach KR,Slowik JG,Platt SM et al(2014)High secondary aerosol contribution to particulate pollution during haze events in China.Nature 514(7521):218–222
Huang P,Zhang J,Tang Y,Liu L(2015)Spatial and temporal distribution of PM2.5pollution in Xi’an city,China.Int J Environ Res Public Health 12(6):6608–6625
Jung CH,Kim YP,Lee KW(2003)A moment model for simulating raindrop scavenging of aerosols.J Aerosol Sci 34:1217–1233
Kelly FJ,Fussell JC(2012)Size,source and chemical composition as determinants of toxicity attributable to ambient particulate matter.Atmos Environ 60:504–526
Kim JJ,Smorodinsky S,Lipsett M,Singer BC,Hodgson AT,Ostro B(2004)Traffic-related air pollution near busy roads–the East Bay children’s respiratory health study.Am J Respir Crit Care 170(5):520–526
Kodavanti UP,Hauser R,Christiani DC,Meng ZH,McGee J,Ledbetter A,Richards J,Costa DL(1998)Pulmonary responses to oil fly ash particles in the rat differ byvirtue of their specific soluble metals.Toxicol Sci 43:204–212
Kong SF,Ji YQ,Lu B,Zhao XY,Han B,Bai ZP(2014)Similarities and differences in PM2.5,PM10and TSP chemical profiles of fugitive dust sources in a coastal oil field city in China.Aerosol Air Qual Res 14:2017–2028
Kulshrestha A,Satsangi PG,Masih J,Taneja A(2009)Metal concentration of PM2.5and PM10particles and seasonal variations in urban and rural environment of Agra,India.Sci Total Environ 407(24):6196–6204
Lai SC,Zhao Y,Ding AJ,Zhang YY,Song TL,Zheng JY,Ho KF,Lee SC,Zhong LJ(2016)Characterization of PM2.5,and the major chemical components during a 1-year campaign in rural Guangzhou,southern China.Atmos Res 167:208–215
Landis MS,Norris GA,Williams RW,Weinstein J(2001)Personal exposures to PM2.5mass and trace elements in Baltimore,MD,USA.Atmos Environ 35:6511–6524
Lewtas J(2007)Air pollution combustion emissions:characterization of causative agents and mechanisms associated with cancer,reproductive, and cardiovascular effects. Mutat Res 636(1–3):95–133
Li G,Fang C,Wang S,Sun S(2016)The effect of economic growth,urbanization,and industrialization on fine particulate matter(PM2.5) concentrations in China.Environ Sci Technol 50(21):11452–11459
Marcazzan GM,Vaccaro S,Valli G,Vecchi R(2001)Characterization of PM10and PM2.5particulate matter in the ambient air of Milan(Italy).Atmos Environ 35:4639–4650
Morishita M,Keeler GJ,Kamal AS,Wagner JG,Harkema JR,Rohr AC(2011)Source identification of ambient PM2.5for inhalation exposure studies in Steubenville,Ohio using highly time resolved measurements.Atmos Environ 45(40):7688–7697
Nováková T,Grygar TM,Kotková K,Elznicová J,Strnad L,Mihaljevič M(2016)Pollution assessment using local enrichment factors:the Berounka River(Czech Republic).J Soil Sedim 16(3):1081–1092
Oakes MM,Burke JM,Norris GA,Kovalcik KD,Pancras JP,Landis MS(2016)Near-road enhancement and solubility of fine and coarse particulate matter trace elements near a major interstate in detroit,michigan.Atmos Environ 145:213–224
Paatero P,Hopke PK,Begum BA,Biswas SK(2005)A graphical diagnostic method for assessing the rotation in factor analytical models of atmospheric pollution.Atmos Environ 39(1):193–201
Pacyna EG,Pacyna JM(2002)Global emission of mercury from anthropogenic sources in 1995. Water Air Soil Poll 137(1):149–165
Pancras JP,Landis MS,Norris GA,Vedantham R,Dvonch JT(2013)Source apportionment of ambient fine particulate matter in Dearborn,Michigan,using hourly resolved pm chemical composition data.Sci Total Environ 448(6):2–13
Pandis SN,Seinfeld JH(1992)Heterogeneous sulfate production in an urban fog.Atmos Environ Part A 14:2509–2522
Pope CA III,Burnett RT,Thurston GD,Thun MJ,Calle EE,Krewski D,Godleski JJ(2004)Cardiovascular mortality and long-term exposure to particulate air pollution:epidemiological evidence of general pathophysiological pathways of disease.Circulation 109:71–77
Querol X,Alastuey A,Rodrigueza S,Plana F,Ruiza CR,Cotsb N,Massague G,Puig O(2001)PM10and PM2.5source apportionment in the Barcelona Metropolitan area,Catalonia,Spain.Atmos Environ 35:6407–6419
Raes F,Dingenen RV,Vignati E,Wilson J,Putaud JP,Seinfeld JH,Adams P(2000)Formation and cycling of aerosols in the global troposphere.Atmos Environ 34(25):4215–4240
Rogge WF,Hildemann LM,Mazurek MA,Cass GR,Simoneit BRT(1993)Sources of fine organic aerosol.3.Road dust,tire debris,and organometallic brake lining dust:roads as sources and sinks.Environ Sci Technol 27(9):1892–1904
Shen ZJ,Cao JJ,Zheng LM,Li L,Zhang Q,Li JJ,Han YM,Zhu CS,Zhao ZZ,Liu SX(2014)Day-night differences and seasonal variations of chemical species in PM10 over Xi’an,northwest China.Environ Sci Pollut Res 21(5):3697–3705
Shen ZX,Sun J,Cao JJ,Zhang LM,Zhang Q et al(2016)Chemical profiles of urban fugitive dust PM2.5samples in Northern Chinese cities.Sci Total Environ 569–570:619–626
Shen LJ,Wang HL,LüS,Li L,Yuan J,Zhang XH,Tian XD,Tang Q(2016)Observation of aerosol size distribution and new particle formation at a coastal city in the Yangtze River Delta,China.Sci Total Environ 565:1175–1184
Solomon PA,Costantini M,Grahame TJ,Gerlofs-Nijland ME,Cassee F,Russell AG,Brook JR,Hopke PK,Hidy G,Phalen RF,Saldiva P et al(2012)Air pollution and health:bridging the gap from sources to health outcomes:conference summary.Air Qual Atmos Health 5(1):9–62
Song Y,Zhang HY,Xie SD,Zeng LM,Zheng M,Salmon LG,Shao M,Slanina S(2006)Source apportionment of PM2.5in Beijing by positive matrix factorization. Atmos Environ 40(8):1526–1537
Soto-Jiménez M,Páez-Osuna F,Ruiz-Fernández AC(2003)Geochemical evidences of the anthropogenic alteration of trace metal composition of the sediments of Chiricahueto marsh(SE Gulf of California).Environ Pollut 125(3):423–432
Stanek LW,Sacks JD,Dutton SJ,Dubois JJB(2011)Attributing health effects to apportioned components and sources of particulate matter:an evaluation of collective results.Atmos Environ 45(32):5655–5663
Tao J,Zhang L,Engling G,Zhang R,Yang Y,Cao JJ,Zhu CS,Wang QY,Luo L(2013)Chemical composition of PM2.5,in an urban environment in Chengdu,China:importance of springtime dust storms and biomass burning.Atmos Res 122(3):270–283
Tian C,Zhang JY,Gupta R,Zhao YC,Wang S(2015)Chemistry,mineralogical,and residence of arsenic in a typical high arsenic coal.Int J Miner Process 141:61–67
Toledo VE,Quiterio SL,Arbilla G,Moreira A,Escaleira V,Moreira JC(2008)Evaluation of levels,sources and distribution of toxic elements in PM10in a suburban industrial region,Rio de Janeiro,Brazil.Environ Monit Assess 139(1–3):49–59
US EPA(2009)Final report:Integrated science assessment for particulate matter.U.S.Environmental Protection Agency,Washington,DC,EPA/600/R–08/139F
Wallenborn JG,Schladweiler MJ,Richards JH,Kodavanti UP(2009)Differential pulmonary and cardiac effects of pulmonary exposure to a panel of particulate matter-associated metals.Toxicol Appl Pharmacol 241(1):71–80
Wang XH,Bi XH,Sheng GY,Fu JM(2006)Chemical composition and sources of PM10and PM2.5aerosols in Guangzhou,China.Environ Monit Assess 119(1):425–439
Wang P,Cao JJ,Tie XX,Wang GH,Li GH,Hu TF et al(2015)Impact of meteorological parameters and gaseous pollutants on PM2.5and PM10mass concentrations during 2010 in Xi’an,China.Aerosol Air Qual Res 15:1844–1854
Wang J,Pan YP,Tian SL,Chen X,Wang L,Wang Y(2016)Size distributions and health risks of particulate trace elements in rural areas in northeastern China.Atmos Res 168:191–204
Wang JZ,Ho SSH,Ma SX,Cao JJ,Dai WT,Liu SX et al(2016)Characterization of PM2.5in Guangzhou,China:uses of organic markers for supporting source apportionment.Sci Total Environ 550:961–971
Wang YL,Yang W,Han B,Zhang WJ,Chen MD,Bai ZP(2016)Gravimetric analysis for PM2.5mass concentration based on year-round monitoring at an urban site in Beijing.J Environ Sci-China 40:154–160
White EM,Keeler GJ,Barres J,Landis MS(2013)Determination of mercury wet deposition physicochemistry in the Ohio River Valley through automated sequential sampling.Sci Total Environ 448:107–119
World Health Organization(2005)WHO air quality guidelines for particulate matter,ozone,nitrogen dioxide and sulfur dioxideglobal update 2005-summary of risk assessment.WHO/SDE/PHE/OEH/06.02,Geneva,Switzerland
Xu G,Li XQ,Huang RS,Jiang W,Ding WC(2008)Seasonal variations of HCOOH and HCHO in precipitation in Guiyang.Environ Sci 29(7):1780–1784
Xu XH,Liu N,Landis MS,Feng XB,Qiu GL(2016)Characteristics and distributions of atmospheric mercury emitted from anthropogenic sources in Guiyang,southwestern China.Acta Geochim 35(3):240–250
Xu HM,Cao JJ,Chow JC,Huang RJ,Shen ZX,Chen LWA et al(2016)Inter-annual variability of wintertime PM2.5chemical composition in Xi’an,China:evidences of changing source emissions.Sic Total Environ 545:546–555
Yamasoe MA,Artaxo P,Miguel AH,Allen AG(2000)Chemical composition of aerosol particles from direct emissions of vegetation fires in the Amazon Basin:water-soluble species and trace elements.Atmos Environ 34(10):1641–1653
Yan SJ,Cao H,Chen Y,Wu CZ,Hong T,Fan HL(2016)Spatial and temporal characteristics of air quality and air pollutants in 2013 in Beijing.Environ Sci Pollut Res 23:13996–14007
Yang J,Fu Q,Guo XS,Chu BL,Yao YW,Teng YG,Wang YY(2015)Concentrations and seasonal variation of ambient PM2.5,and associated metals at a typical residential area in Beijing,China.Bull Environ Contam Toxicol 94(2):232–239
Ye BM,Ji XL,Yang HZ,Yao XH,Chan CK,Cadle SH,Chan T,Mulawa PA(2003)Concentration and chemical composition of PM2.5in Shanghai for a 1-year period.Atmos Environ 33:499–510
Zhao YC,Zhang JY,Huang WC,Wang ZH,Li Y,Song DY,Zhao FH,Zheng CG(2008)Arsenic emission during combustion of high arsenic coals from Southwestern Guizhou,China.Energy Convers Manag 49:615–624
Zhao MF,Qiao T,Huang ZS,Zhu MY,Xu W,Xiu GL,Tao J,Lee SC(2015)Comparison of ionic and carbonaceous compositions of PM2.5in 2009 and 2012 in Shanghai,China.Sci Total Environ 536:695–703
Zhu CS,Cao JJ,Zhou JM,Liu SX,Dai WT,Zhang T,Zhao ZZ,Shen ZX,Li H,Wang P(2015)A case study of chemical characteristics of daytime and nighttime ambient particles in Shanghai,China.Atmosphere 6(8):1141–1153
ZíkováN,Wang YG,Yang FM,Li XH,Tian M,Hopke PK(2016)On the source contribution to Beijing PM2.5concentrations.Atmos Environ 134:84–95
杂志排行
Acta Geochimica的其它文章
- Limestone mechanical deformation behavior and failure mechanisms:a review
- Thermodynamic properties of San Carlos olivine at high temperature and high pressure
- Geochemistry and petrology of rift-related mafic sills and arc-related Gabbro–Diorite bodies,Northern Bafq District,Central Iran
- A study of groundwater irrigation water quality in south-central Bangladesh:a geo-statistical model approach using GIS and multivariate statistics
- Influence on lacustrine source rock by hydrothermal fluid:a case study of the Chang 7 oil shale,southern Ordos Basin
- Elemental characteristics of lacustrine oil shale and its controlling factors of palaeo-sedimentary environment on oil yield:a case from Chang 7 oil layer of Triassic Yanchang Formation in southern Ordos Basin
