A study of groundwater irrigation water quality in south-central Bangladesh:a geo-statistical model approach using GIS and multivariate statistics
2018-06-27AtikulIslamMdMostafizurRahmanMdBodrudDozaMdIftakharulMuhibMashuraShammiAnwarZahidYeasminAkterMasaakiKurasaki
M.Atikul Islam•Md.Mostafizur Rahman•Md.Bodrud-Doza•Md.Iftakharul Muhib•Mashura Shammi,4•Anwar Zahid•Yeasmin Akter•Masaaki Kurasaki
1 Introduction
Bangladesh is a densely populated climate-vulnerable country with predicted population growth of 26.6%by 2050(IIASA 2013).Drinking and irrigation water sources will consequently face extra pressure.Growing demand may cause significant changes in the hydrologic system,such a drop in the groundwater table or water quality deterioration(Konikow and Kendy 2005;Ferguson and Gleeson 2012).Conditions may be aggravated by climate change and sea level rise,which may lead to saltwater intrusion in surface-and groundwater(Werner and Simmons 2009;Green et al.2011;Taylor et al.2013).In Bangladesh,80%of irrigation water is estimated to come from groundwater,and this number seems to be growing(CSIRO 2014).Bangladesh is an irrigated-agriculture based country and is dependent on adequate water supply(Shahid et al.2006).To safeguard healthy growth and sustainable yield of crops,the water used for the irrigation must meet quality standards(Vyas and Jethoo 2015).
Central and south-central Bangladesh is facing deterioration of groundwater quality mainly due to low river flow,lack of management,climatic factors,and anthropogenic activity.Both surface water and groundwater are facing increased demand and pollution(Sikder et al.2013;Islam et al.2017).Halim et al.(2010)studied the controlling processes of geochemical constituents in deep groundwater in southern Bangladesh,focusing on arsenic mobilization and spatial distribution.Arsenic contamination and mobilization into groundwater is one of several threats to water quality in central Bangladesh(BGS and DPHE 2001;Rahman et al.2016).Bangladesh has great diversity of physiographic settings,with complex interactions among them that could be significant factors for the quality of soil and water resources.According to the World Health Organization(WHO 2007),increasing salinity is a problem in many major rivers in the world;as salinity levels approach 1000 mg/L,water becomes less useful as it is no longer palatable.With sea level rise,water and soil salinity along the coast will increase,altering characteristics of coastal soil and water(Charbeneau 2000).Salinity intrusion is a major problem in southern Bangladesh(FAO/UNDP 1985).According to SRDI(1998)the newly saline area is increasing day by day and districts like Jessore,Khulna,Magura,and Gopalganj are considered potentially threatened area.Previous studies have reported the occurrence of salinity in surface water(Shammi et al.2017)of the adjacent area near the coast at Khulna(Shammi et al.2016a,b),Jessore and Gopalganj(Shammi et al.2012),and Barguna and Patuakhali(Islam et al.2017).The Gopalganj district is located in the upper deltaic plain(UDP)of the southern region of Bangladesh(Faneca Sanchez et al.2015).The dynamic behavior of the UDP makes groundwater susceptible to salinity intrusion due to low flow conditions of the river and rising sea level.Foster(1995)investigated the threat to groundwater quality of intensive use and increased human activity.
Comprehensive groundwater quality assessment is a rigorous and very complex process that is interlinked with numerous physical and chemical variables along with various controlling factors.Recently,many researchers have developed water quality indices(WQIs)for evaluation of groundwater based on input parameters and required results(Vasanthavigar et al.2012;Singh et al.2013;Shahid et al.2014;Tiwari et al.2014).To evaluate irrigation water quality(IWQ),numerous indices have been specially developed;a geographic information system(GIS)-based IWQ index(IWQI)has been developed for calculating sodium adsorption ratio(SAR),residual sodium bicarbonate(RSBC),or soluble sodium percentage(SSP)with other parameters(Simsek and Gunduz 2007;Ashraf et al.2011).More recently,Romanelli et al.(2012)developed an index following the restricted IWQ(RIWQ)to assess groundwater suitability for irrigation in west Pampa Plain,Argentina.In addition,Bozdag(2015)has used an analytic hierarchy(AHP)along with GIS to assess IWQ in central Anatolia,Turkey.Since 2000,several researchers in Bangladesh have used various IWQ parameters to evaluate groundwater quality and its suitability for irrigation(Bahar and Reza 2010;Rahman et al.2012;Bhuiyan et al.2010).While there have been a good number of studies regarding IWQ assessment tools,few comprehensive assessment tools have incorporated the major IWQ parameters of salinity hazard,permeability hazard,and specific ion toxicity based on spatial distribution models and mapping.In Bangladesh,a thorough GIS-based IWQ assessment has yet not been done.The requirements for the IWQ index could vary regionally depending on agricultural systems,crop patterns,prevailing soil and edaphic factors,and local weather patterns.Mapping of IWQ indices and their temporal behavior could illuminate seasonal effects on IWQ.Geo-statistical models along with spatial distribution maps might strengthen the assessment process.Many such interpolation techniques have been previously discussed(Goovaerts 1997;Webster and Oliver 2001;Kumari et al.2013;Agca et al.2014).
Although some previous research on water quality,salinity intrusion,and suitability for irrigation have been done in south-central Bangladesh,a comprehensive evaluation of IWQ using geo-statistical models and spatial distribution mapping of indices is yet to be done in the Gopalganj district.Therefore,the objectives of this research were to assess groundwater quality and to develop an IWQ index(IWQI)for the study area.Spatio-temporal distribution of IWQIs was done using a GIS-based ordinary kriging(OK)model for the study area to show the spatial extent of studied parameters.This study should be a useful resource for the scientific community and for decision makers involved in the sustainable management of groundwater.
2 Materials and methods
2.1 Study area
The study was conducted in Gopalganj district in southcentral Dhaka division,Bangladesh.The study area is about 1490 km2around 23°47′N and 89°49′E and has a population of about 12 million.The southwest monsoon of the Indian Ocean dominates the climate and rainfall distribution.The Gorai,Madhumati,Kaliganj,and Ghagar are the main rivers that flow through the tropical Gopalganj district.The river channels carry flood waters to the Bay of Bengal and they also act as drainage channels for rainfall and tides.A complex interaction of freshwater from upstream,tidal flows,storm surges,and tropical cyclones govern coastal hydrology,which is also affected by the physiography of the coastal plains(FAO/UNDP 1985).Annual rainfall in Gopalganj averages 1620 mm and temperature is in the range of 9–30 °C(BBS 2011).
2.2 Sample collection and analytical procedure
In brief,46 groundwater samples were collected in two seasons(wet-monsoon:January to April 2013,n=23;and dry-monsoon:October 2012 and June 2013,n=23)(Fig.1).Sampling points were at existing groundwater monitoring wells across the study area.Water sample collection and analysis followed the procedure described by Islam et al.(2017).Groundwater samples were collected in 500-mL polystyrene bottles and chemical analyses followed standard guidelines(APHA 2005).Prior to sample collection,bottles were washed with 1:1 HNO3and rinsed three times with distilled water.Samples were collected after pumping the wells for 15–20 min and filtered through 0.45-μm membranes to avoid debris.To preserve the samples for trace metal analysis,they were acidified with concentrated HNO3(AR grade:60%–61%and density:1.38 kg/L)and stored at 4 °C.Temperature(°C),pH,electrical conductivity(EC),and total dissolved solids(TDS)were measured in situ by Portable Multi-Meter(Hach,sensION+MM150).Chloride (Cl-),nitrate(NO3-),sulfate(SO42-),phosphate(PO43-),and fluoride(F-)were measured by ion chromatography.Carbonate(CO32-)and bicarbonate(HCO3-)were determined by HCl titration.Calcium(Ca2+),magnesium(Mg2+),sodium(Na+),and potassium(K+),were determined by atomicabsorption spectrophotometer(Varian AAS,680FS).Arsenic(As)was measured by the silver diethyldithiocarbamate method(0–0.2 mg/L)at 520 nm wavelength using a spectrophotometer(DR 2800,HACH Germany).Manganese(Mn)was determined by the 1-(2-pyridylazo)-2-naphthol method(0.006–0.7 mg/L)using a spectrophotometer at 560 nm(DR 2800,HACH Germany).Iron(Fe)was measured by FerroZine iron reagentmethod(0.009–1.4 mg/L)using a spectrophotometer(DR 2800,HACH Germany)at 562 nm;boron(B)was determined by the azomethine-H method(0.02–1.50 mg/L)at wavelength 410 nm(DR 2800,HACH Germany);iodine(I)was quantified by theN,N-diethyl-p-phenylenediamine method(0.07–7.00 mg/L)using a spectrophotometer(DR 2800,HACH Germany)at 530 nm;bromine(Br)was determined by spectrophotometer(DR 2800,HACH Germany)following theN,N-diethyl-p-phenylenediamine method(0.05–4.50 mg/L)at 530 nm.Quality control was maintained in all trace metal analyses according to respective instruction manuals and method precision was more than 95%in confidence interval.Each method was recalibrated after running ten samples and all analyses were performed in triplicate to ensure precision.Overall data reproducibility for ions was within±10%.Cation and anion charge balance(<10%)was added proof of the precision of the data.Chemical analyses were carried out in Bangladesh Council of Scientific and Industrial Research(BCSIR)laboratory,and water research laboratory of Bangladesh University of Engineering and Technology (BUET),Dhaka.
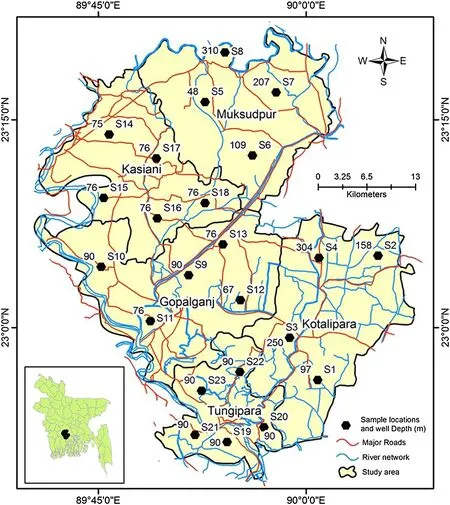
Fig.1 GIS location map for the sampling points with sampling depths of the study area,Gopalganj Bangladesh
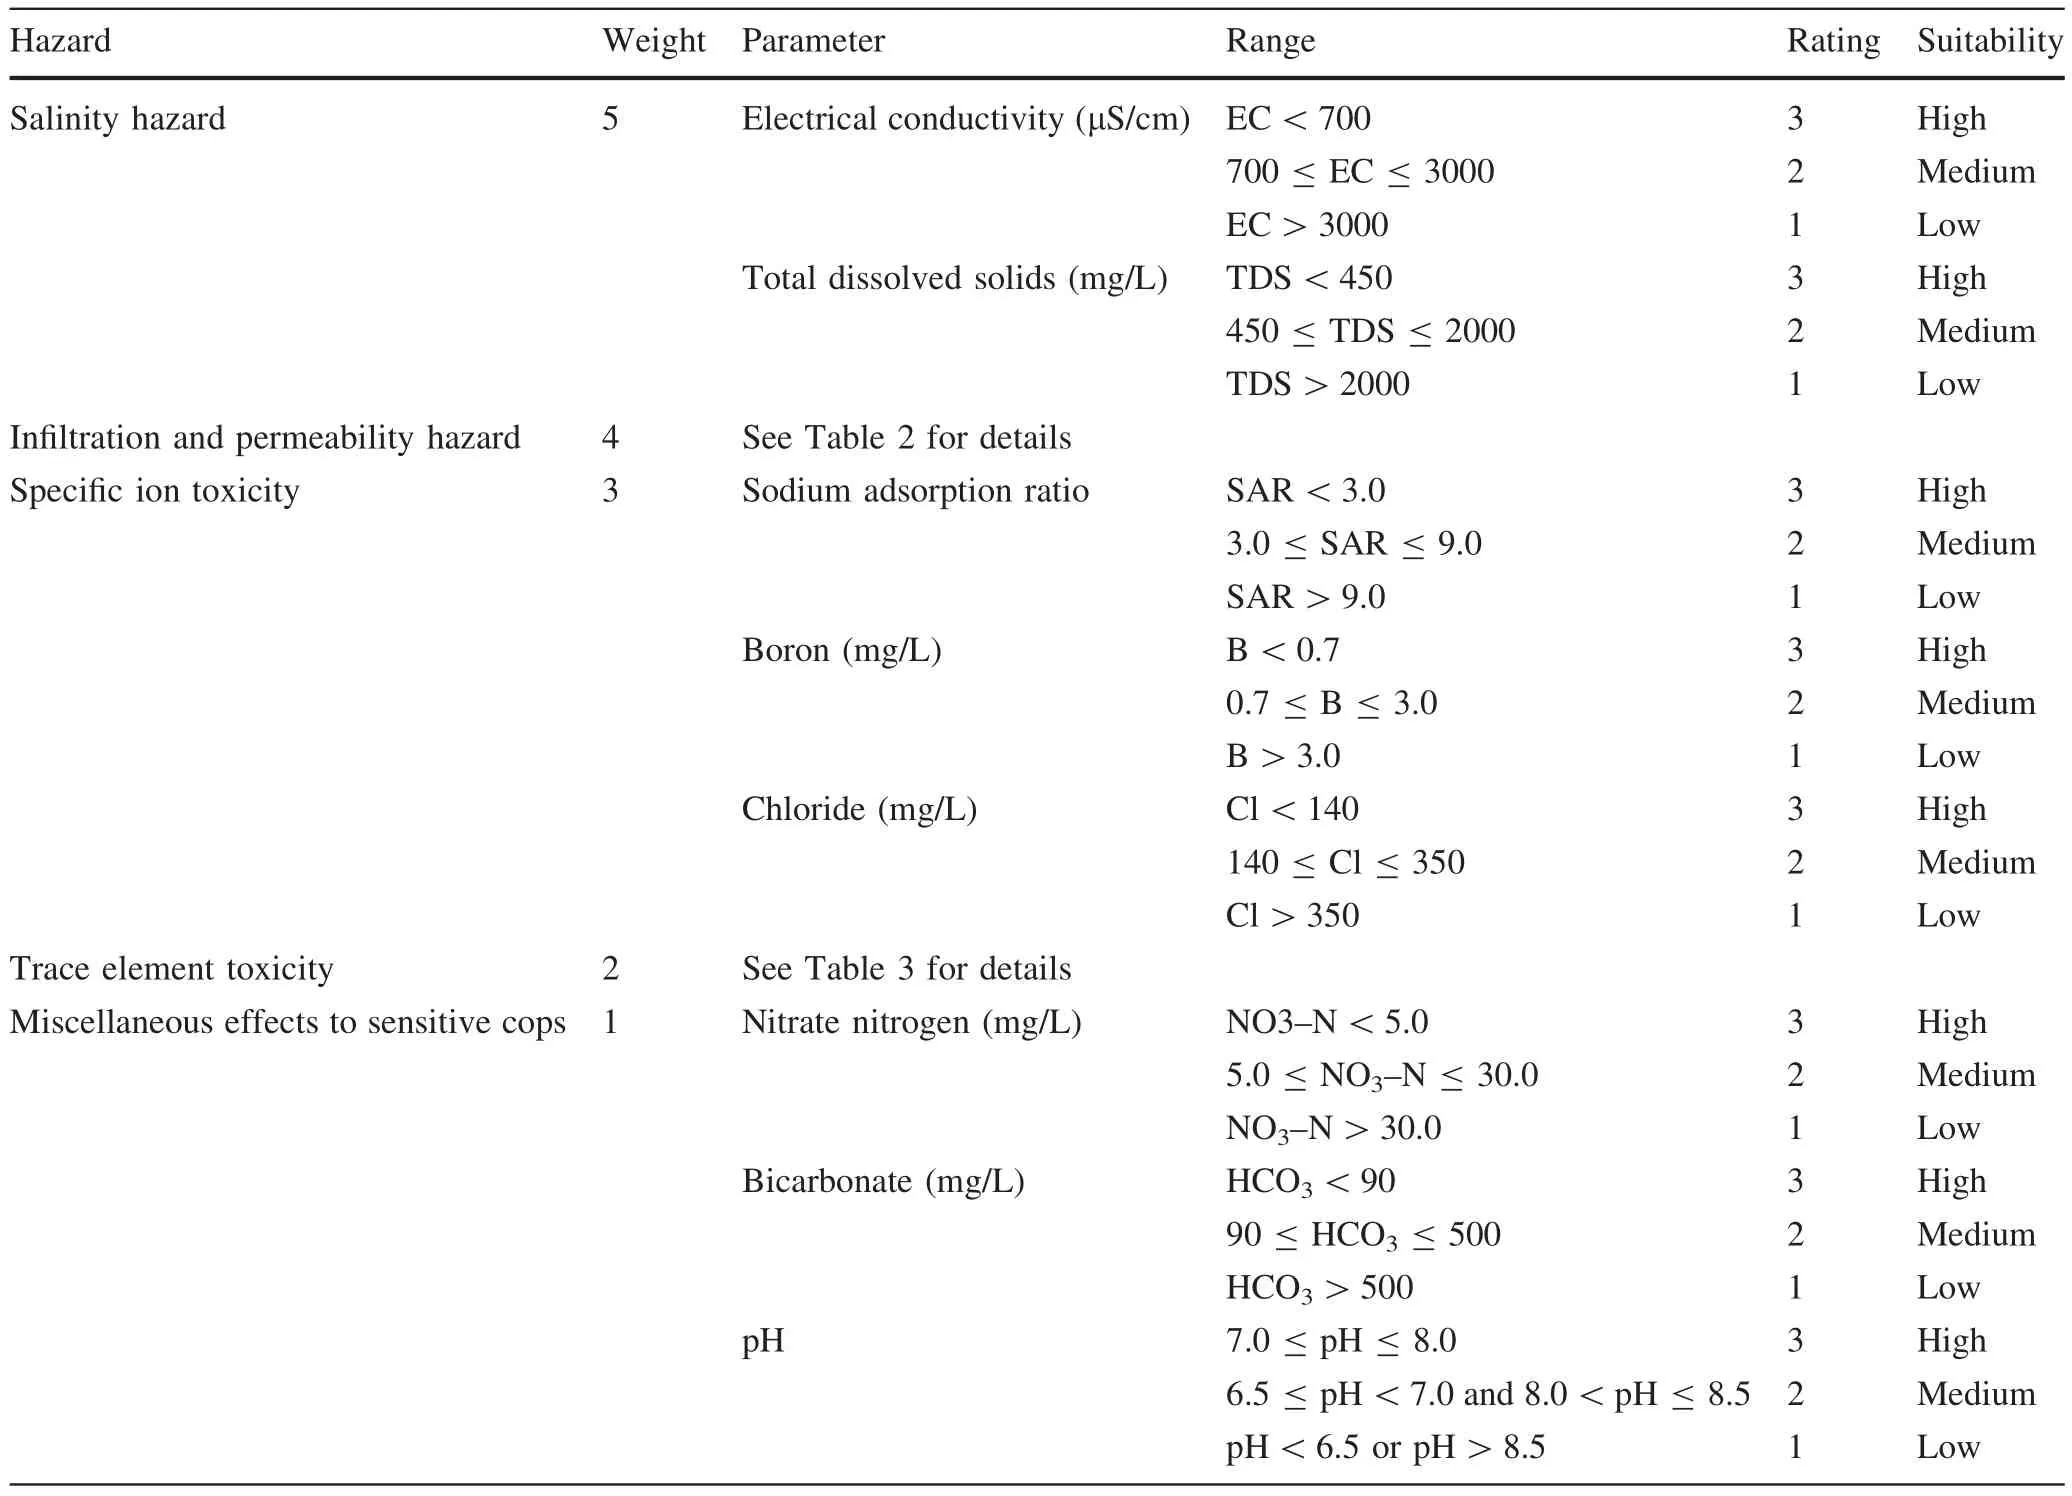
Table 1 Classification for IWQ index parameters
2.3 Irrigation water evaluation indices
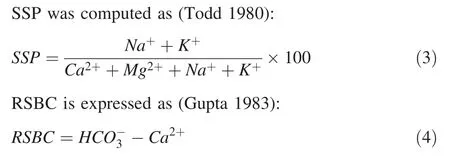
Total hardness(TH),SAR,SSP,RSBC,permeability index(PI),magnesium adsorption ratio(MAR),and Kelley’s ratio(KR)were calculated using their respective equations(Eqs.1–7).
TH in ppm(Todd 1980;Raghunath 1987)was calculated as:

Table 2 Classification for in filtration and permeability hazard
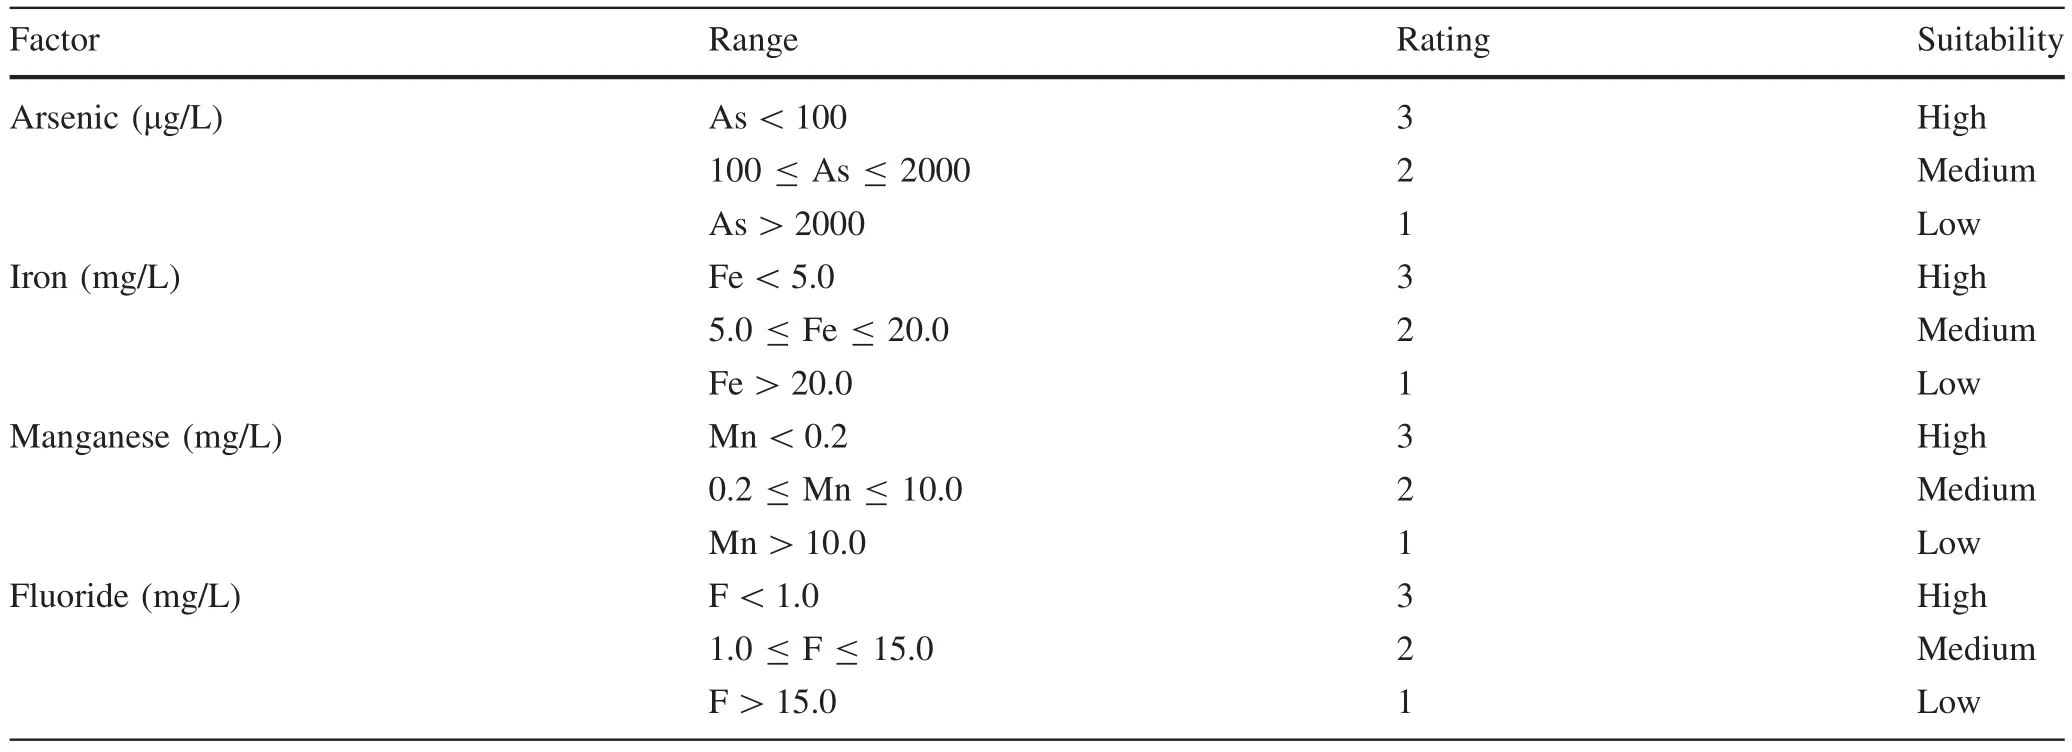
Table 3 Classification for trace element toxicity
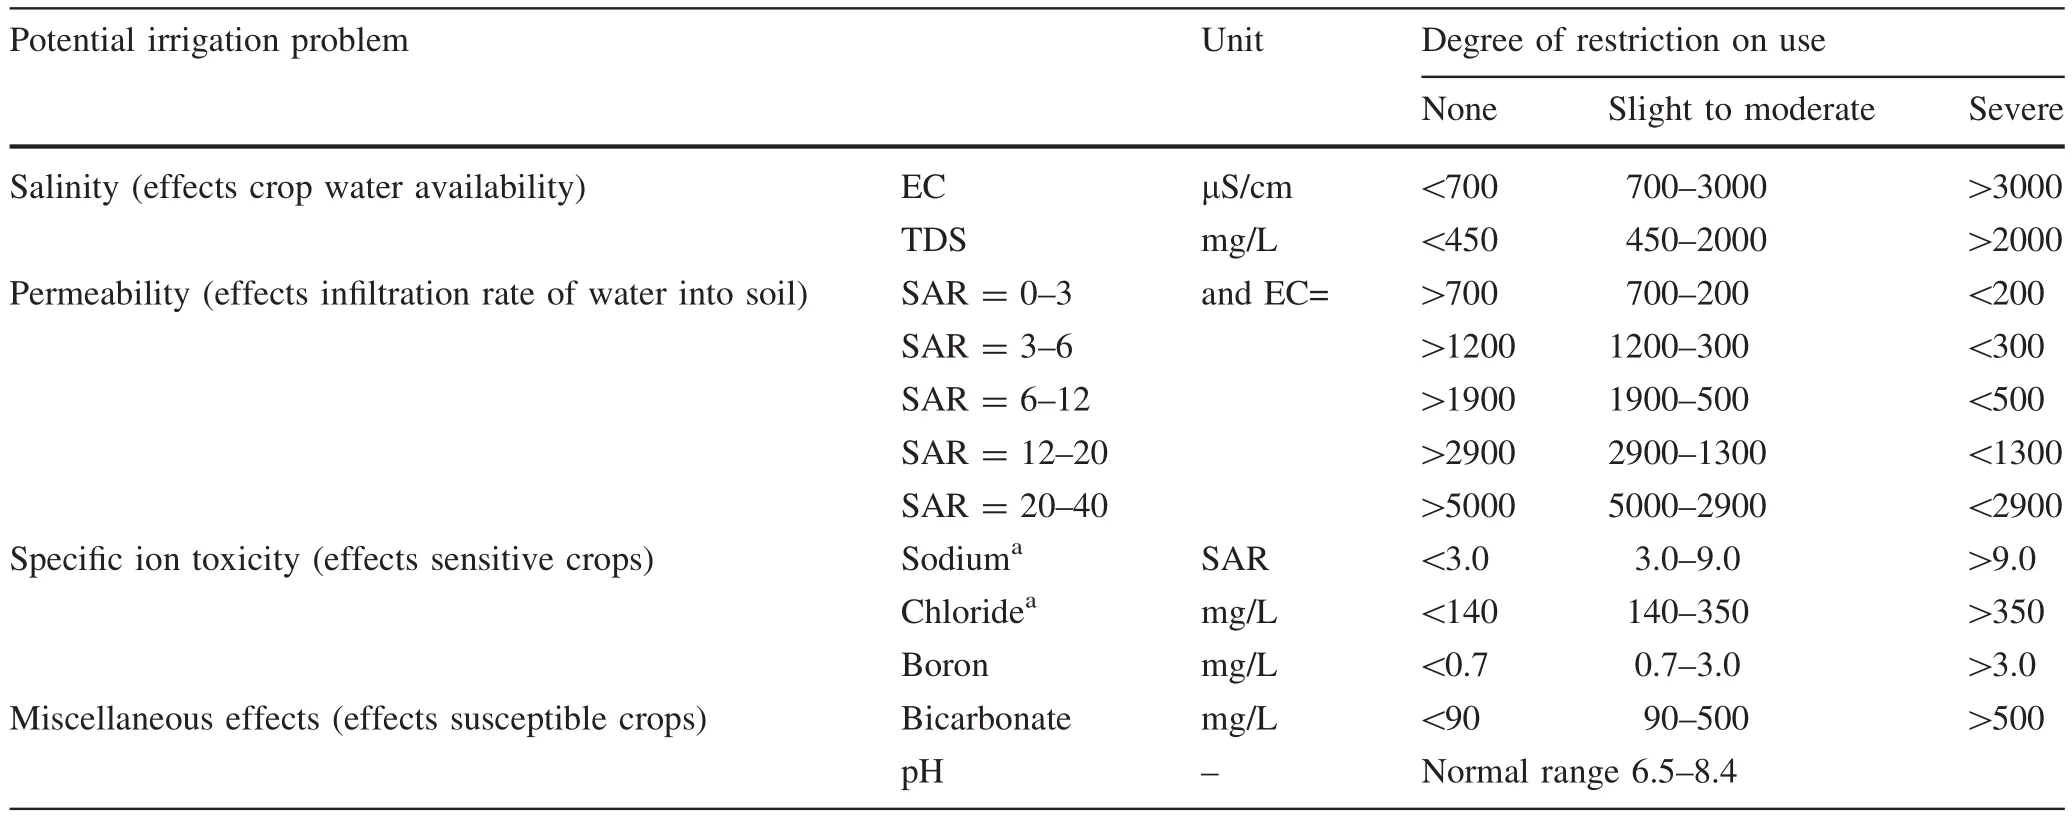
Table 4 Irrigation water quality criteria classification(Ayers and Westcot 1985)

According to US Salinity Laboratory(Richards 1954),SAR is expressed as:

?
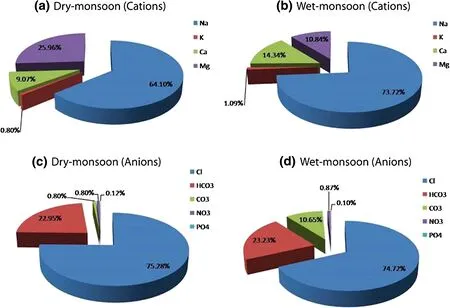
Fig.2 Percent distribution of the mean of major ions in the groundwater samples of the study area.a major cations in dry-monsoon;b major cations in wet-monsoon;c major anions in dry-monsoon;d anions in wet-monsoon

MAR(Raghunath 1987),also known as magnesium hazard(MH)was calculated as:

Lastly,Kelley’s ratio(KR)(Kelley 1940)is:

All ionic concentrations were considered in meq/L.These calculated parameters and individual chemical parameters were compared with national and international standards to assess irrigation suitability.
2.4 Irrigation water quality index
IWQ parameters were used to establish a single index value.Ayers and Westcot’s(1985)four groups of IWQ parameters were selected:(1)salinity hazard,(2)permeability hazard,(3)specific ion toxicity,and(4)miscellaneous effects(Table 1).Detailed procedures for IWQIs are described in Simsek and Gunduz(2007).All parameters are given a weight coefficient(Table 4)from highest(5)to lowest(1),based on their importance in irrigation.For instance,the salinity hazard is the most important factor and miscellaneous effects,the least.IWQI was calculated as:

where IWQ is an incremental index andGrepresents the contribution of each one of the four hazard categories.Gwas calculated as:

where,kis an incremental index;N,the total number of parameters for the calculation;w,the weight value of selected groups;andr,the rating value of each parameter,as given in Table 4.
2.5 Multivariate statistical analysis
Principal component analysis (PCA) is a widely used statisticaltool that can reduce a large number of variables to a simple set of latent factors to explore interrelationships among observed variables(Islam et al.2017).Factor analysis of the hydrochemical data was performed on SPSS version 22.At the firststep,correlation matrices were created using R mode.In the second step,principal components(PCs)were extracted by eigenvalue.Following Kaiser(1960),all factors having eigenvalue higher than 1 were included in calculations.To ensure better interpretation,extracted components were rotated.Rotation does not affect goodness of fit of factor solution(Jiang et al.2009).Factor 1 has the highest eigenvalue and explains the largest variation in the dataset.Factor 2 has the second highest eigenvalue,and so on.According to the approach of Liuetal.(2003),the terms‘strong,’‘moderate,’’and ‘weak’were applied to factor loadings and referred to absolute loading values of>0.75,0.75–0.50,and 0.50–0.30,respectively.This scale was used to measure the goodness of explaining each component’s variance relationship.
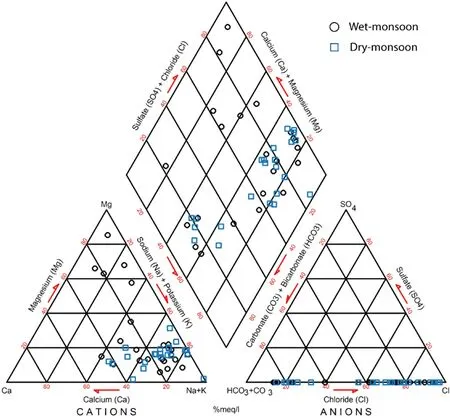
Fig.3 Piper diagrams of the ground water samples of the study area for wet and dry-monsoon period
2.6 Geostatistical modelling

Fig.4 Gibb’s plot represents the potential sources of ions in the groundwater of the study area.a TDS versus Na+/Na++Ca2+;b TDS versus Cl-/Cl-+
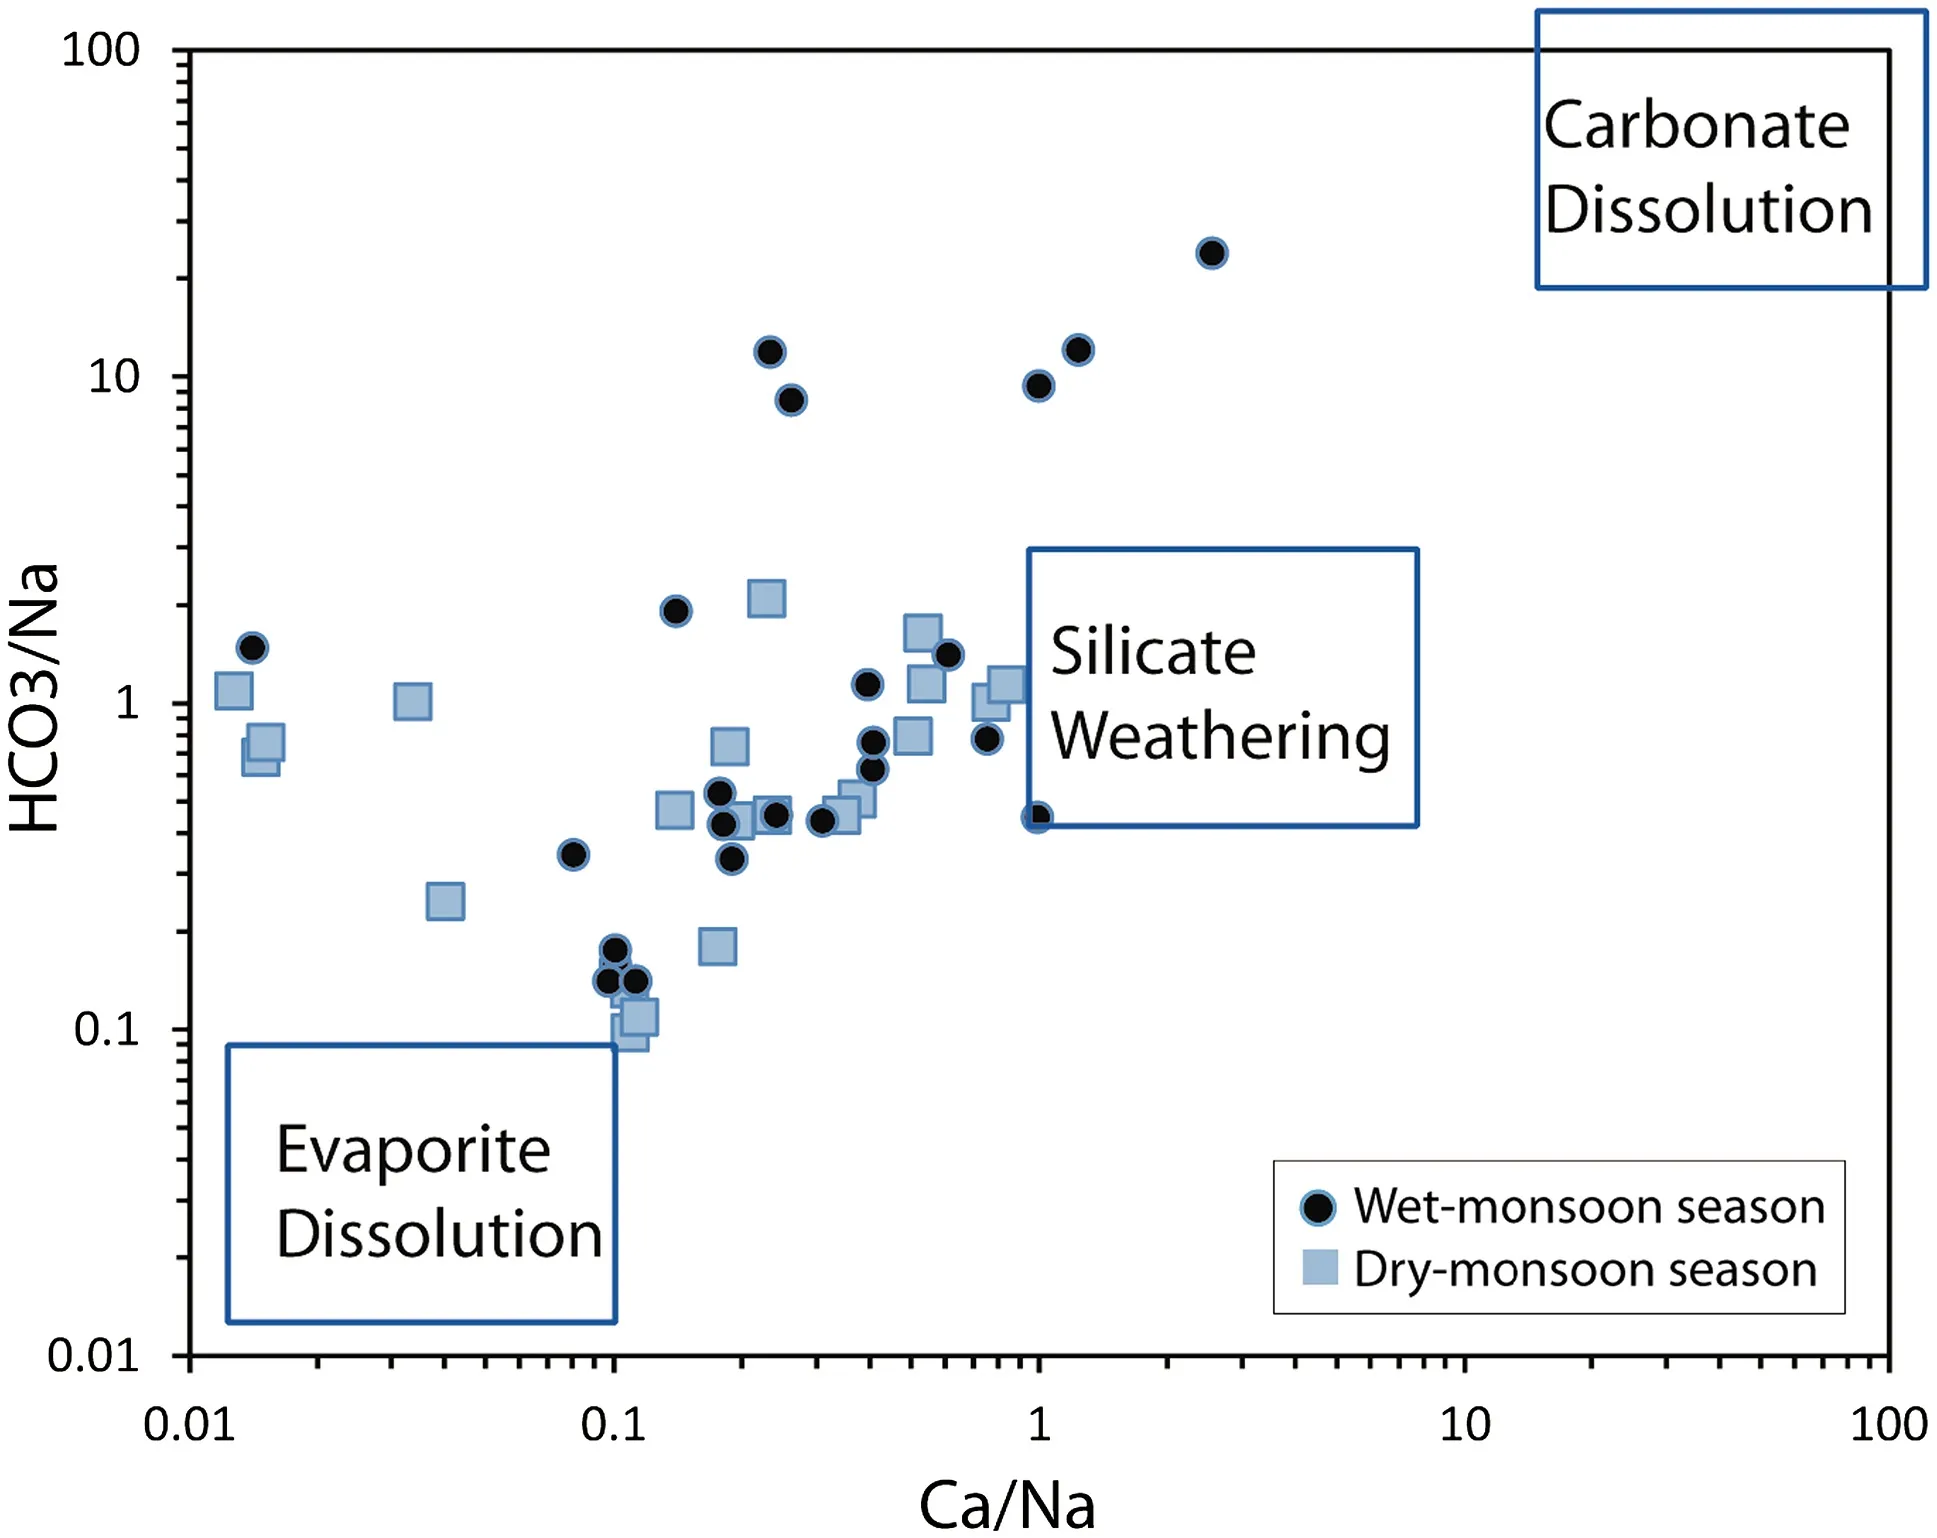
Fig.5 Biplot of/Na+versus Ca2+/Na+for both of the season(wet and dry-monsoon)in the study area
In this study,we applied OK and semivariogram models for spatial distribution of the groundwater parameters.These interpolation techniques have been well-documented in recent literature(e.g.Masoud 2014;Tapoglou et al.2014).Kriging is considered one of the most popular and robust interpolation techniques.It combines spatial correlation with dependence in the prediction process of studied variables.Estimates are represented as weighted averages of the desired parameters of the sampled data.The following equation was used to calculate spatial distribution(Delhomme 1978):

whereis the estimated value of an attribute at the point of interest,x0;zis the observed value at the sampled point,xi;λiis the weight assigned to the sampled point;andnrepresents the number of sampled points used(Webster and Oliver 2001).The attribute is usually called the primary variable,especially in geostatistics.Semivariance was estimated from the water quality data as:

wherenis the number of pairs of sample points separated by standard distance,h,called lag(Burrough and McDonnell 1998).Thez(xi)is the value of the variablezat locationxi.The variogram modeling and estimation are very important for analysis of structure and spatial interpolation of the variables.OK uses the above equations to estimate the prediction of groundwater data and the local constant mean(Goovaerts 1997).OK was used in this study owing to its simplicity and prediction accuracy in comparison to other Kriging methods(Gorai and Kumar 2013).In recent,different semivariogram models,the linear,the exponential,and the spherical have been tested and validated all over the world(Varouchakis and Hristopulos 2013).In this study,the bestfitted theoretical semivariogram model for selected groundwater parameters was constructed through trial and error for all possible parameters.The prediction performances of the fitted model were examined by cross validation tests(Gorai and Kumar 2013).The mean error(ME),mean squared error(MSE),root MSE(RMSE),average standard error(ASR),and root mean square standardized error(RMSSE)were assessed to establish the best fitted model.Models with minimum ME,root mean error(RME),MSE,attained RMSE,and average squarederror(ASE)were considered the best fit models performances(ESRI2009;Markoetal.2014).After completing the cross validation process,kriging maps were produced to clarify the possible distribution of IWQ parameters using ArcGIS(10.2)software.
3 Results and discussion
3.1 Physico-chemical properties of groundwater
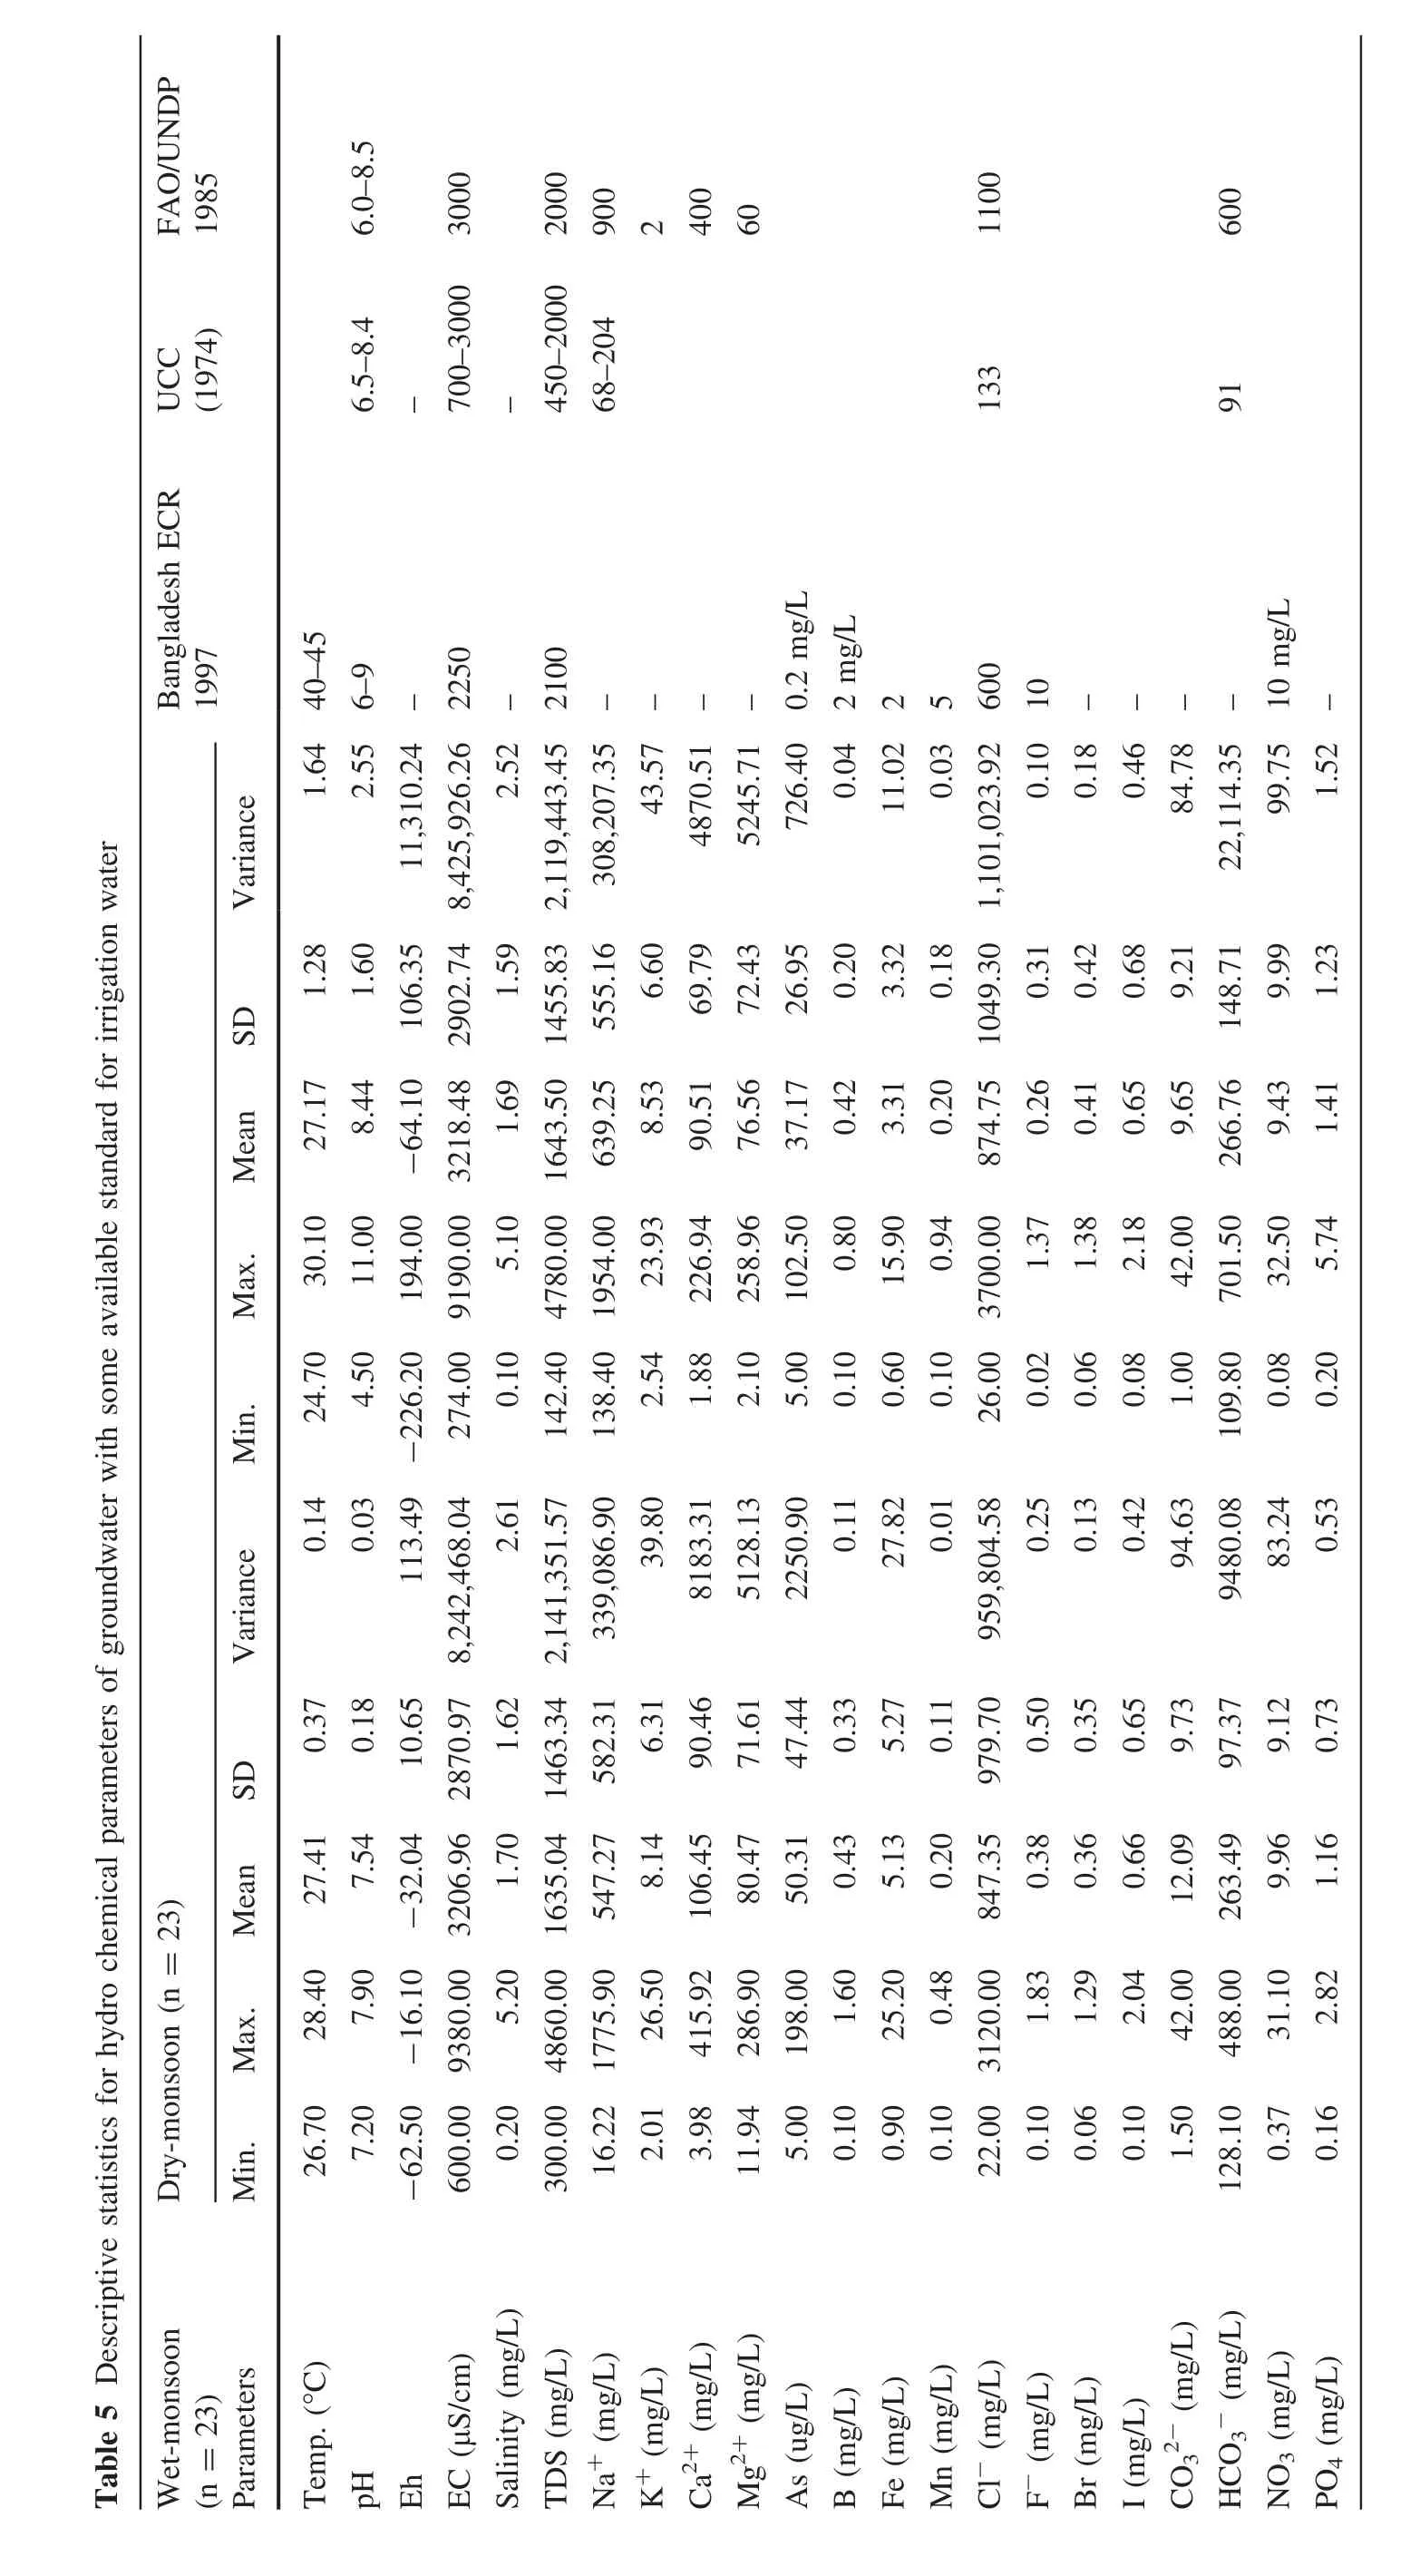
Physico-chemical characterization of groundwater samples was carried out for the wet-and dry-monsoon periods;descriptive statistics of the results are presented in Table 5.A wide range of standard deviations were observed for most parameters,indicating the chemical composition of groundwater is affected by various processes.During the dry-and wet-monsoon seasons,pH ranged from 4.5 to 11.0 and 7.20 to 7.9,respectively,with averages of 8.4 and 7.5.These results suggest that during both seasons,water fall is neutral to slightly alkaline and that the water is overall in the neutral range in both periods.pH variation may be due to an influx of low-alkalinity rainwater or to influence of chemical fertilizers in agricultural fields and leaching of dissolved constituents into the groundwater.Suggested pH for irrigation water is 6.5–8.0(WHO 2007).Considering both sampling periods,most sampling points exhibited pH within the recommended range.However,ten sampling points out of 23 in the dry-monsoon period exceeded the range.EC has previously been used to classify drinking and irrigation water(Erguvanli and Yuzer 1987).EC during dry-and wet-monsoon seasons ranged from 274 to 9190 and 600 to 9380 μs/cm,respectively,with corresponding averages of 3218.4 and 3206.9 μs/cm.According to WHO(2007)guidelines,the permissible limit of EC is 750 μs/cm for drinking water.Of 46 samples,only eight met the limit for EC.EC varied with the changing weather in the semiarid climate,nutrient constituents,and evaporation rate.TDS varied from 142.4 to 4780 and 300 to 4860 mg/L in dry-and wet-monsoon periods,respectively,with corresponding mean values of 1643.5 and 1635 mg/L.Based on TDS,50%of the wells were brackish(TDS>1000)and 50%freshwater(TDS<1000)(Freeze and Cherry 1979).Na+,Mg2+,Ca2+,Cl-,,andaccounted for more than 98%of total cations and anions in groundwater during the wet season.Concentrations of Na+,Mg2+,Ca2+,and K+averaged 68.9%,18.4%,11.7%0,and 0.94%,respectively,over both seasons.Cl-,,andcontributed on average 75%,23%,and 5.5%,respectively,of total anions during both periods.Groundwater of the study area was dominated by Na+,Ca2+,Mg2+,Cl-,andin both seasons(Fig.2);these five accounted for 98%of total cations and anions.High presence of Na+,Mg2+,Ca2+,and Cl-may be due to sea water intrusion,which is accelerated by excessive groundwater withdrawal,low river flow volumes,and weathering of rocks.andconcentrations also varied widely,but the anioncontribution(%)showed that the former dominated in the study area.This might be due to the weathering of carbonate and dissolution of carbonic acid(Kumar et al.2007).
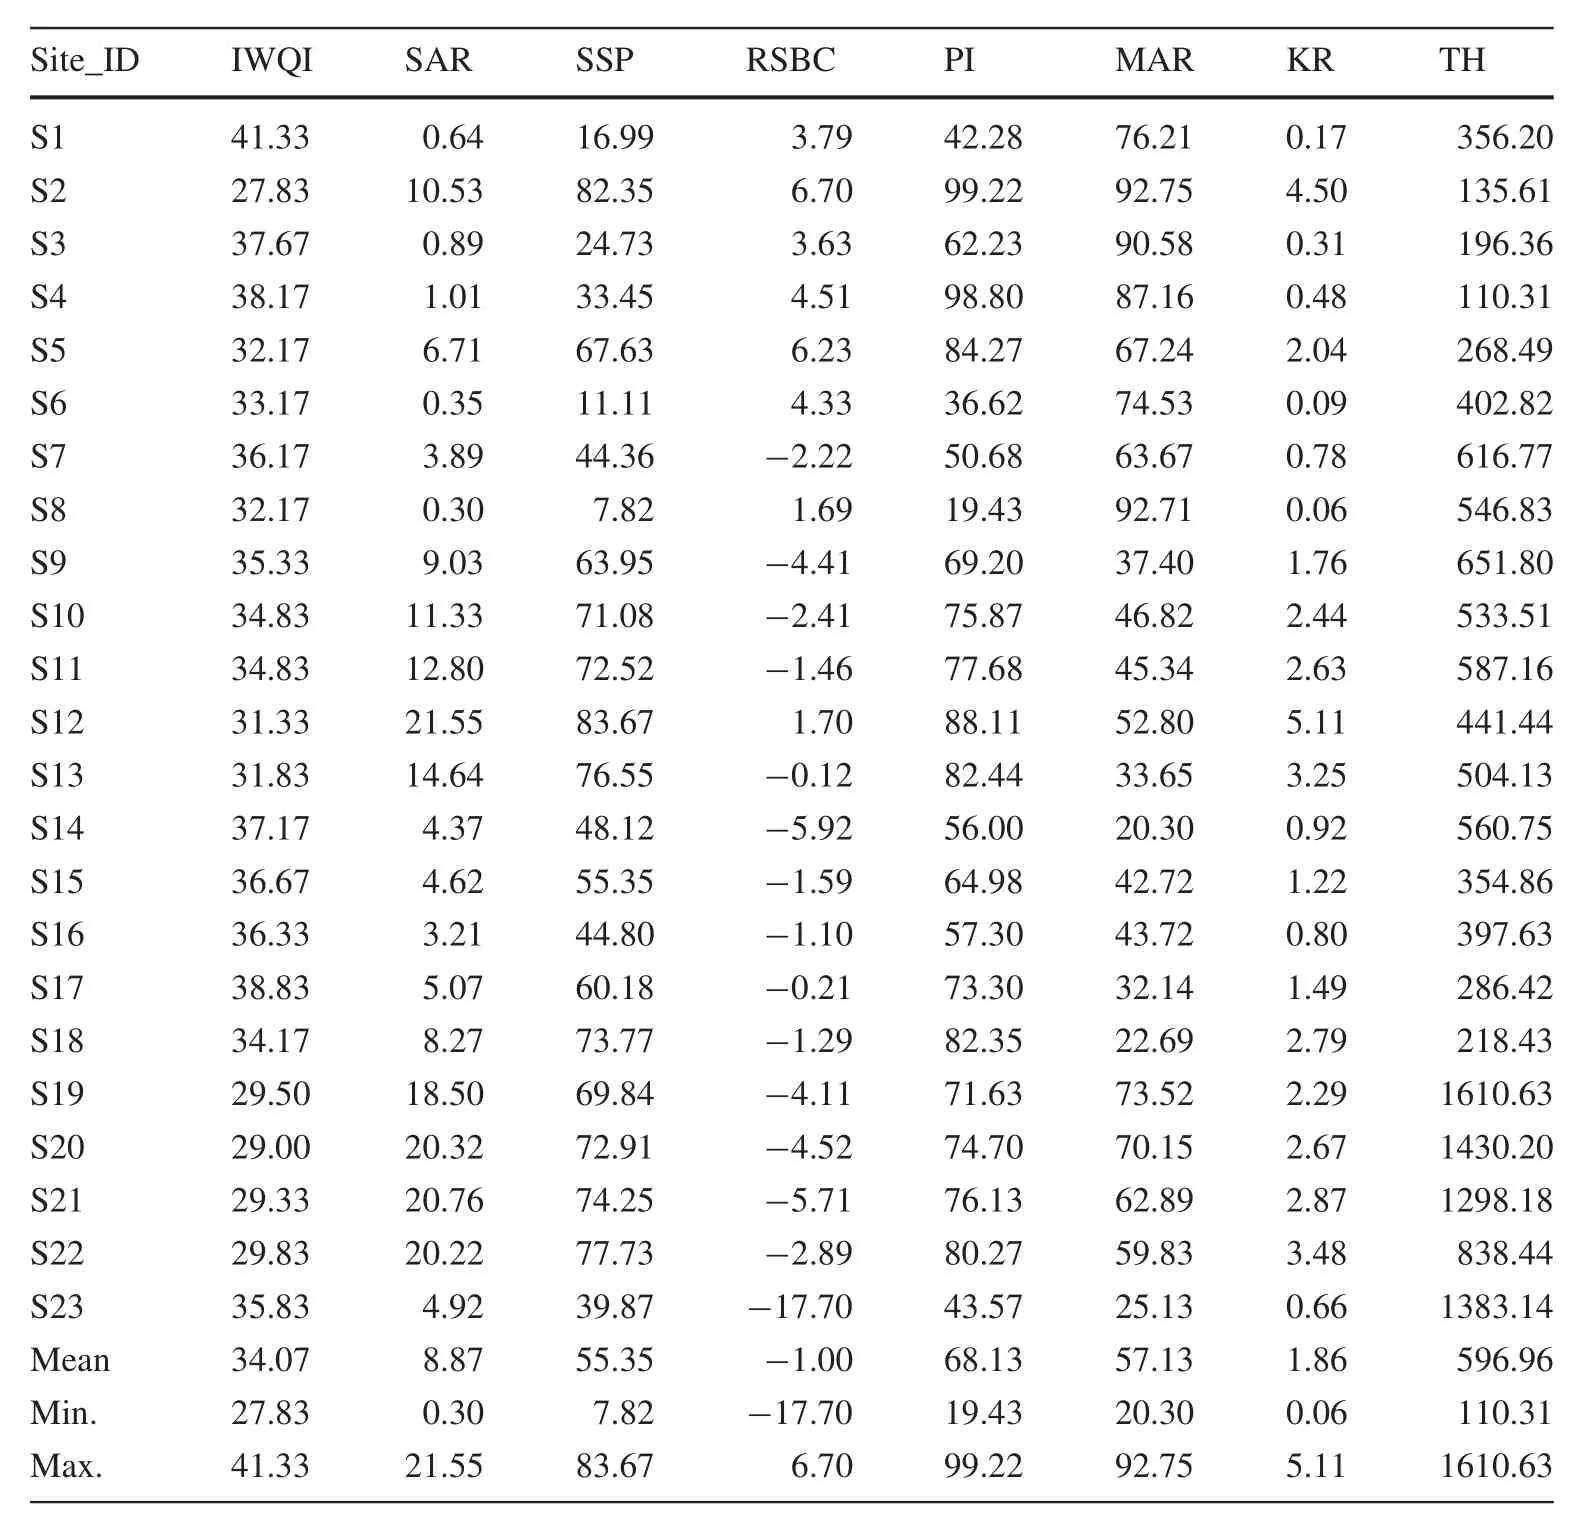
Table 7 Irrigation water quality evaluation indices for the groundwater of the study area in wet-monsoon period
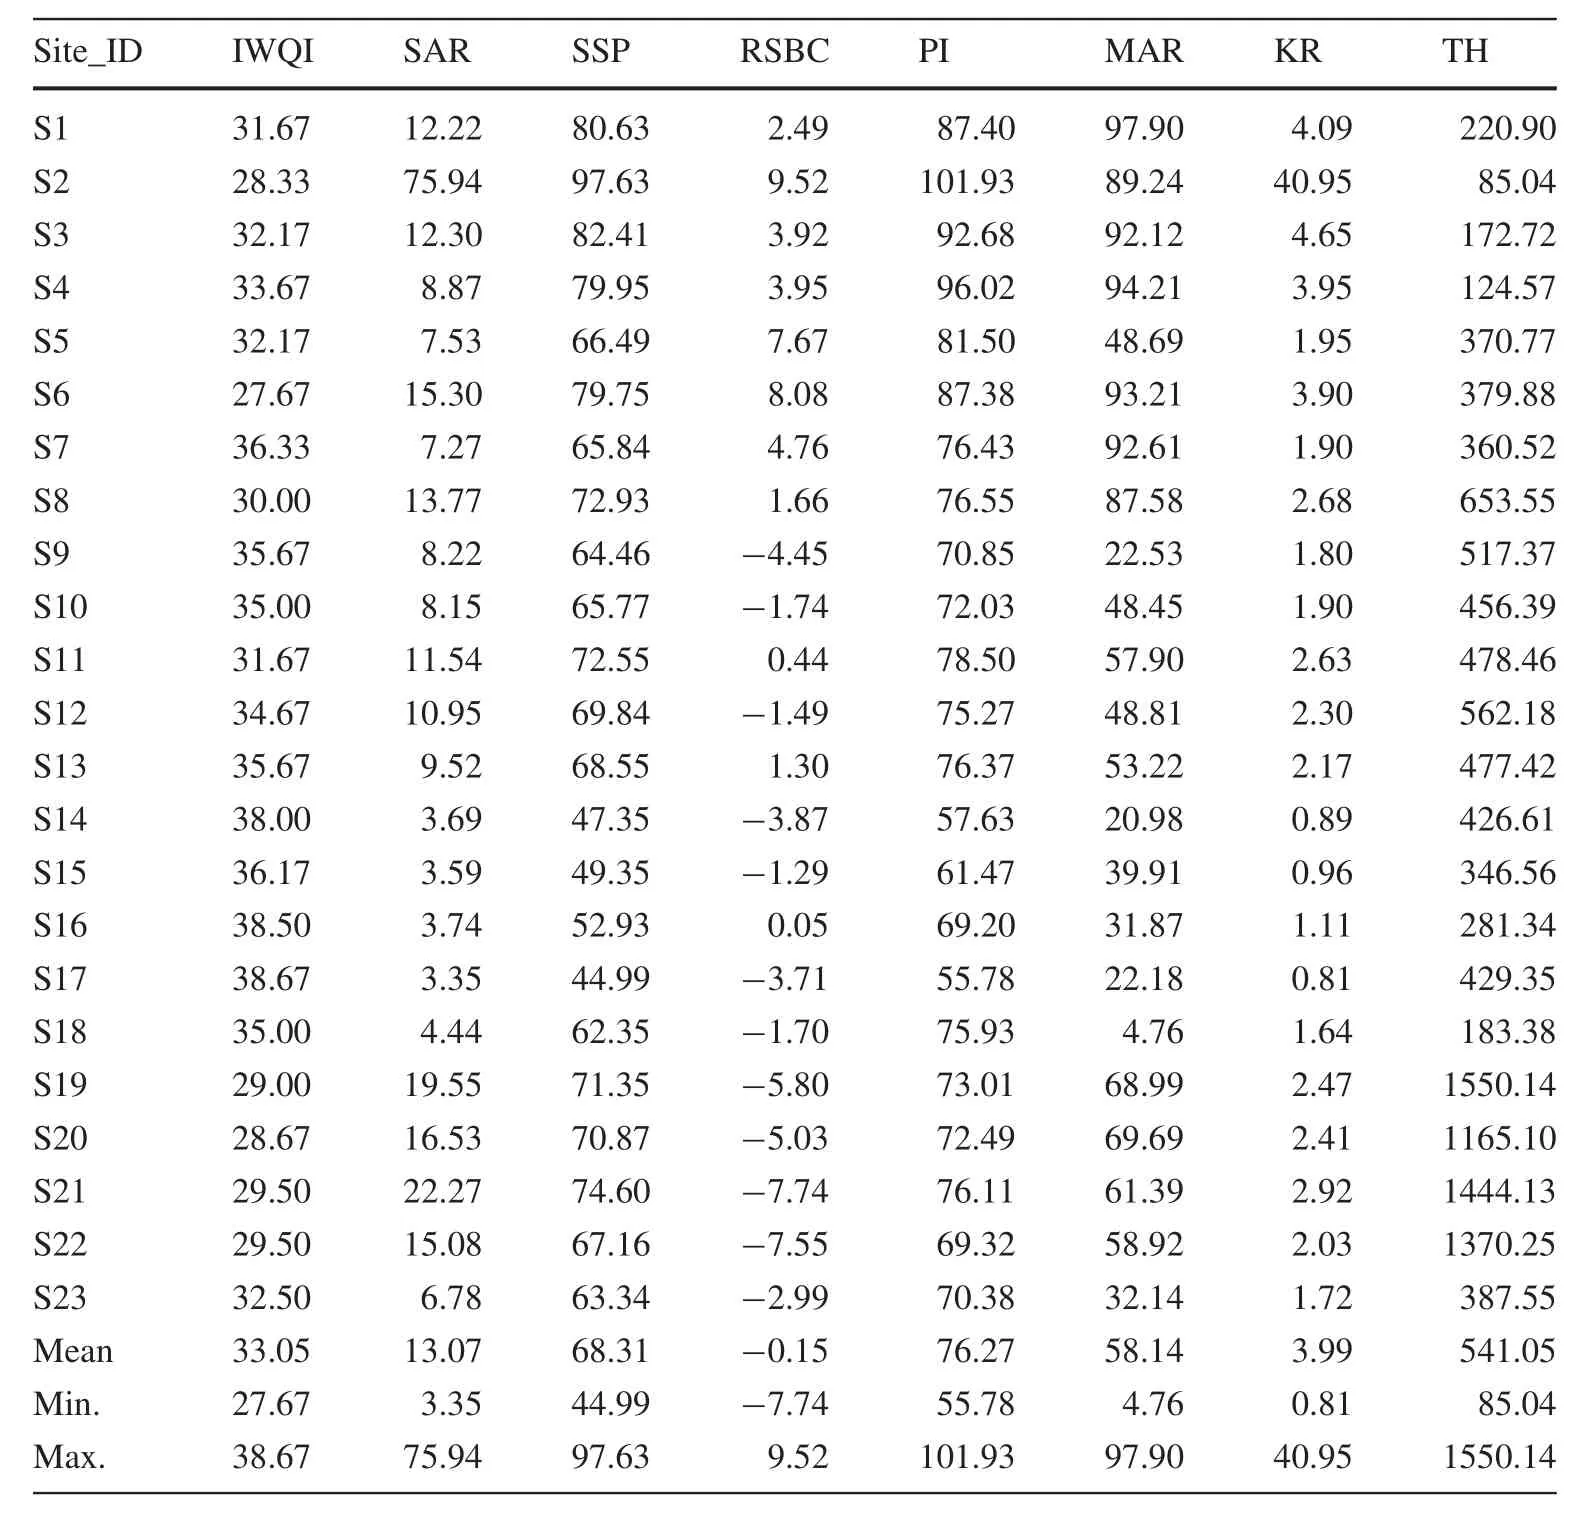
Table 8 Irrigation water quality evaluation indices for the groundwater of Gopalganj district,Bangladesh in drymonsoon period
3.2 Principal component analysis
Inter-element correlation was measured among the 20 different hydro chemical variables of pH,Eh,EC,TDS,Na+,K+,Ca2+,Mg2+,As,B,Fe,Mn2+,Cl-,F-,Br,I,for both wet-and drymonsoon seasons(Table 6).Results show total variance of 85.52%and 85.76%in wet-and dry-monsoon seasons,respectively,as determined by six PCs.During the wet season,the variance explanations for PC1,PC2,PC3,PC4,PC5,and PC6 were 33.05%,12.80%,11.28%,10.54%,10.37%,and 7.46%,while variance explanations during the dry season were 34.95%,12.29%,11.12%,10.54%,10.00%,and 6.84%,both respectively.EC,TDS,Na+,K+,Mg2+,Fe,Cl-,andshowed strong association with PC1;B,Mn2+,F-,showed strong association for PC2 in both seasons.Eh strongly loaded with PC3 during the wet monsoon and with PC5 during the dry monsoon.B and Fe showed negative association with PC3 during the wet monsoon,while Br and I loaded strongly with PC4 during both seasons.PC5 and PC3 showed strong loading within pre-and dry-monsoon seasons,respectively.Strong association forwas found in PC5 during the wet-and PC6 during the dry-monsoon season.PC6 strongly loaded with pH only in the wet monsoon.Strong positive loading with K+,Mg2+,Fe,andsuggest rock–groundwater interaction with ion-exchange(Irabar et al.2008)during both seasons.High loading factors for Na+,Mg2+,andcorrespond with events like silicate weathering that could be revealed by increased concentrations of Ca2+and Mg2+(Kumar 2014).corresponds with a weathered carbonate environment and alkaline characteristics of groundwater(Rahman et al.2017).Strong association among EC,Na+,Cl-,TDS,andpoint to sea water intrusion and anthropogenic sources,like chemical fertilizers from agricultural run-off(Kumar 2014;Bodrud-Doza et al.2016;Islam et al.2017).Association of Ca2+,Mn2+,andcould be attributed to geochemical alteration of carbonate minerals(Bodrud-Doza et al.2016).B,As,F-,Br,and I association indicate a geogenic origin of groundwater pollution.Significant loading of pH,Eh,and PO43-could be from agricultural and stagnant water polluted with fertilizers from different non-point sources.
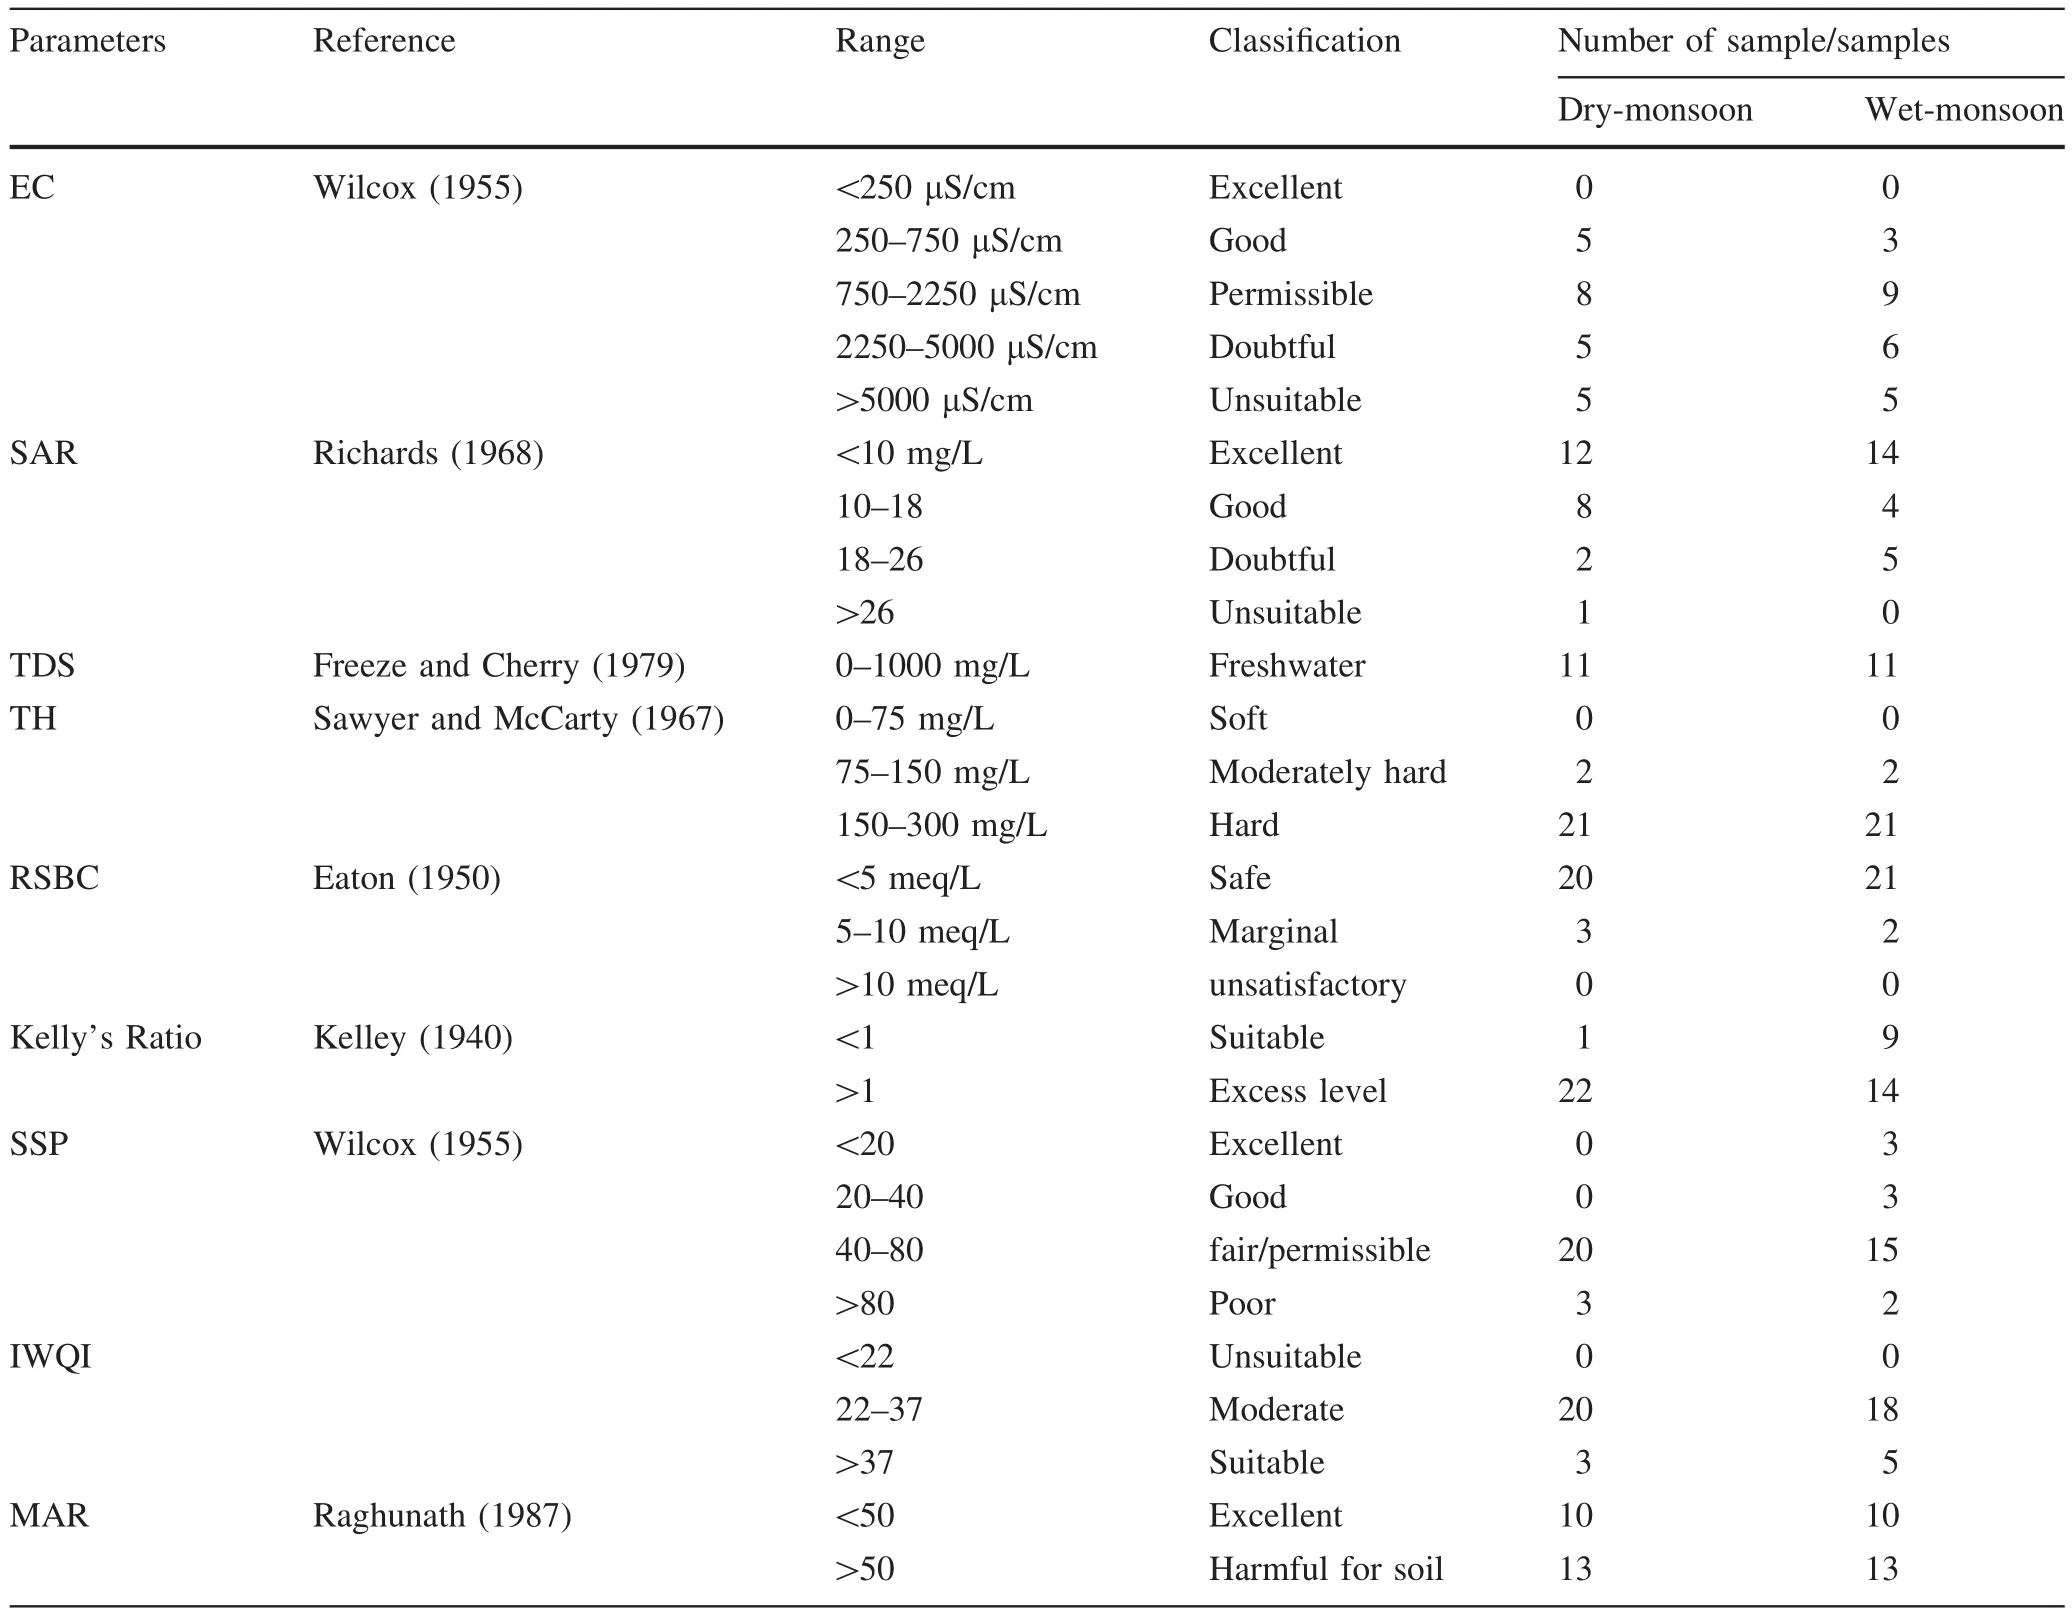
Table 9 Classification of groundwater samples from the study area for suitability in irrigation
3.3 Classification of groundwater
A piper(Piper 1944)diagram of cations Na+,K+,Ca2+,and Mg2+and anions HCO3-,,Cl-,andwas used to determine water types for both seasons(Fig.3).Water sample classification was based on symbolic area in the piper diagram,with most water samples characterized as Na+,K+,Cl-,andtype and some as sodium bicarbonate type,magnesium type,and calcium–magnesium–sulfate–chloride type.These characteristics collectively suggest that water samples in the study area were dominated by salt water during both seasons.This could be attributed to seawater intrusion,paleo-seawater entrapment in the aquifer,or albite dissolution in the groundwater of the study area(Halim et al.2010).
3.4 Geochemical evaluation
A Gibbs plot(Gibbs 1970)was used to classify the hydrogeochemical data of groundwater based on precipitation,rock,and evaporation crystallization dominance(Fig.4).Major interference originated from rock–water interaction and partial interference from evaporation.This finding was consistent with PCA.Other studies have shown rock–water interaction–evaporation influenced by silicate weathering,carbonate dissolution,evaporate dissolution,etc.(Kumar 2014).Weathering processes were verified by bivariate plots of Ca2+/Na+versus/Na+(Fig.5),whichindicated only minor carbonate dissolution during the wet monsoon and a lack of carbonate dissolution during the dry monsoon.Silicate weathering and evaporation dissolution were found to be major processes controlling the solute contents in groundwater for both seasons.In the absence of evaporation dissolution,major factors were assumed to be sea water intrusion or agrochemicals from agricultural runoff.
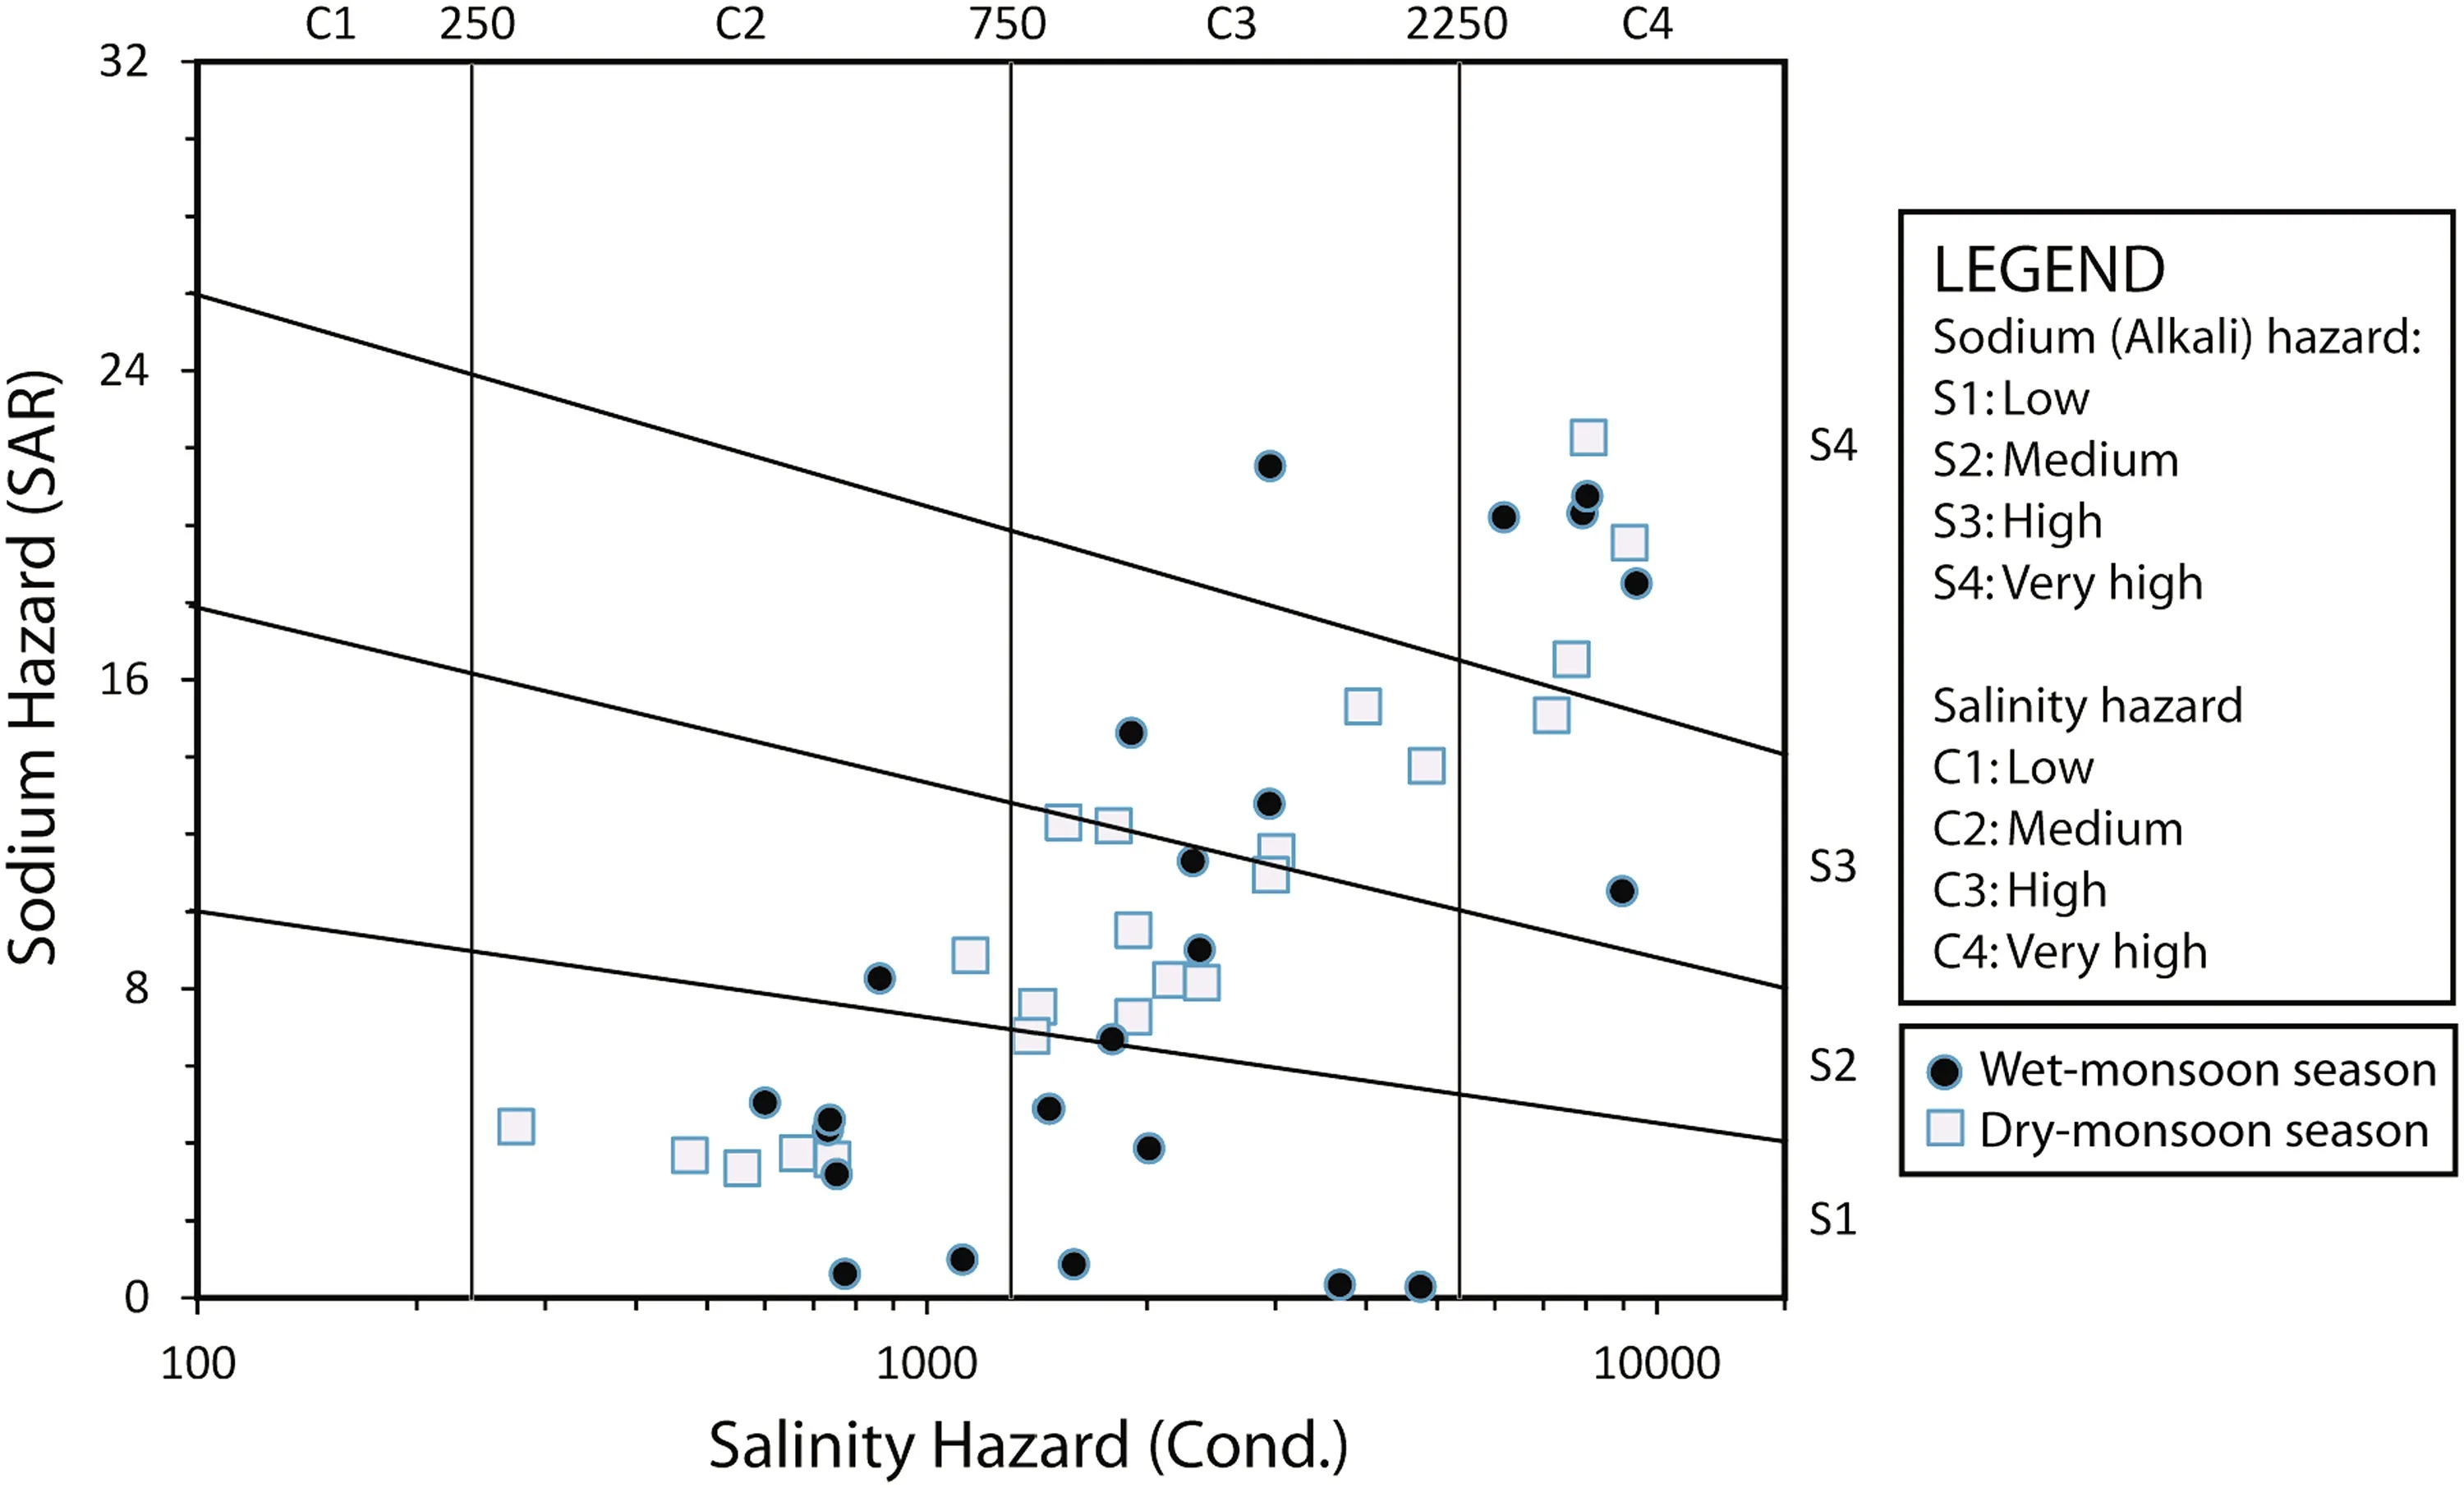
Fig.6 SAR and Salinity hazard diagram showing the suitability for irrigation water in the study area
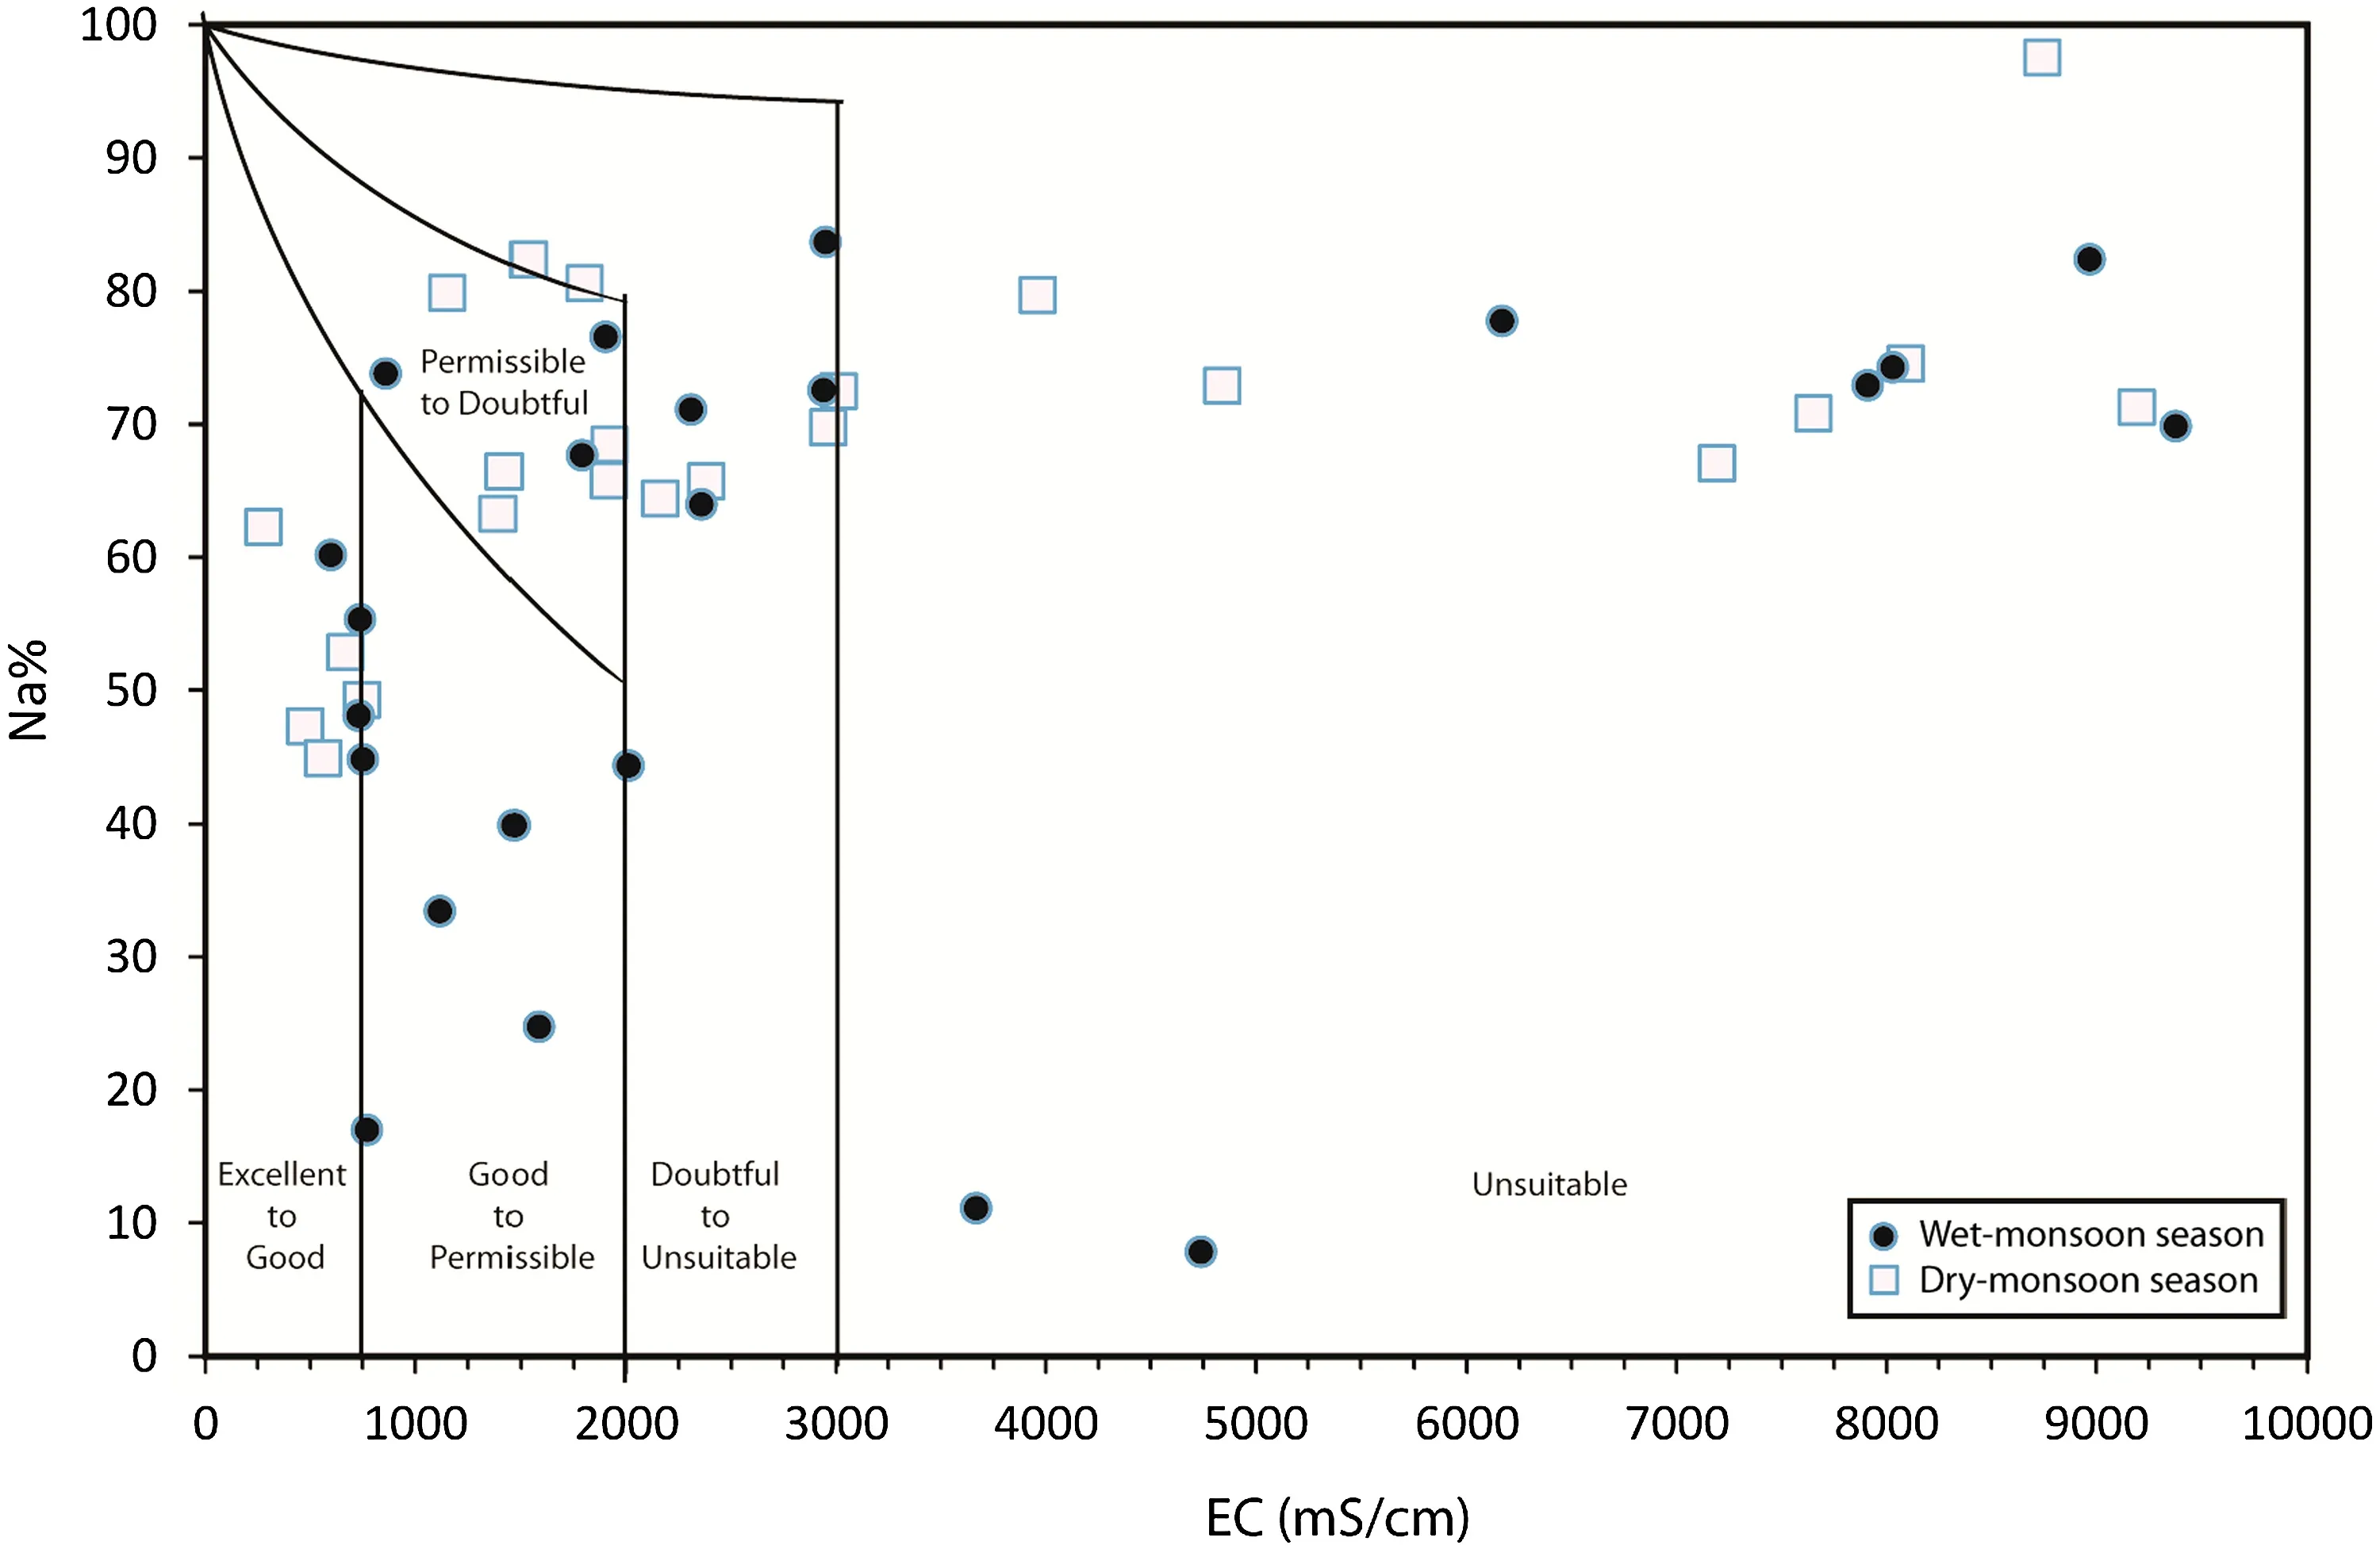
Fig.7 Percent Na%versus EC Wilcox diagrams(Wilcox 1955)for wet and dry monsoon season showing the irrigation water status of the study area
3.5 Irrigation water quality assessment indices
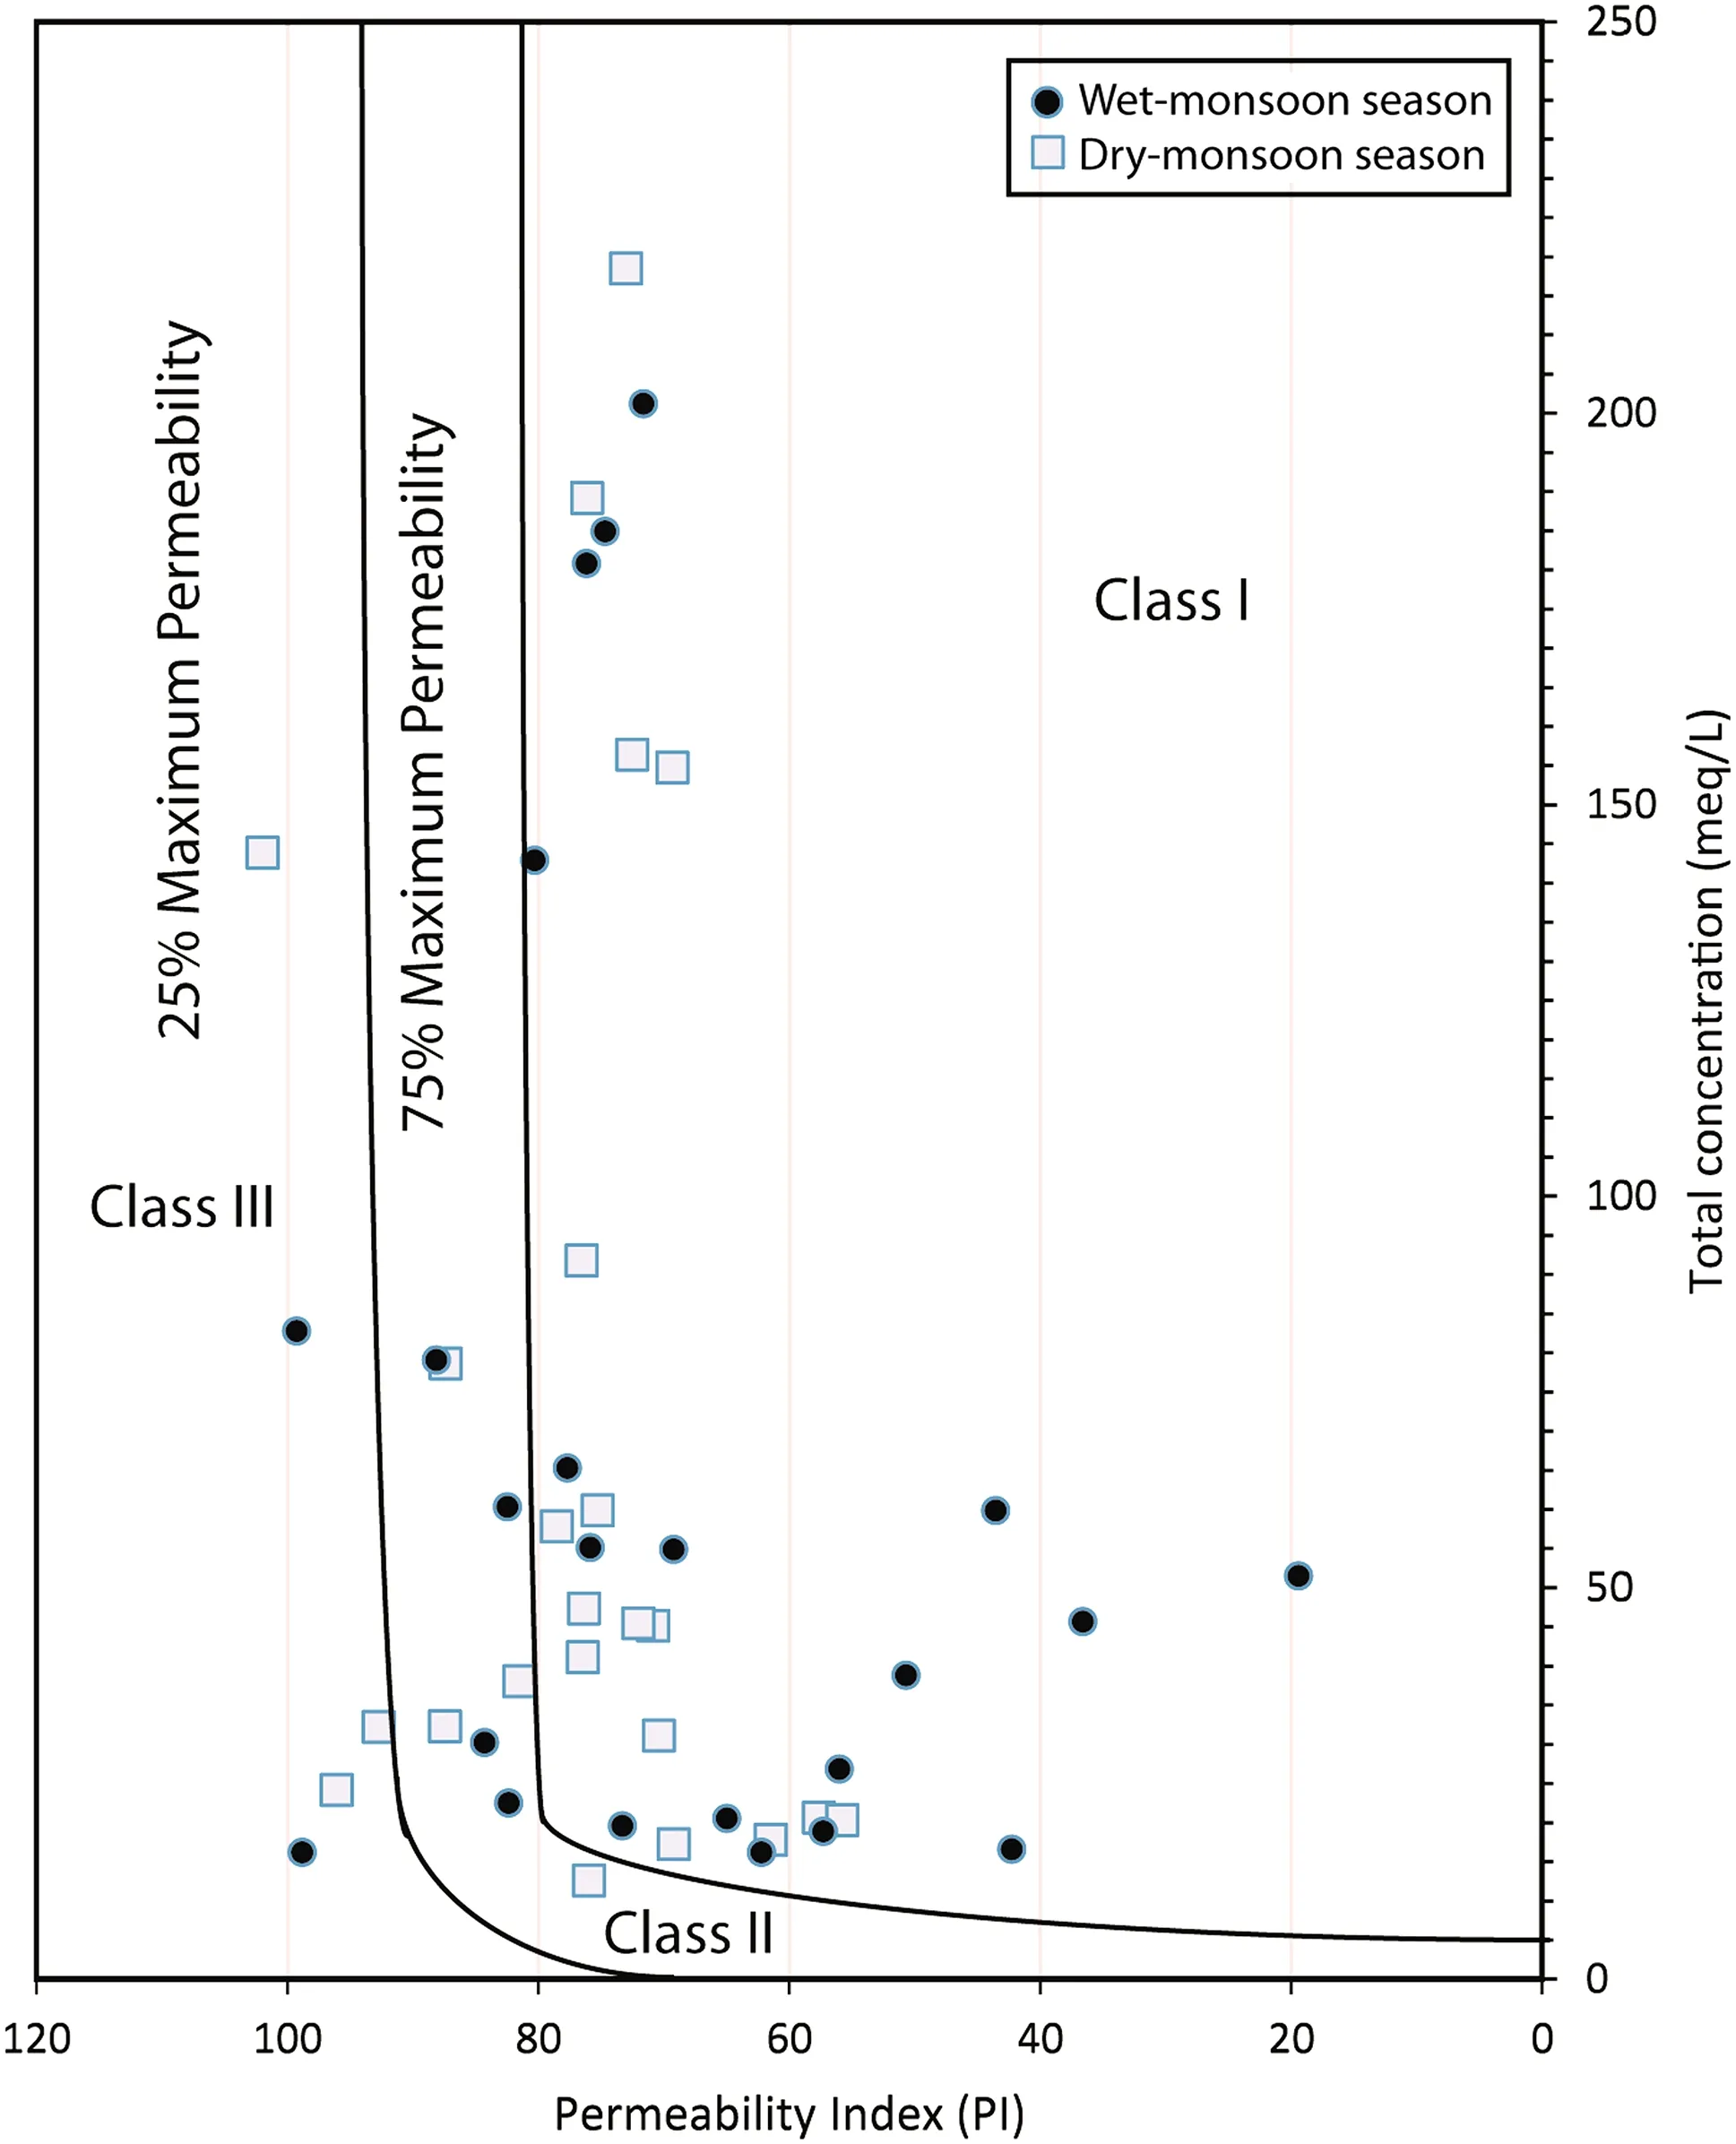
Fig.8 Doneen(1964)irrigation water classification diagram based on permeability index(PI)
Determinants affecting groundwater suitability for irrigation purposes for the wet-and dry-monsoon periods are presented in Tables 7 and 8,respectively.The chemical analyses of groundwater in the study area were evaluated to check suitability for agricultural use and drinking water quality was compared with WHO(1997,2017)specifications.In the case of TDS,the optimum level is 500 mg/L and the maximum permissible limit is 1500 mg/L.In our study TDS ranged from 142.4 to 4780 mg/L in the dry season and 300 to 4860 mg/L in the wet season(Table 6);approximately 50%of water samples were within the limit(0–1000 mg/L)during the sampling periods(Table 9).In terms of TH,samples were classified using the system of Sawyer and McCarty(1967).Permanent and temporary hardness of water are because of the action of soap in water due to the precipitation of Ca2+and Mg2+ions.Permanent hardness is related to Mg2+and Ca2+ions being removed by ion-exchange processes.Temporary hardness is generally Ca2+andin water that is removed upon heating.In some studies,a significant correlation has been observed between hardness and heart disease;on the other hand,a number of epidemiological studies suggest that water hardness defends against disease(WHO 1997).The desired limit for TH is 80–100 mg(Freeze and Cherry 1979).Samples’TH ranged from 85 to 1550.14,with an average of 541.05 mg/L in the dry season and 110.31–1610.63,with an average of 596.96 mg/L in the wet season,classifying them as moderately hard to very hard water(Table 9).Most of the water samples in both seasons were not suitable for domestic use.In addition,EC values exhibited variable salinity levels,with 25 samples out of 46 in the medium salinity range and no samples in the low salinity range(Wilcox 1955).The other 21 samples exhibited doubtful to unsuitable salinity range(Table 9).
Crop yield and soil fertility deteriorate under irrigation water containing considerable chemical constitutes derived from either the natural environment or from anthropogenic activity(Jalali 2009).The success of irrigation projects largely depends on supply and on control of salts and alkalis in the soil(Haritash and Kaushik 2008).The application of irrigation water helps to supply salts to the root zone(Jalali 2011a,b).Parameters such as SAR,SSP,RSBC,and PI are considered as determinants for irrigation water suitability(Raju 2007).Salt water is a good conductor of electricity,thus EC is a measure of electrical conductance in water.We found the degree of salinity in the study area and classified samples based on the US salinity laboratory(Wilcox 1955).According to the classification,no sample in either season was in the excellent range.Five samples in each period were unsuitable;11 samples were doubtful(6 wet-monsoon;5 dry);17 samples were in the permissible range(9 wet;8 dry);and only 8 samples(3 wet;5 dry)were in the medium salinity range(Table 9).
SAR is expressed as sodium content or alkali hazard.Higher salinity reduces the osmotic activity of plants and prevents water from reaching the branches and leaves ofplants—a process that results in inferior production(Deepali et al.2011).Moreover,irrigation water with high Na+and low Ca2+favors ion exchange by saturation of Na+,and destroys the soil structure by scattering clay particles(Todd 1980),resulting in reduced production(Subba 1998).Groundwater suitability based on SAR values is shown in Table 9.During dry-and wet-monsoon seasons,20 and 18 samples,respectively,had excellent to good SAR values;the remainder was within doubtful to unsuitable range.However,a small seasonality effect was observed.An SAR and salinity hazard diagram(Fig.6)was constructed to show a readable sketch according to US salinity scale by Wilcox(1955).Figure 6 confirms most of the samples exhibited medium to very high salinity hazard level(C2–C4)in both seasons.However,17 of the samples were in the low hazard(S1)category and the remaining 29 were medium to very high SAR hazard(S2–S4).Moreover,obvious seasonal effects were observed,with 12 of the 17 samples having low SAR hazard(S1)being from the wet season.This is may be due to less saline water intrusion and higher river flow during the wet period.
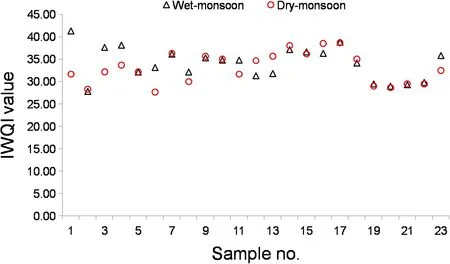
Fig.9 Irrigation water quality index(IWQI)for the groundwater of Gopalganj district,Bangladesh
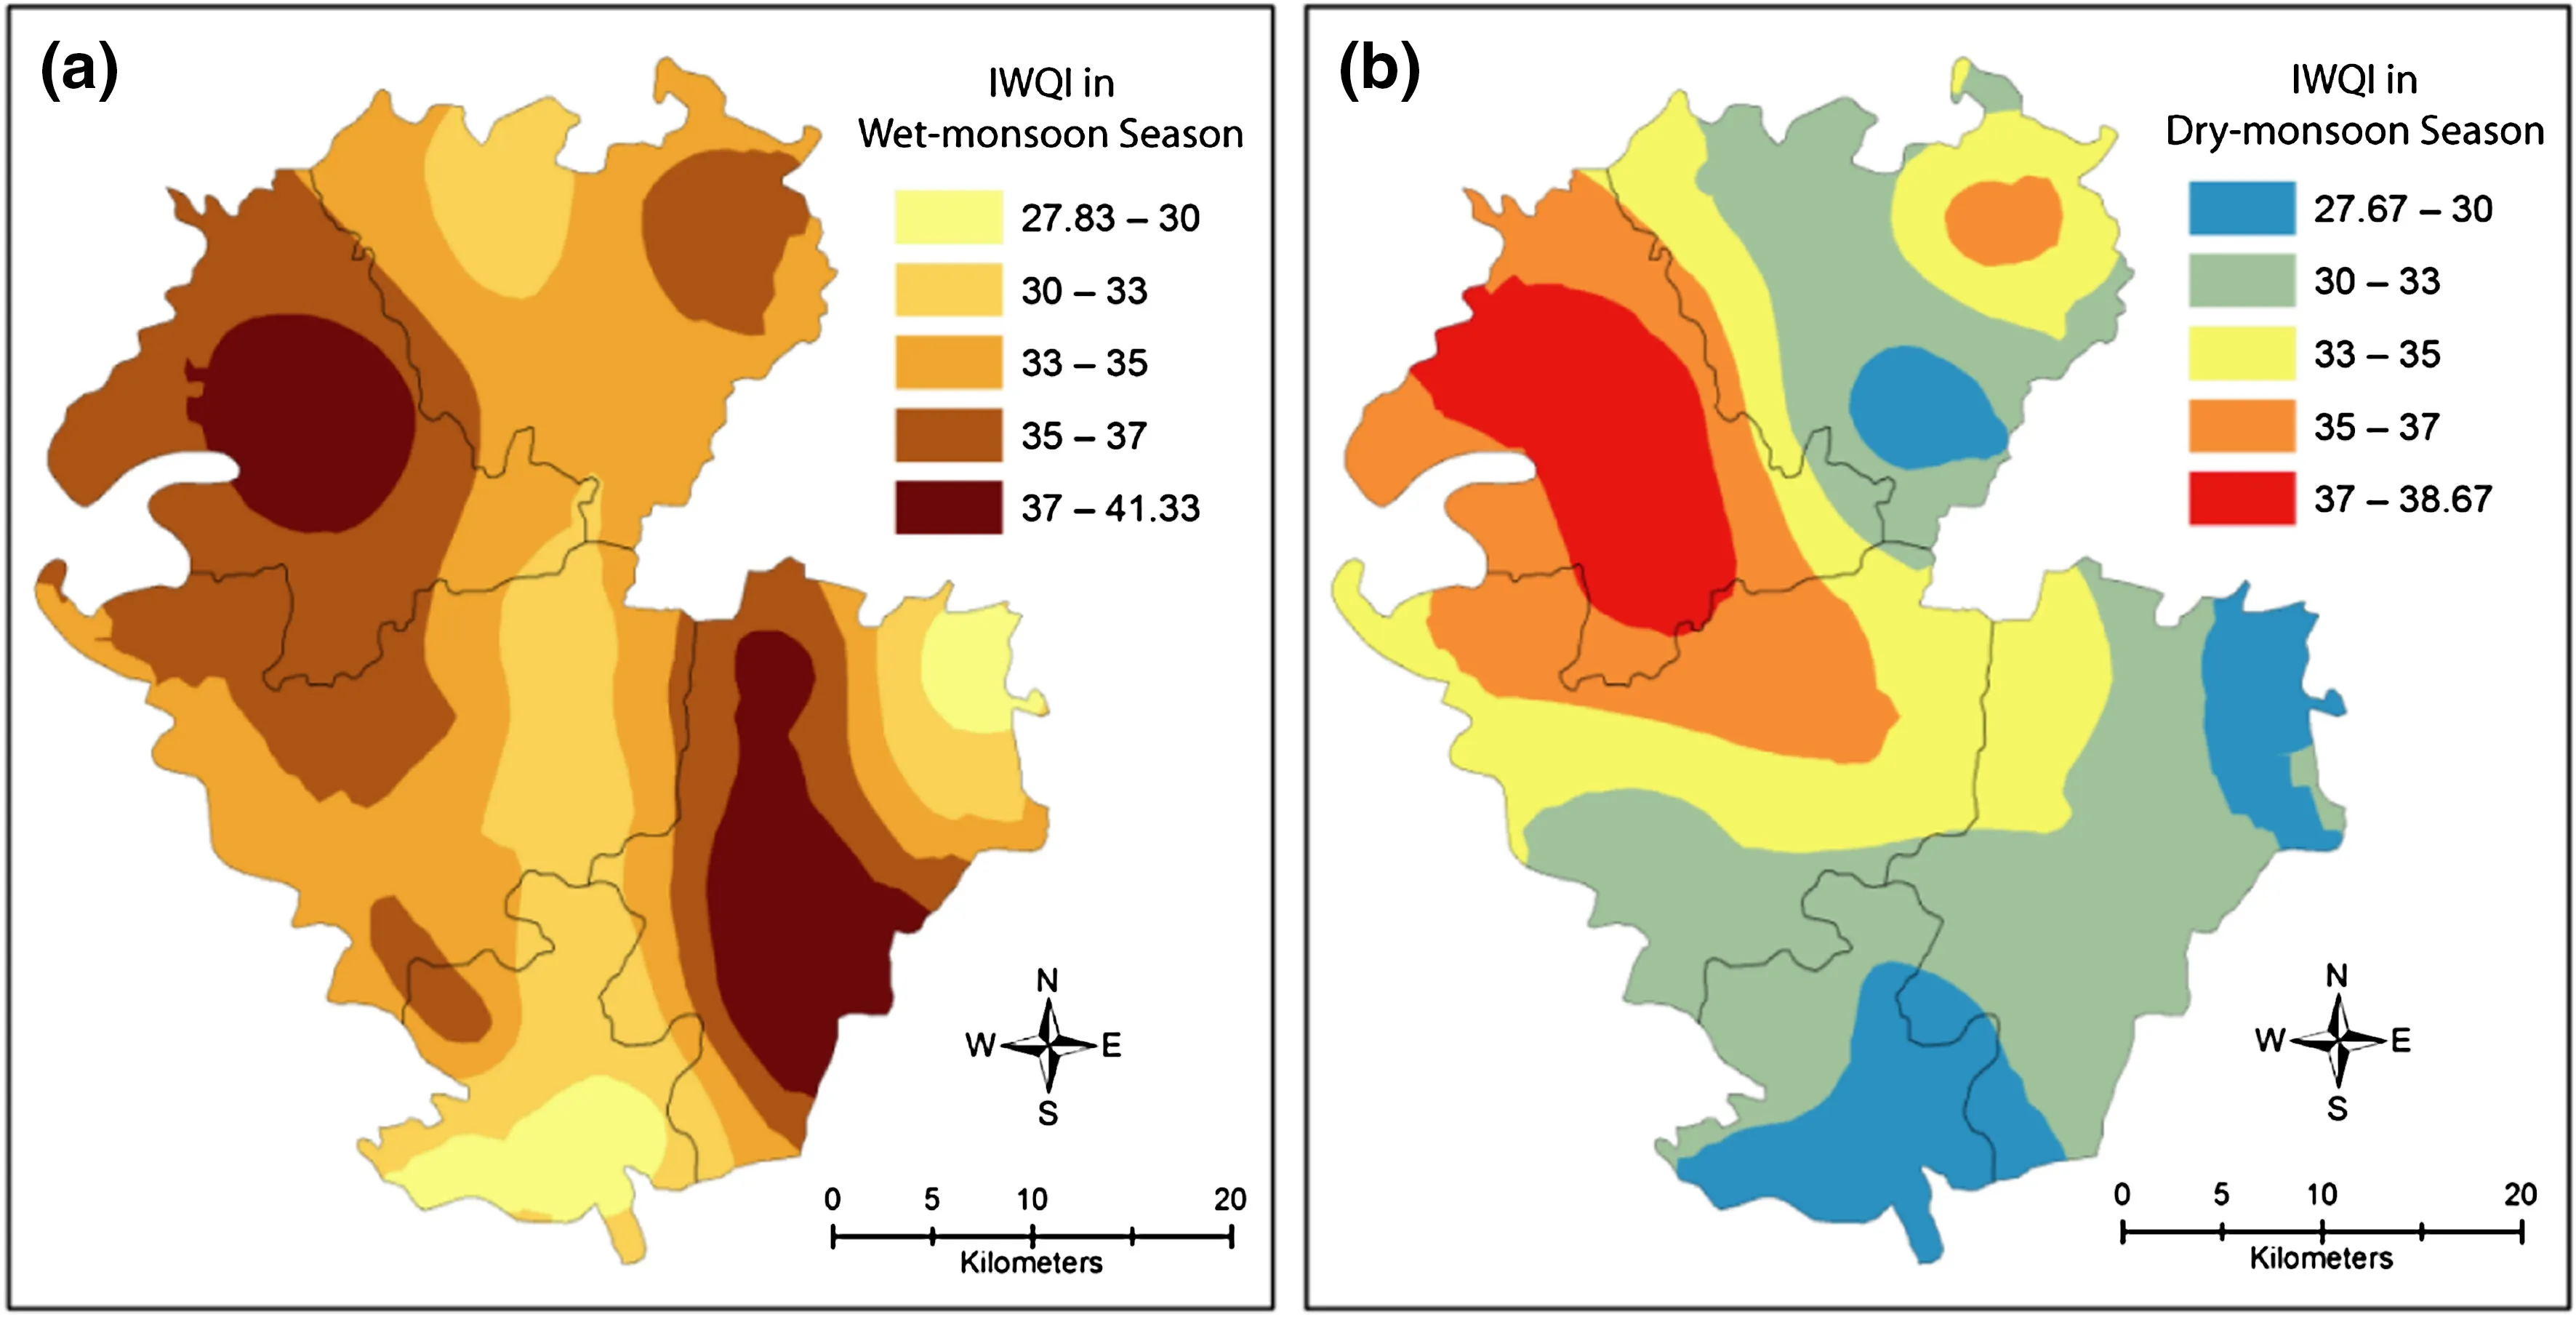
Fig.10 Spatial distribution maps for irrigation water quality index of groundwater in the study area.a IWQI for wet-monsoon;b IWQI for drymonsoon
To clarify the situation,irrigation water was classified by SSP,as soil’s reaction with sodium reduces its permeability.SSP is generally used for assessing the suitability of water for irrigation purposes(Wilcox 1955).The classification of samples is shown in Table 9.In the dry-monsoon period,86%of the samples were in the fair/permissible range;the remaining 14%were in the poor range.On the other hand,the wet-monsoon season yielded 26%of samples in the excellent-to-good range,65%in the fair/permissible range,and just 9%in the poor quality range.These results mirror SAR hazard during the wet-monsoon period(Table 9)and might be explained by the generally higher Na+%observed during dry-monsoon,indicating ion exchange and weathering from lithologic units.For better understanding,Na+%versus EC(Wilcox 1955)was plotted for both periods(Fig.7),with 30%of all samples falling in the excellent to permissible range,39%doubtful to unsuitable,and the remaining 31%completely unsuitable for irrigation.However,the wet-monsoon period had more samples(39%)in the excellent to permissible range than did the dry-monsoon(21%).Interestingly,an equal percentage of samples from both seasons were unsuitable for irrigation. From the Wilcox diagram,it can be said that overall IWQ is better in wet monsoon than dry monsoon.
The ratio of carbonate and bicarbonate to calcium and magnesium affects the suitability of groundwater for irrigation.Excess sodium bicarbonate and carbonate can increase dissolution of organic matter in soil, leaving a black stain on the surface upon drying(Kumar et al.2007,b).Water with RSBC<5,5–10,and>10 meq/L is considered safe,marginal,and unsatisfactory,respectively(Gupta 1983).RSBC was calculated in this study by Eq.4 and results are given in Tables 7and8for both sampling periods.In the dry-monsoon season,RSBC values ranged from-7.74 to 9.52 whereas in the wet-monsoon season,values ranged from-17.7 to 6.7.Most of the samples during the entire sampling period were categorized as safe,with a few samples in the ‘marginally safe’category(Table 9).
Sodium,magnesium,calcium,and bicarbonate contents influence soil permeability,which in turn influences IWQ.Doneen (1964)developed acriterion to assess the suitability of water for irrigation based on PI as calculated by Eq.5.Accordingly,water is classified as Class I,Class II,or Class III.Class I and II waters are categorized as good for irrigation with 75%or more maximum PI,and Class III water as unsuitable with 25%of maximum permeability.Maximum PI values in the present study fell between Class II and I,resulting in a classification of suitable for irrigation;no significant seasonal effect was observed(Fig.8).PI ranged from 55.78 to 101.93(average 76.27)in the dry-monsoon season and from 19.43 to 99.22(average 68.13)in the wet-monsoon(Tables 7 and 8).
KR is one of the most important parameters for IWQ assessment.KR>1 reflects excess sodium and KR<1 signifies sodium deficit(Kelley 1940).KR was calculated using Eq.7.Waters with KR<1 are fit for irrigation while those with a greater ratio are considered unsuitable(Sundaray et al.2009).From Table 8,KR during the dry monsoon varied from 0.81 to 40.95,with a mean value of 3.99%,and 95%of samples showing excess sodium.On the other hand,KR in the wet monsoon ranged from 0.06 to 5.11,with an average of 1.86(Table 7),and only 60%of samples exhibiting an excess level of sodium(Table 9).These KR values indicate a higher percentage of Na+can be derived from weathering of feldspars from the lithologic units of the study area(Vasanthavigar et al.2012).By KR,water quality is more suitable for irrigation during the drymonsoon period than the wet-monsoon.
MAR is also considered a concomitant factor to the evaluation of irrigation water suitability as it can deteriorate the soil quality when its value in the water system exceeds 50.During the dry monsoon,MAR varied between 4.76 and 97.90,with a mean value of 58.14(Table 8);in the wet monsoon,values ranged from 20.30 to 92.75,with an average of 57.13(Table 7).About 56.5%of samples from each season returned MAR>50,indicating potential threats to soil quality(Table 9).No significant seasonal difference was observed in the value of MAR.Considering all samples,the groundwater quality of the studied area is considered potentially threatening for irrigation based on MAR.
3.6 Irrigation water quality index for studied groundwater
To establish a quick view for the overall irrigational groundwater quality of the Gopalganj district,an IWQI was developed for the first time in this study(Fig.9).Calculated IWQI values ranged from 27.67 to 38.67(mean 33.05)during the dry monsoon(Table 8)and 27.83 to 41.33(mean 34.07)during the wet monsoon(Table 7).According to the suitability scale,82.6%of the studied samples were moderately suitable and the rest were considered suitable(Table 9)(Fig.10).
3.7 Geostatistical modeling of irrigation water quality parameters
Semivariograms computed following theOK model showed the spatial distribution ofIWQ parameters throughout the study area during both dry-monsoon and wet-monsoon periods.The best- fit semivariogram model parameters are given in Table 10.The experimental semivariogram(scatter points)around the omnidirectional semivariogram model(blue line)and average of semivariogram runs(plus signs)are shown in Figs.11a,b and 13a–h.The range is the distance at which the model first flattens and it varies across IWQ parameters.The value at which the model attains the range is called the sill and the value at which the model intersects the y-axis is the nugget.The value of the range was from 0.122 to 0.383 km.The variation of range may be due to topographic factors along with possible variation in soil structure and texture.However,the large variation in range may be indicative of small-scale change in factors affecting water quality,suchas point sources of pollution,fertilizer application,and recharge water quality.The nugget to sill ratio is used to depict the spatial dependence of groundwater quality parameters(Nayanaka et al.2010).Three classifications are usually used:strong spatial dependence when the ratio is less than 25%,moderate spatial dependence when the ratio is between 25 and 75%,and weak spatial dependence when the ratio is more than 75%.Most of the IWQ parameters in this study showed strong spatial dependence for both periods except EC(dry monsoon)and SSP(wet monsoon)showed weak spatial dependence,and SAR(wet monsoon)and TH(dry monsoon)showed moderate spatial dependence(Table 10).The weak spatial dependence was exhibited by a large nugget effect in the semivariogram(Fig.13b,e,h).We concluded that the weak to moderate spatial dependence may be due to localized effects of anthropogenic activity and land use patterns,and the strong spatial dependence may be due to low- flow conditions in major rivers,seawater intrusion,prevailing aquifer geology,and long-term geogenic processes such as groundwater source rock,rainfall,in filtration processes,etc.

Table 10 Most suitable model characteristics of indices of best fitted semivariogram models for groundwater and their changes
3.8 Spatial distribution maps for irrigation water quality parameters
IWQI spatial distribution maps for south-central Bangladesh for wet-and dry-monsoon periods are shown in Fig.10a,b,respectively.These maps were drawn from computed IWQI values to show the distribution of suitable irrigation water and the seasonal changes in this distribution.During the wet monsoon,about 87%of the area groundwater was classified as having moderately suitable water for irrigation and 13%as suitable;highindexed(suitable)water was distributed mostly in the southeastern and northwestern parts of the Gopalganj district.Similar results were observed in the dry-monsoon season,but the distribution of moderately suitable water shifted from southeastern to southwestern and western parts of the study area.This shift might be influenced by river systems in and around the study area,especially the Padma River,and also by changes in agricultural practices.The IWQ evaluation indices were also mapped(Fig.12a–h).
The spatial distribution of EC for wet-monsoon and drymonsoon periods are shown in Fig.12a and b,respectively.In the wet-monsoon season,high EC was observed only in the south,perhaps due to proximity with the coastal district and salinity intrusion during low- flow.On the other hand,in the dry monsoon,the extent of the high-salinity area was reduced overall,and absent in the eastern part of the district(Fig.12b).The distribution of EC(3000–7000 μs/cm)flattened over the southern zone of Gopalganj.This may be related to the normal flow of freshwater along with low obstruction of groundwater(Fig.13).
SAR also showed seasonal variation(Fig.12c,d).More than 50%of the area exhibited excellent irrigation water in terms of SAR value for both periods;around 26%area showed good water quality for irrigation,and 15%had a doubtful water quality for agricultural use.There is a clear pattern in the distribution of SAR values.In the wetmonsoon period,unsuitable to doubtful water was found in the southern portion of the study area,but post-monsoon this quality was mostly documented in the southeastern part.
Spatial distribution maps of SSP for both the wet-and dry-monsoon samples are given in Fig.9e,f.During the wet-monsoon period,about 26%of the area exhibited excellent to good water for irrigation,65%fair/permissible,and 8.6%poor(Fig.12e).During this period,the SSP value improved from southwest to southeast and north/northwest.During the dry-monsoon period,SSP showed a clear difference,with 86%of the area fair/permissible and 14%poor.SSP values decreased from southeast to northwest in the study area(Fig.12f).These maps present indications that the process is governed by major river flow with underlying geological factors.Furthermore,the spatial distribution of TH is given in wet-monsoon(Fig.12g)and dry-monsoon(Fig.12h).The total area was mostly categorized as moderate to hard water type,with very similar distribution year-round—higher in the southwest and lower in the north/northeast.TH may be governed by the source rock and dissolution processes rather than by river flow oranthropogenic activity.Overall,high values of SAR in the southern part of the study area are significant because irrigation water will cause permeability problems through shrinking and swelling of clay soil(Saleh et al.1999).Increased Na+ion associated with higher SAR values in the water can lead to the development of an alkaline soil(Todd 1980).The spatial distribution maps of different IWQ parameters for both seasons indicate a deteriorating trend towards the southern zones of the study area,with potential degradation of IWQ across the study area due to low river flow along with improper withdrawal of groundwater.
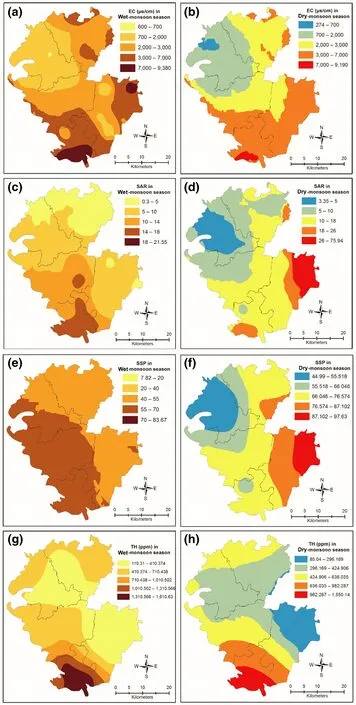
Fig.12 Spatial distribution maps of irrigation water quality evaluation indices in the study area;a EC in wet-monsoon;b EC in dry-monsoon;c SAR in wet-monsoon;d SAR in dry monsoon;e SSP in wetmonsoon;f SSP in drymonsoon;g TH in wetmonsoon;h TH in dry-monsoon
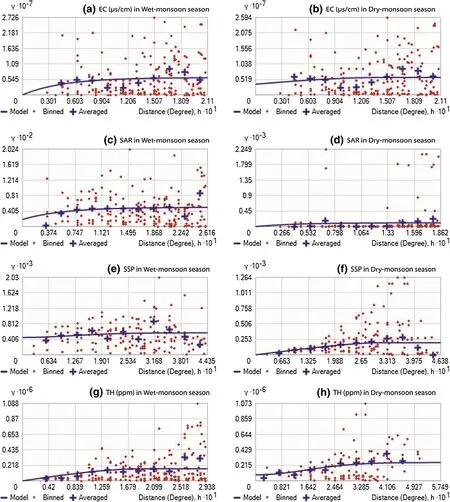
Fig.13 Best fitted semivariogram models for irrigation water quality evaluation indices of the groundwater in the study area;a EC in wetmonsoon;b EC in dry-monsoon;c SAR in wet-monsoon;d SAR in dry monsoon;e SSP in wet-monsoon;f SSP in dry-monsoon;g TH in wetmonsoon;h TH in dry-monsoon
4 Conclusions
Groundwater IWQ was assessed through hydrochemical and geostatistical analyses and spatial distribution maps in the Gopalganj district,south-central Bangladesh.Hydrochemical analysis showed generally neutral to alkaline groundwater in the study area.Most groundwater samples had TDS>1000 mg/L and more than 40%had EC>2250 μs/cm,which clearly indicates saline water intrusion in the study area.The irrigation water evaluation indices(EC,SAR,TDS,TH,RSBC,KR,SSP,and MAR)returned variable results,but most indicated moderate to poor IWQ of the study area for both wet-and dry-monsoon periods.The spatial distribution maps also show variation,but overall the IWQ is poor in the southwestern,southern,and southeastern parts of the district.Calculated IWQI mostly fell in the moderate range(82.6%)and the map of IWQI indicates moderate to suitable water in the southeast to northwest.Geostatistical modeling showed strong spatial dependence(IWQI,EC wet-monsoon;SAR dry-monsoon;SSP dry-monsoon;and TH wet-monsoon);weak spatial dependence(EC dry-monsoon,SSP wet-monsoon);and moderate spatial dependence(SAR wet-monsoon,TH drymonsoon).In conclusion,groundwater of the study area is moderately suitable for irrigation;very high EC and SSP values indicate salinity and sodium hazards in more than 50%of the study area;strong to weak spatial dependence of IWQ parameters indicates large-scale natural and small scale anthropogenic effects;and patterns of distribution vary by IWQ parameter.This study should be taken into consideration when developing and implementing strategies for the suitable management of groundwater for irrigation purposes in regions similar to Bangladesh.
AcknowledgementsThis work was supported by the project entitled‘Establishment of monitoring network and mathematical model study to assess salinity intrusion in groundwater in the coastal area of Bangladesh due to climate change’implemented by Bangladesh Water Development Board and sponsored by Bangladesh Climate Change Trust Fund,Ministry of Environment and Forest.The authors would like to thank BCSIR and BUET laboratory officials for their cordial support.
Compliance with ethical standards
Conflict of interestThis is an original manuscript that has not been submitted elsewhere for publication.All authors have read the manuscript and agreed that the work is ready for submission to the journal with no conflict of interest.Md.Mostafizur Rahman will receive correspondence.
Agca N,Karanlık S,Odemis B(2014)Assessment of ammonium,nitrate,phosphate,and heavy metal pollution in groundwater from Amik Plain,southern Turkey.Environ Monit Assess 186:5921–5934
APHA(2005)Standard methods for the examination of water and wastewater,20th edn.APHA,AWWA and WEF,Washington
Ashraf M,Afzal M,Ahmad R,Ali S(2011)Growth and yield components of wheat genotypes as influenced by potassium and farm yard manure on a saline sodic soil.Soil Environ 30:115–121
Ayers RS,Westcot DW(1985)Water quality for agriculture,FAO irrigation and Drainage Paper 29 Rev.I,UN Food and Agriculture Organization,Rome
Bahar MM,Reza MS(2010)Hydrochemical characteristics and quality assessment of shallow groundwater in a coastal area of Southwest Bangladesh.Environ Earth Sci 6:1065–1073
BBS(2011)Bangladesh bureau of statistics and information division,ministry of the people republic of Bangladesh
BGS,DPHE(2001)Arsenic contamination of groundwater in Bangladesh.British Geologic Survey,Keyworth
Bhuiyan MAH,Parvez L,Islam MA,Dampare SB,Suzuki S(2010)Evaluation of hazardous metal pollution in irrigation and drinking water systems in the vicinity of a coal mine area of northwestern Bangladesh.J Hazard Mater 179:1065–1077
Bodrud-Doza M,Islam ARMT,Ahmed F,Das S,Saha N,Rahman MS(2016)Characterization of groundwater quality using water evaluation indices,multivariate statistics and geostatistics in central Bangladesh.Water Sci 30(1):19–40
Bozdag A(2015)Combining AHP with GIS for assessment of irrigation water quality in C,umrairrigation district(Konya),Central Anatolia,Turkey.Environ Earth Sci 73:8217–8236
Burrough PA,McDonnell RA(1998)Principles of geographical information systems.Oxford University Press,Oxford,p 333
Charbeneau RJ(2000)Groundwater hydraulics and pollutant transport.Waveland Press,Long Grove
Commonwealth Scientific and Industrial Research Organisation(CSIRO)(2014)Bangladesh integrated water resources assessment: final report.CSIRO,BIDS,BWDB,CEGIS,IWM,WARPO
Deepali M,Malpe DB,Zade AB(2011)Geochemical characterization of groundwater from northeastern part of Nagpur urban,Central India.Environ Earth Sci 62:1419–1430
Delhomme JP(1978)Kriging in the hydrosciences.Adv Water Res 1:251–266
Doneen LD(1964)Notes on water quality in agriculture.Published as a water science and engineering,Paper 4001,Department of Water Sciences and Engineering,University of California
Eaton FM(1950)Significance of carbonate in irrigation water.Soil Sci 62(2):123–133
Erguvanli K,Yuzer E(1987)Groundwater geology(hydrogeology).ITU Maden Fakültesi,Istanbul,p 339(in Turkish)
ESRI(2009)ArcGIS desktop software.ArcGIS Desktop 9.3,Redlands
Faneca Sanchez M,Bashar K,Janssen GMCM,Vogels M,Snel J,Zhou Y,Stuurman R,Dude Essink GHP(2015)SWIBANGLA:managing salt water intrusion impacts in coastal groundwater systems of Bangladesh,153
FAO/UNDP(1985)Report on tidal area study fisheries resources survey system FAO/UNDP-BGD/79/015 April 1985.http://www.fao.org/docrep/ field/003/AC352E/AC352E00.htm
Ferguson G,Gleeson T(2012)Vulnerability of coastal aquifers to ground water use and climate change.Nat Clim Change 2:342–345
Foster SSD(1995)Groundwater for development—an overview of quality constraints.In:Nash H,McCall GJH(eds)Groundwater quality.17th Special Report.Chapman and Hall,London,pp 1–3
Freeze RA,Cherry JA(1979)Groundwater.Prentice Hall Inc,Englewood Cliffs
Gibbs RJ(1970)Mechanisms controlling worlds water chemistry.Science 170:1088–1090
Goovaerts P(1997)Geostatistics for natural resource evaluation.Oxford University Press,New York
Gorai AK,Kumar S(2013)Spatial distribution analysis of groundwater quality index using GIS:a case study of Ranchi Municipal Corporation(RMC)area.Geoinfo Geostat Overv 1:2
Green TR,Taniguchi M,Kooi H,Gurdak JJ,Allen DM,Hiscock KM,Treidel H,Aureli A(2011)Beneath the surface of global change:impacts of climate change on groundwater.J Hydrol 405:532–560
Gupta SK(1983)Variations of water table in Yamuna drainage basin of Haryana-implications and management strategies.Paper presented at the Seminar on Strategies for Irrigation Water Management,Patna
Halim MA,Majumder RK,Nessa SA,Hiroshiro Y,Sasaki K,Saha BB,Saepuloh A,Jinno K(2010)Evaluation of processes controlling the geochemical constituents in deep groundwater in Bangladesh:spatial variability on arsenic and boron enrichment.J Hazard Mater 180:50–62
Haritash AK,Kaushik CP(2008)Suitability assessment of groundwater for drinking,irrigation and industrial use in some North Indian villages.Environ Monit Assess 145:397–408
IIASA (2013)Report.http://www.iiasa.ac.at/web/home/resources/publications/annual-report/ar13.pdf
Irabar A,Sanchez Perez JM,Lyautey E,Garabetian F(2008)Differentiated free living and sediment attached bacterial community structure inside and outside desertification hotspots in the river–groundwater interface.Hydrobiologia 598:109–121
Islam MA,Zahid A,Rahman MM,Rahman MS,Shammi M et al(2017)Investigation of groundwater quality and its suitability for drinking and agricultural use in the south central part of the coastal region in Bangladesh.J Expo Health 9(1):27–41.doi:10.1007/s12403-016-0220-z
Jalali M(2009)Phosphorous concentration,solubility and species in the groundwater in a semi-arid basin,southern Malayer,western Iran.Environ Geol 57:1011–1020
Jalali M(2011a)Nitrate pollution of groundwater in Toyserkan,western Iran.Environ Earth Sci 62:907–913
Jalali M (2011b)Hydrogeochemistry of ground water and its suitability for drinking and agricultural use in Nahavand,Western Iran.Nat Resour Res 20(1):65–73
Jiang Y,Wu Y,Groves C,Yuan D,Kambeis P(2009)Natural and anthropogenic Factors affecting the groundwater quality in the Nandongkarst Underground river systemin Yunan,China.J Contam Hydrol 109:49–61
Kaiser HF(1960)The application of electronic computers to factor analysis.Educ Physiol Meas 20:141–151
Kelley WP(1940)Permissible composition and concentration of irrigated waters.Proc ASCF 66:607
Konikow LF,Kendy E(2005)Groundwater depletion:a global problem.Hydrogeol J 13:317–320
Kumar PS(2014)Evolution of groundwater chemistry in and around Vaniyambadi industrial area:differentiating the natural and anthropogenic sources of contamination.Chem Erde Geochem 74(4):641–665
Kumar M,Kumari K,Ramanathan AL,Saxena R(2007)A comparative evaluation of groundwater suitability for irrigation and drinking purposes in two intensively cultivated districts of Punjab,India.Environ Geol 53:553–574
Kumari S,Singh AK,Verma AK,Yaduvanshi NPS(2013)Assessment and spatial distribution of groundwater quality in industrial areas of Ghaziabad, India. Environ Monit Assess 186(1):501–514
Liu SX,Hermanowicz SW,Peng M(2003)Nitrate removal from drinking water through the use of encapsulated microorganisms in alginate beads.Environ Technol 24:1129–1134
Marko K,Al-Amri NS,Elfeki AMM(2014)Geostatistical analysis using GIS for mapping groundwater quality:case study in the recharge area of WadiUsfan,western Saudi Arabia.Arab J Geosci 7:5239–5252
Masoud AA(2014)Groundwater quality assessment of the shallow aquifers west of the Nile Delta(Egypt)using multivariate statistical and geostatistical techniques.JAfrEarth Sci 95:123–137
Nayanaka VGD,Vitharana WAU,Mapa RB(2010)Geostatistical analysis of soil properties to support spatial sampling in a paddy growing Alfisol.Trop Agric Res 22:34–44
Piper AM (1944)A graphical procedure in the geochemical interpretation of water analysis.Trans Am Geophys Union 25:914–928
Raghunath HM(1987)Groundwater.Wiley Eastern Ltd,New Delhi
Rahman MATMT,Saadat AHM,Islam MS,Al-Mansur MA,Ahmed S(2017)Groundwater characterization and selection of suitable water type for irrigation in the western region of Bangladesh.Appl Water Sci 7(1):233–243
Rahman MATMT,Rahman SH,Majumder RK(2012)Groundwater quality for irrigation of deep aquifer in southwestern zone of Bangladesh.Songklanakarin J SciTechnol 34:345–352
Rahman MM,Sultana R,Shammi M,Bikash J,Ahmed T,Maruo M,Kurasaki M,Uddin MK(2016)Assessment of the status of groundwater arsenic at Singair Upazila,Manikganj Bangladesh;exploring the correlation with other metals and ions.Expo Health 8(2):217–225
Raju NJ(2007)Hydrogeochemical parameters for assessment of groundwater quality in the upper Gunjanaeru River basin,Cuddapah District,Andhara Pradesh,South India.Environ Geol 52:1067–1074
Richards LA(1954)Diagnosis and improvement of saline and alkaline soils.US Department of Agriculture Hand Book,Washington,p 60
Richards LA(1968)Diagnosis and improvement of saline and alkali soils.Agricultural hand book 60,USDA and IBH.Publishing Co.Ltd.,New Delhi,pp 98–99
Romanelli A,Lima ML,Londono OMQ,Martinez DE,Massone HE(2012)A Gis-based assessment of groundwater suitability for irrigation purposes in flat areas of the Wet Pampa Plain,Argentina.Environ Manag 50:490–503
Saleh A,Al-Ruwaih F,Shehata M(1999)Hydrogeochemical processes operating within the main aquifers of Kuwait.J Arid Envir 42:195–209
Sawyer CN,Mccarty PL(1967)Chemistry for sanitary engineers,2nd edn.McGraw Hill,New York,p 518
Shahid S,Chen X,Hazarika MK(2006)Evaluation of groundwater quality for irrigation in Bangladesh using geographic information system.J Hydrol Hydromech 54:3–14
Shahid SU,Iqbal J,Hasnain J(2014)Groundwater quality assessment and its correlation with gastroenteritis using GIS:a case study of Rawal Town,Rawalpindi,Pakistan.Environ Monit Assess 186:7525–7537
Shammi M,Bhuiya GMJA,Ibne KAK,Rahman MR,Rahman MM,Uddin MK(2012)Investigation of salinity occurrences in Kumar–Madhumati River of Gopalganj District,Bangladesh.J Nat Sci Sustain Technol 6:299–313
Shammi M,KarmakarB Rahman MM,Islam MS,Rahman R,Uddin MK(2016a)Assessment of salinity hazard of irrigation water quality in monsoon season of Batiaghata Upazila,Khulna District,Bangladesh and adaptation strategies.Pollution 2:183–197
Shammi M,Rahman R,Rahman MM,Moniruzzaman M,Bodrud-Doza M,Karmakar B,Uddin MK(2016b)Assessment of salinity hazard in existing water resources for irrigation and potentiality of conjunctive uses:a case report from Gopalganj District.Bangladesh.Sustain Water Resour Manag 2(4):369–378
Shammi M,Rahman MM,Islam MA,Bodrud-Doza M,Zahid A,Akter Y,Quaiyum S,Kurasaki M(2017)Spatio-temporal assessment and trend analysis of surface water salinity in the coastalregion of Bangladesh.Environ SciPollutRes 24(16):14273–14290
Sikder MT,Kihara Y,Yasuda M,Mihara Y,Tanaka S,Odgerel D et al(2013)River water pollution in developed and developing countries:judge and Assessment of physicochemical characteristics and selected dissolved metal concentration.CLEAN Soil Air Water 41(1):60–68
Simsek C,Gunduz O(2007)IWQ Index:a GIS-integrated technique to assess irrigation water quality.Environ Monit Assess 128:277–300
Singh PK,Tiwari AK,Panigarhy BP,Mahato MK(2013)Water quality indices used for water resources vulnerability assessment using GIS technique:a review.Int J Earth Sci and Eng 6:1594–1600
SRDI(1998)Coastal area and water salinity map of Bangladesh 1967 and 1997.Soil Resources Development Institute(SRDI),Dhaka
Subba RN(1998)Groundwater quality in crystalline terrain of Guntur district,Andhra Pradesh,Visakhapatnam.Visakha Sci J 2:51–54
Sundaray SK,Nayak BB,Bhatta D(2009)Environmental studies on river water quality with reference to suitability for agricultural purposes.Mahanadi river estuarine system,India—a case study.Environ Monit Assess 155:227–243
Tapoglou E,Karatzas GP,Trichakis JC,Varouchakis EA(2014)Aspatio-temporal hybrid neural network-Kriging model for groundwater level simulation.J Hydrol 519:3193–3203
Taylor RG,Scanlon B,Döll P,Rodell M,Van Beek R,Wada Y,Longuevergne L,Leblanc M,Famiglietti JS,Edmunds M,Konikow L(2013)Groundwater and climate change.Nat Clim Change 3(4):322–329
Tiwari AK,Singh PK,Mahato MK(2014)GIS-Based Evaluation of Water Quality Index of groundwater resources in west Bokaro Coal field,India.Curr World Environ 9(3):73–79
Todd DK(1980)Groundwater hydrology.Wiley,New York
Varouchakis EA,Hristopulos DT(2013)Improvement of groundwater level prediction in sparsely gaugedbasins using physical laws and local geographic features as auxiliary variables.Adv Water Res 52:34–49
Vasanthavigar M,Srinivasamoorthy K,Rajiv Ganthi R,Vijayaraghavan K,Sarma LS(2012)Characterisation and quality assessment of groundwater with a special emphasis on irrigation utility:thirumanimuttar sub-basin,Tamil Nadu,India.Arab J Geosci 5(2):245–258
Vyas A,Jethoo AS(2015)Diversification in measurement methods for determination of irrigation water quality parameters.Aquat Procedia 4:1220–1226
Webster R,Oliver MA(2001)Geostatistics for environmental scientists.Wiley,New York
Werner AD,Simmons CT(2009)Impact of sea-level rise on sea water intrusion in coastal aquifers.Groundwater 47:197–204
Wilcox LV(1955)Classification and use of irrigation waters.Circular 969.USDA,Washington
World Health Organization(WHO)(1997)Guidelines for drinking water quality.Geneva 1:53–73
World Health Organization(WHO)(2007)WHO country cooperation strategy 2008–2013:Bangladesh.WHO Country Office for Bangladesh,Dhaka.http://www.who.int/countryfocus/coopera tion_strategy/ccs_bgd_en.pdf.Accessed 16 April 2017
World Health Organization(WHO)(2017)Guidelines for drinking water quality: first addendum to the fourth edition.Licence:CC BY-NC-SA 3.0 IGO,Geneva.http://apps.who.int/iris/bitstream/10665/254636/1/9789241550017-eng.pdf?ua=1.Access 16 April 2017
杂志排行
Acta Geochimica的其它文章
- Limestone mechanical deformation behavior and failure mechanisms:a review
- Thermodynamic properties of San Carlos olivine at high temperature and high pressure
- Geochemistry and petrology of rift-related mafic sills and arc-related Gabbro–Diorite bodies,Northern Bafq District,Central Iran
- Influence on lacustrine source rock by hydrothermal fluid:a case study of the Chang 7 oil shale,southern Ordos Basin
- Elemental characteristics of lacustrine oil shale and its controlling factors of palaeo-sedimentary environment on oil yield:a case from Chang 7 oil layer of Triassic Yanchang Formation in southern Ordos Basin
- Determination of Hf–Sr–Nd isotopic ratios by MC-ICP-MS using rapid acid digestion after flux-free fusion in geological materials
