Individualization of Head Related Impulse Responses Using Division Analysis
2018-06-07WeiChenRuiminHuXiaochenWangChengYangLianMeng
Wei Chen, Ruimin Hu*, Xiaochen Wang, Cheng Yang, Lian Meng
1 National Engineering Research Center for Multimedia Software, School of Computer Science, Wuhan University, Wuhan 430072, China
2 Hubei Key Laboratory of Multimedia and Network Communication Engineering, Wuhan University, Wuhan 430072, China
3 Collaborative Innovation Center of Geospatial Technology, Wuhan 430079, China
4 School of Physics and Electronic Science, Guizhou Normal University, Guiyang 550001, China
I. INTRODUCTION
HRIR involves the impulse information which relates the sound source location and the ear location, and it describes the changes in the sound pressure from a point in the free field to listener’s ear drum [1]. The corresponding frequency domain information of HRIR is called head-related transfer function (HRTF).
A monaural sound can be transformed into an arbitrary source sound by convoluting with HRIR. Hence, HRIRs are generally used to generate virtual three-dimensional (3D) auditory. However, the HRIR varies from subject to subject due to the difference in anthropometric features [2]. Ideal HRIR information can be obtained by measurement but, unfortunately, the measurements are time-consuming and need expensive equipment [3]. Virtual 3D auditory with non-individualized HRIR may cause errors in sound localization such as front-back reversals, up-down confusions and inside of head localization [2,4-6]. Therefore,the research on HRIR customization has great significance.
Several methods for HRIR or HRTF individualization have been proposed, such as HRTF database matching [7-9], HRTF scaling in frequency [6,10], boundary element method[11-14], customized HRTF through a subjective tuning [15-17] and build mathematical model based on regression analysis [18-21].
One of the most promising method for HRTF individualization is based on building structural models [22-25], which aims to establish the mapping relations between anthropometric parameters and HRTF or HRIR.Although interaural time difference (ITD) and interaural level differences (ILD) are known to be the primary localization cues in the horizontal plane [26-28], there still have additional cues arising due to the various shadowing and diffraction effects caused by head, pinna, and torso [29,30].
Recently, several novel methods aimed establish relationships between the HRTF and anthropometric features were provided. Iida and Ishii et al. proposed a method for HRTF individuation by estimating the frequencies of the two lowest spectral notches based on the anthropometry of pinna [31]. Bilinski, Ahrens et al. synthesized the HRTF phase frequency response from the sparse representation of anthropometric features [32]. Grijalva et al.reconstructed low-dimensional HRTFs from anthropometric features and then reconstruct the HRTF using a neighborhood-based reconstruction approach [33].
But the effect of each anthropometric measurement on HRIR is not yet conclusive. From a physical point of view, objects with different sizes have varied effects on sound wave reflection and diffraction. Thus, different anatomical parts may provide different contribute to the temporal and spectral features in HRIR and HRTF.
In this paper, we studied the relationship between anthropometric measurements and different HRIR parts by dividing the HRIRs into several segments and performing regression analysis between each segment and anthropometric measurements. Furthermore,we propose an effective method of generating individual HRIR using anthropometric measurements.
In our method, the HRIR data is preprocessed to remove the time delay before the arrival of first pulse to subject’s ear drum.Consequently, we reserve 128 samples (about 3 ms) from each HRIR for further analysis, in which contains the effects of pinna, head, and torso [34]. Then each truncated HRIR is divided into 3 segments, and regrouped according to the directions and segments. Subsequently,the grouped HRIRs are estimated using multiple linear regression (MLR) analysis to obtain the mapping relationship between the HRIRs and anthropometric measurements. Finally,we can estimate the individual HRIR with the subject’s anthropometric measurements and individual coefficients obtained from the mapping relationship.
The whole proposed approach is presented in section II, and the objective simulation and subjective test are described in section III. The last section presents the conclusions of our work and further issues.
In this paper, the authors propose a simple and effective method for modeling relationships between anthropometric measurements and HRIRs.
II. PROPOSED APPROACH
The outline of individualization process is shown in figure 1. The rest of this section discusses the key steps of HRIR Individualization process.
2.1 HRTF Database

Fig. 1. Process of Individualization.
The labeled S0 in figure 1 represents the HRTF database to be analyzed, the database is provided by CIPIC Interface Laboratory of California University at Davis [35,36]. The Release 1.2 for CIPIC HRTF database involves 45 subjects, including 43 human subjects and 2 KEMAR with small pinnae and large pinnae respectively. We choose 37 out of 45 subjects from the database, due to some measurements of the rest 8 subjects are not available. Each subject’s data contains 1250 HRIRs of each ear and the length of each HRIR is 200. So,we extracted a total of 92,500 original HRIRs from 37 subjects, which is marked by S1 in figure 1. And also, we extracted the anthropometric measurements of the 37 subjects from the HRTF database. Detailed selection process of anthropometric measurements is explained in the subsection 2.3.
2.2 HRIR preprocessing
Although each original HRIR has 200 samples, many samples are considered approximately equal to 0. Figure 2 shows the left ear’s HRIR amplitudes of KEMAR with small pinnae (subject_165) from CIPIC’s database.On the left panel, all the horizontal HRIRs are superimposed upon the image. And on the right panel, only left HRIR with azimuth equal-80º is shown. The zero values before the first pulse are related to the measurement distance and the ITD, and the approximately zero values at the end part of the waveform are caused by the attenuation of the signal.
In our model, we removed the time delay,and reserved 128 samples (about 3 ms) of each HRIR data since the first pulse arrived at ear drum. Our process of determine the main direct pulse is described as follows:

Fig. 2. HRIR amplitudes of KEMAR with small pinnae.
1) locating the max positive amplitude Ai,θ,φof the i-th subject’s HRIR, with the azimuth θ and elevation φ.
2) locating HRIR’s first direct pulse peak.We set a threshold of 0.3×Ai,θ,φ, and find out the first peak with larger amplitude as the first direct pulse peak. Although CIPIC provide the exact arrival time of each impulse response in their database, from which the direct pulse peak can be calculated more accurately, we are inclined to find out the first peak with generic approach. We examined all the HRIR set of horizontal-plane extracted from CIPIC’s database and finally chose 0.3 as a reasonable compromise between the accuracy and universality.
3) searching from the first direct pulse peak back to front until there is an increase in the HRIR amplitude, which is labelled as direct pulse’s first sampling point.
In order to confirm the validity of the trunked HRIR, we calculated the energy proportion between the original HRIR and trunked HRIR.The proportion P is calculated as follows:
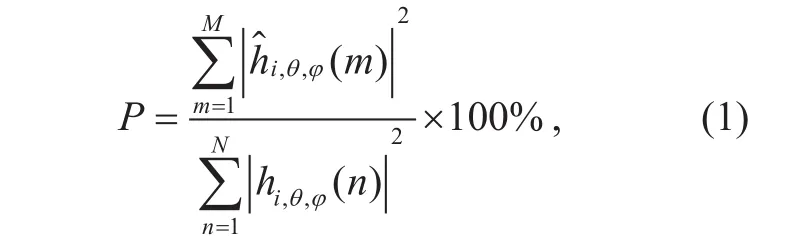
where hi,θ,φ(n) corresponds to the n-th HRIR amplitude of the i-th subject with the azimuth θ and elevation φ, h^i,,θϕis the corresponding trunked results of HRIR.
We calculated the proportion of all the 92,500 HRIRs’, and got an average proportion of 99.74%, with the lowest proportion 95.49%appear in the direction with azimuth angle 40º and elevation angle -39.375º from subject_135. Thus, HRIR truncation to a length of 128 should be sufficient for the subsequent processing.
2.3 Selection of anthropometric measurements
The CIPIC HRTF database [36] provides a set of 27 anthropometric measurements including 17 for the head and 10 for the pinna (Figure 3).
Correlation analysis has been used by several authors to select appropriate anthropometric measurements [3,4,37,38]. However,the effect of anthropometric measurements on HRIR is still an unsolved problem. In our model, we focus on relationships between the HRIR segments and anthropometric measurements, which follow the assumption that anthropometric measurements have different effect on each HRIR segments.
Autocorrelation between anthropometric parameters may lead to flaw regression model.So, we applied correlation analysis on anthropometric parameters to determine which parameters should be excluded. Due to the obvious scale difference between pinna size and head and torso size, we computed the correlation coefficient of pinna features and head and torso features, respectively. It should be noted x15(height) and x16(seated height) were excluded beforehand, because these measurements are not available for all subjects.

Fig. 3. Subject’s anthropometric measurements [36].

Fig. 4. Correlation coefficients of anthropometric parameters.
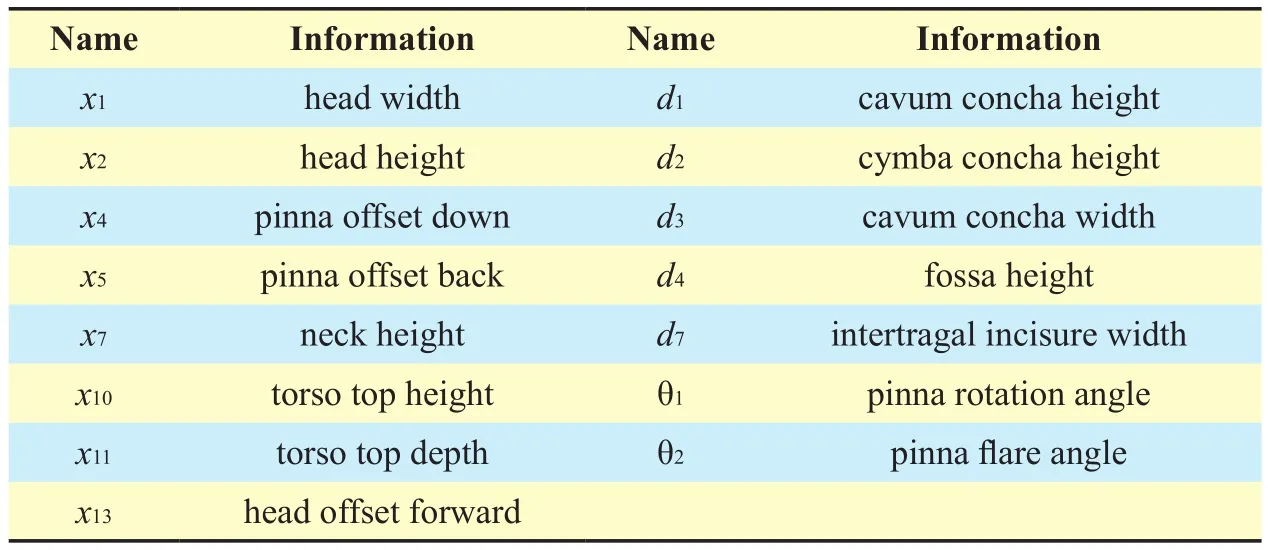
Table I. Selected anthropometric parameters.

Fig. 5. Left ear’s HRIRs of subject_003 in median plane.
Suppose that matrix A (N×R) is composed of R×1 column vectors with each vector is a certain kind of anthropometric measurements of all subject’s, N is the count of samples and R is the count of anthropometric features.
Let fn,rdenote the r-th feature of the n-th sample. And for the r-th feature Frcan be written as follows:

Then the correlation coefficient ρx,ybetween x-th feature and y-th feature can be calculated as follows:

Then we sum up each feature’s correlation coefficient:

where Sxis the x-th feature’s correlation score.The bigger Sxmeans the x-th anthropometric feature has stronger correlation with other features. For the pinna’s features, we set a threshold of 2.6, and removed 3 strongest correlated features: d5, d6, d8. And for the head and torso features, we set a threshold of 5.2, and removed 7 strongest correlated features: x3, x6,x8, x9, x12, x16, x17. Figure 4 in page 95 shows the correlation coefficients of the anthropometric parameters.
Finally, we selected 15 anthropometric parameters as candidates in our model, for details see table I.
2.4 HRIR division strategy
The truncated HRIRs are categorized into 2500 groups according to the measurement directions (2 ears, 1250 directions each ear), and each HRIR is divided into 3 segments of different lengths. Mark S3 in figure 1 shows the results after this step. And then we will discuss the division strategy of HRIR.
The HRIR data from CIPIC’s database are obtained by blocked-meatus measurement[36]. The records are limited to a length of 200 sample points (about 4 ms). Figure 5. shows HRIR image corresponding to azimuth 0º with all elevations for subject_003 in CIPIC’s database.
There have been many researches about composition of the HRIR response in terms of pinna effects, head reflection and diffraction,torso reflection, etc. [30,34,39] And it is generally accepted that there have four distinct areas, which marked as 1, 2, 3 and 4, as shown in Figure 5, corresponding to the effects of different anthropometric features.
The HRIR data from CIPIC’s database was measured when the subject is seated in the center of a 1m radius hoop whose axis is aligned with the subject’s interaural axis[35,36]. Thus, the direct sound wave from loudspeakers will reach the ear channel first,and then followed by other composition of responses in terms of pinna effects, torso reflection and knee reflection [30].
There has a faint initial pulse area before area 1, which is attributable to the probe microphone’s nature factors [30,36]. Area 2(from 0.8 ms to 1.2 ms) depicts the effects of direct sound wave reaches the pinna and the diffraction effects of head and pinna. Area 3(from about 1.2 ms to 2 ms) depicts the reflection due to torso. The faint ridges after 2 ms is caused by knee reflections [36].
In our model, we discarded the HRIR data before the direct wave’s arrival to pinna and only reserved 128 samples (detail in subsection 2.2), which covered area 2, 3 and 4 marked in Figure 5.
Based on the above discussion, anthropometric features may play different roles in the view of temporal sequence of HRIR data.Thus, we divided the 128-length HRIR (about 3 ms) into 3 segments according to the main effecting of anthropometric features, and then the relationships between each segment and anthropometric features will be evaluated.
2.5 MLR model of HRTF individualization
Then at S4 in figure 1, we use multiple linear regression (MLR) to analyze the relationship between anthropometric measurements and HRIR segments. The model for multiple linear regression is given by,

in which S represents current HRIR segment and matrix X represents anthropometric measurements derived from CIPIC’s database and matrix β represents regression coefficients and E is the estimation error.
For each particular HRIR segment of given direction, we will choose relevant anthropometric measurements to set up matrix X. For example, there will be a 37×13 matrix X for the 16-length HRIR segment, the row count of X corresponds to the sample size (37 HRTF samples chose from CIPIC’s database, detail in section 2.1) and the number of columns corresponds to the feature count of given HRIR segment (detail in table II), and it should be noted that, the value of the first column of X is all 1 for calculation requirement.
Then β can be estimated using least square estimates, which is given by,

in which X′ represents the transpose of the matrix X and -1 represents the matrix inverse.The MRL model can now be estimated by,

As discussed in subsection 2.4, we divided the HRIR response into 3 segments and each segment corresponding to the effects of a series anthropometric features. Thus, for each segment, we selected most likely relevant anthropometric features from the candidates list(detail in table I) according to the corresponding effects.
And consequently, after MLR process we will get the individual coefficients, whose structure is illustrated by S6 in Figure 1.
2.6 Generate Individualized HRIR
The dotted lines in figure 1 illustrate the process of generating individualized HRIRs.With Individual coefficients achieved from the MLR process, we can get the subject’s individual “HRIR Groups” (S7 in figure 1)in packet format. Then the segments can be reconstructed into individualized HRIRs in accordance with the location information.The removed delay time mentioned before are inserted respectively to the left-ear HRIR and right-ear HRIR, and we also fill up each HRIR to 200-length with zeros to keep the same length with original HRIRs. Eventually we will get the individualized HRIRs (S8 in figure 1) from the particular subject’s anthropometric measurements (S5 in figure 1).
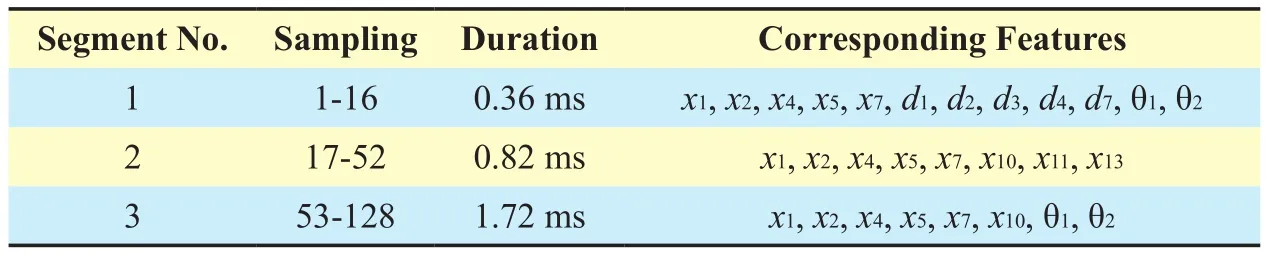
Table II. Anthropometric features for each HRIR segments.

Fig. 6. Reconstructed results of subject 165 (azimuth = -80º; elevation = 0º).
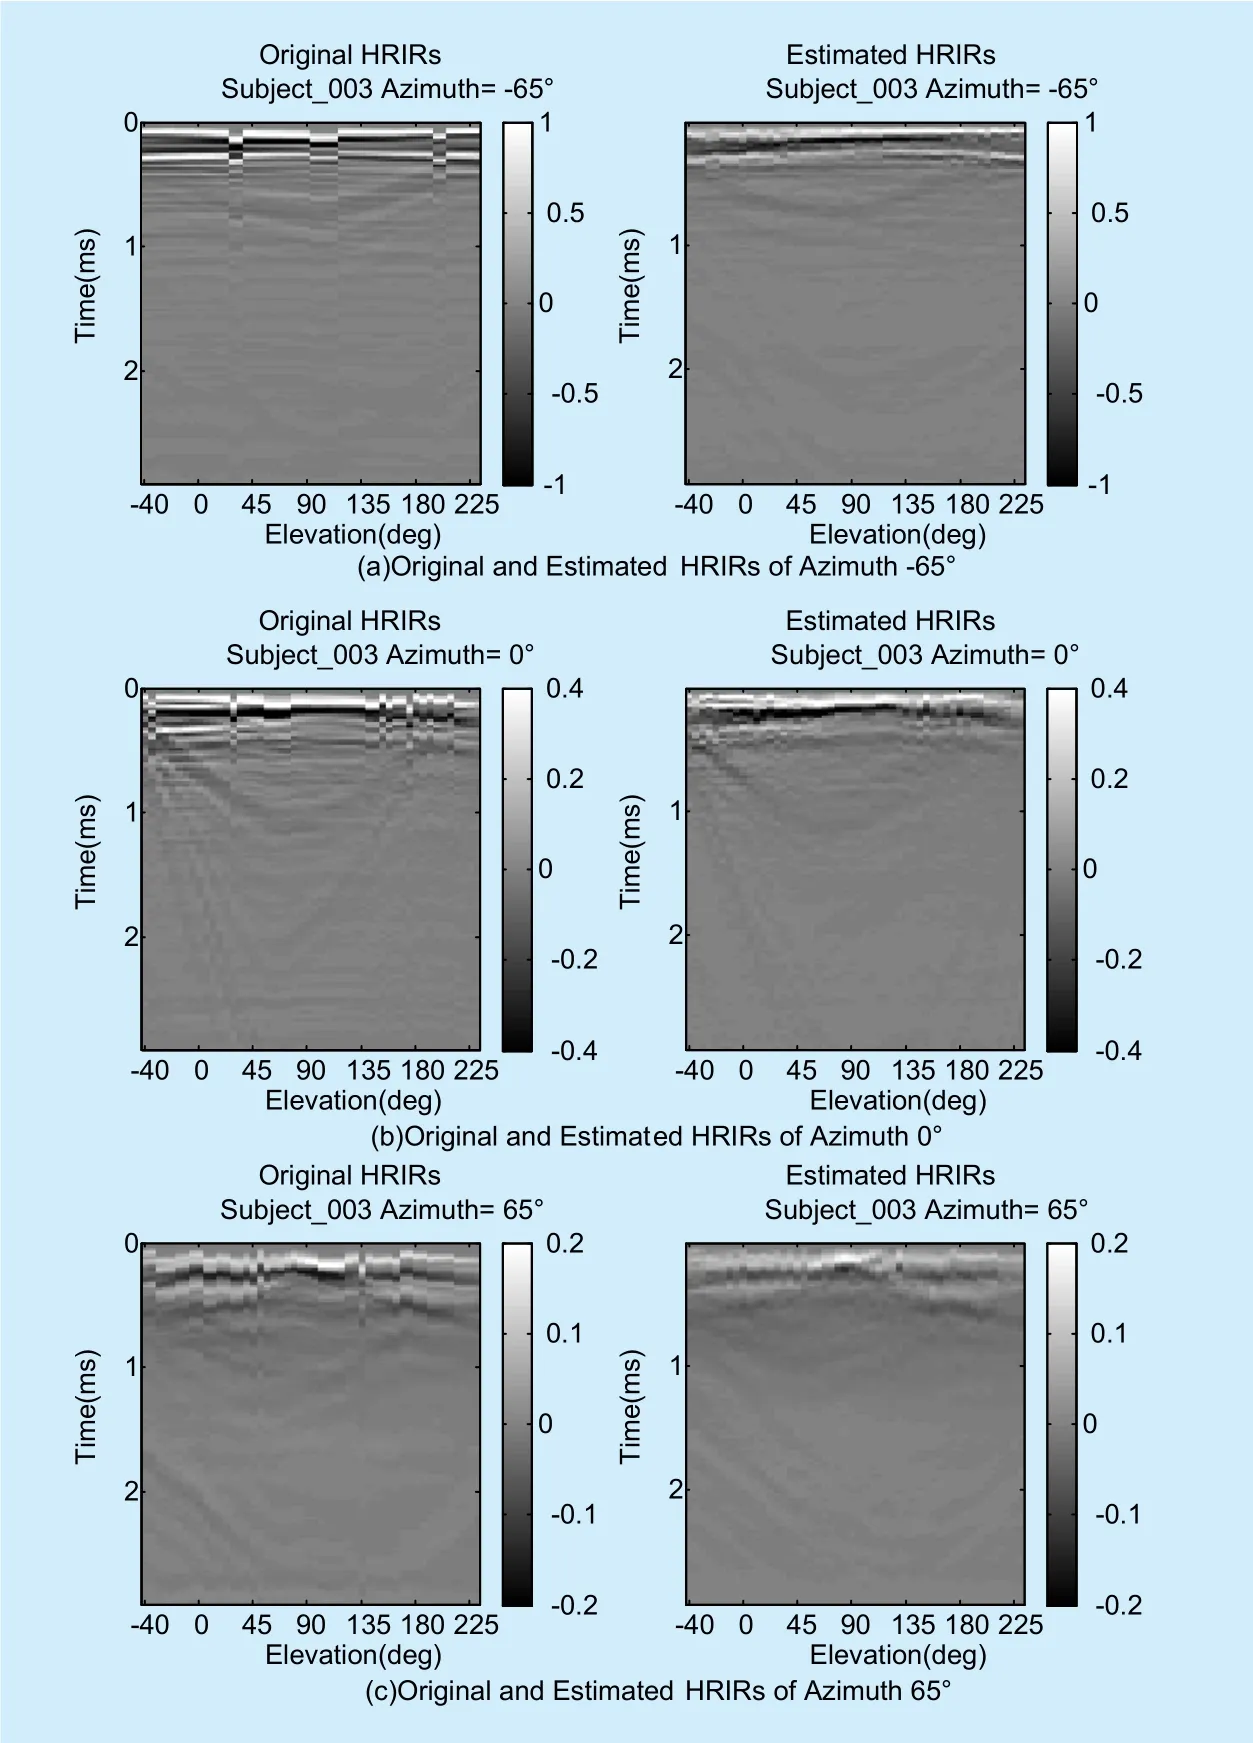
Fig. 7. Original and estimated HRIRs with all elevations.
The main processes are as follows:
a) calculate the subject’s individual “HRIR Groups” of given location.
b) connect the “HRIR Groups” of given location into a 128-length HRIR (shown in Figure 1, S7).
c) reconstruct ITD information by adding delay time to the reconstructed left-HRIR and right-HRIR according to the given location.
d) fill up each reconstructed HRIR to 200-length with zeros to keep the same length with CIPIC’s original HRIRs.
Figure 6 shows the left ear’s HRIR amplitudes of Subject_165 and its reconstructed results from 15 anthropometric measurements.The top panel shows the intermediate results of estimated HRIR from anthropometric measurements, in which the delay time hasn’t been added and the total HRIRs length is still 128. And on the bottom panel shows the final results. The results indicate that the estimated HRIRs are quite similar as the original ones.
III. EXPERIMENTS’ RESULTS AND DISCUSSION
The CIPIC HRTF database contains 45 subjects’ HRIR data including two KEMAR subjects, which Subject_021 is KEMAR with large pinnae and Subject_165 is KEMAR with small pinnae. We select Subject_003 as our references in the objective simulation experiments, and Subject_165 as our reference in the subjective sound localization test.
3.1 Objective Simulation and Results
Figure 7 shows the estimated HRIRs results of Subject_003. The images on the top, middle and bottom panel shows the comparison of original HRIRs and estimated HRIRs of Subject_003 with azimuth angle -65º, 0º, and 65º, respectively. It can be seen the estimated HRIRs can well approximate the corresponding original ones.
We also estimated objective simulation performance by comparing the spectral distortion(SD) between the estimated HRIRs and the referenced HRIRs. The SD is calculated as follows

where Hθ,ϕ( fn) corresponds to the n-th frequency of the HRTF calculated from measured HRIR with azimuth θ and elevation φ,is the corresponding frequency of estimated HRIR. And the larger result SD(θ,φ) means the estimated HRIRs have worse performance.
Table III shows the comparison results between several different regression approaches [40,41]. There are Principal Component Analysis (PCA) [18,42], two dimensional PCA (2DPCA) [18,42], Partial Least Squares Regression (PLSR) [43,44], Tensor-Singular Value Decomposition (T-SVD) [45]. The results in table III shows the left ear’s average spectral distortion values of all angles over the whole frequency spectrum, and all the results are in dB. As shown in table III that SD values have an average reduction of 0.88 dB compared with other methods.
Figure 8 shows the comparison results of Subject_003’s left estimated and original HRTF. As is shown, the first spectral peak around 4 kHz and the two lowest spectral notches, which are considered to be the key cues of localization [31], could be recognized clearly.
3.2 Subjective localization test and results
We evaluated the performance of the individualization method by subjective test. Eight subjects with normal hearing sensitivity and balanced pure-tone hearing thresholds participated in the subjective localization tests. Table IV shows the basic information of the subjects.
For the collection of listeners’ anthropometric parameters, a system about digital image acquisition system is designed. The system uses a Nikon D800 camera with AF-S NIKKOR 24-70mm f/2.8G ED lens as the image capture device. Each listener will be taken four pictures (the front, left and right view of upperbody, and the top view of head), and then pictures will be analyzed by the system to extract necessary anthropometric parameters. In order to improve the measurement precision, each listener will be measured three times, and the mean value is used as measurement result.

Table III. Spectral distortion scores of different methods.

Fig. 8. Original and estimated HRTFs with all elevations.

Fig. 9. Extract pinna parameters from pictures.
Figure 10 shows the GUI of the localization test. We adopted a 250 ms bust of white Gaussian noise as test sound, and selected 10 azimuths which approximately uniform distribute in the horizontal plane. Each subject took two rounds subjective test, and we used Subject_165’s (KEMAR with small pinnae)measured HRIRs as reference HRIRs, and filtered the white noise with measured HRIRs and individualized HRIRs respectively to generate a test sequence of 20 listening test samples. Then these test samples were presented to test listeners in random order. At each run,the subjects clicked “PLAY” button to play a stimulus, and submitted the perceived direction by clicking corresponding button on the left panel. There had no restriction on the repetitions of playing the stimulus before making decision, and the subjects could play the original mono white noise at any time by clicking“Original” button.

Fig. 11. Result of subjective localization test.
The results are shown in Figure 11, the line with the positive slope refers to perfect responses and the two negatively sloped lines refer to front-back confusions (FBCs). The size of circle is proportional to the number of times the subject indicates that direction, and the counts are printed inside the corresponding circles. The average correct rate with Subject_165’s HRIRs is 35.63%, while the correct rate is 58.13% using the individualized HRIRs.And the count of FBCs using Subject_165’s HRIRs is 50 while only 27 with individualized HRIRs. The detailed results of each subject are listed in table V. It can be seen, all the correct rates have improved compared with the KEMAR HRIRs, and the correct rate has been increased by 22.5%.
Overall, the results of the test indicate a statistically significant improvement in localization.

Table IV. Basic information of the subjects.

Table V. Detailed results of subjective localization test.
IV. CONCLUSIONS
In this paper, we proposed a simple and effective method for modeling relationships between anthropometric measurements and HRIRs. We suggest that the relationship between anthropometric features and different HRIR parts is fairly complicated, so we divided the HRIRs into small segments and carried out regression analysis between anthropometric measurements and each HRIR segment to establish relationship model. The results of objective simulation and subjective test indicate that the model can generate individualized HRIRs from a series of anthropometric measurements, and with the individualized HRIRs,we can get more accurate acoustic localization than using non-individualized HRIRs.
ACKNOWLEDGEMENTS
This work is supported by the National Key R&D Program of China (No.2017YFB1002803), the National Nature Science Foundation of China (No. 61671335, No.U1736206, No.61662010), the Hubei Province Technological Innovation Major Project (No.2016AAA015). The authors thank CIPIC Interface Laboratory of California University at Davis for providing the CIPIC HRTF Database.
[1] A. Kan, C. Jin, and S. A. Van, “A psychophysical evaluation of near-field head-related transfer functions synthesized using a distance variation function,” Journal of the Acoustical Society of America, Vol. 125, no. 4, 2009, pp. 2233-2242.
[2] E. M. Wenzel, et al., “Localization using nonindividualized head-related transfer functions,”Journal of the Acoustical Society of America, Vol.94, no. 1, 1993, pp. 111-123.
[3] L. Wang, F. Yin, Z. Chen, “A hybrid compression method for head-related transfer functions,”Applied Acoustics, Vol. 70, no. 9, 2009, pp. 1212-1218.
[4] B. G. Shinn-Cunningham, S. Santarelli, N. Kopco,“Tori of confusion: Binaural localization cues for sources within reach of a listener,” Journal of the Acoustical Society of America, Vol. 107, no. 3,2000, pp. 1627–1636.
[5] H. Moller, M. F. Sorensen, et al., “Head-related transfer functions of human subjects,” AES:Journal of the Audio Engineering Society, Vol. 43,1995, pp. 300-321.
[6] J. C. Middlebrooks, “Virtual localization improved by scaling nonindividualized external-ear transfer functions in frequency,” Journal of the Acoustical Society of America, Vol. 106,no. 1, 1999, pp. 1493-5100.
[7] X. Y. Zeng, S. G. Wang, L. P. Gao, “A hybrid al-gorithm for selecting head-related transfer function based on similarity of anthropometric structures,” Journal of Sound & Vibration, Vol.329, no. 19, 2010, pp. 4093-4106.
[8] D. N. Zotkin, J. Hwang, et al., “HRTF personalization using anthropometric measurements,”Proc. Applications of Signal Processing To Audio and Acoustics, 2003, pp. 157-160.
[9] D. N. Zotkin, R. Duraiswami, et al., “Virtual audio system customization using visual matching of ear parameters,” Proc. International Conference on Pattern Recognition, 2002, pp. 1003-1006.
[10] J. C. Middlebrooks, “Individual differences in external-ear transfer functions reduced by scaling in frequency,” Journal of the Acoustical Society of America, Vol. 106, no. 3, 1999, pp. 1480-1492.
[11] B. F. G. Katz, “Measurement and calculation of individual head-related transfer functions using a boundary element model including the measurement and effect of skin and hair impedance,” Dissertation Abstracts International, Vol.59, no. 06, 1998, pp. 2798.
[12] V. R. Algazi, R. O. Duda, et al., “Approximating the head-related transfer function using simple geometric models of the head and torso”,Journal of the Acoustical Society of America, Vol.112, no. 1, 2002, pp. 2053-2064.
[13] B. F. Katz, “Boundary element method calculation of individual head-related transfer function. I. Rigid model calculation,” Journal of the Acoustical Society of America, Vol. 110, no. 1,2001, pp. 2440-2448.
[14] W. Kreuzer, P. Majdak, Z. Chen, “Fast multipole boundary element method to calculate head-related transfer functions for a wide frequency range,” Journal of the Acoustical Society of America, Vol. 126, no. 3, 2009, pp. 1280-1290.
[15] K. H. Shin, Y. Park, “Enhanced Vertical Perception through Head-Related Impulse Response Customization Based on Pinna Response Tuning in the Median Plane,” Ieice Transactions on Fundamentals of Electronics Communications &Computer Sciences, Vol. 91, no. 1, 2008, pp. 345-356.
[16] K. J. Fink, L. Ray, “Individualization of head related transfer functions using principal component analysis,” Applied Acoustics, Vol. 87, no. 87,2015, pp. 162-173.
[17] P. Runkle, A. Yendiki, G. H. Wakefield, “Active Sensory Tuning for Immersive Spatialized Audio,” Proc. ICAD, 2000.
[18] H. Hu, L. Zhou, et al., “Head Related Transfer Function Personalization Based on Multiple Regression Analysis,” Proc. International Conference on Computational Intelligence and Security,2007, pp. 1829-1832.
[19] T. Nishino, N. Inoue, et al., “Estimation of HRTFs on the horizontal plane using physical features,”Applied Acoustics, Vol. 68, no. 8, 2007, pp. 897-908.
[20] Hugeng, et al., “Improved Method for Individualization of Head-Related Transfer Functions on Horizontal Plane Using Reduced Number of Anthropometric Measurements,” Computer Science, Vol. 2, no. 2, 2010, pp. 31-41.
[21] Hugeng, et al., “Effective Preprocessing in Modeling Head-Related Impulse Responses Based on Principal Components Analysis”, Signal Processing An International Journal, Vol. 4, no. 4,2010, pp. 201-212.
[22] V. R. Algazi, R. O. Duda, et al., “Approximating the head-related transfer function using simple geometric models of the head and torso,” Journal of the Acoustical Society of America, Vo. 112,no. 1, 2002, pp. 2053-2064.
[23] C. P. Brown, R. O. Duda, “A structural model for binaural sound synthesis,” Speech & Audio Processing IEEE Transactions on, Vol. 6, no. 5, 1998,pp. 476-488.
[24] V. C. Raykar, et al., “EXTRACTING SIGNIFICANT FEATURES FROM THE HRTF,” Georgia Institute of Technology, 2003, pp. 115-118.
[25] R. Bomhardt, J. Fels, “Individualization of head-related transfer functions by the principle component analysis based on anthropometric measurements,” Journal of the Acoustical Society of America, Vol. 140, no. 4, 2016, pp. 3277-3277.
[26] J. Blauert, “Spatial hearing : The psychophysics of human sound localization,” Physiology, 1983.
[27] G. F. Kuhn, “Model for interaural time differences in the azimuthal plane,” Journal of the Acoustical Society of America, Vol.62, no. 1, 1977, pp.157-167.
[28] J. W. Strutt, “On our perception of sound direction,” Philos. Mag., Vol. 13, 1907, pp. 214–232.
[29] M. R. Bai, K. Y. Ou, “Head-related transfer function (HRTF) synthesis based on a three-dimensional array model and singular value decomposition,” Journal of Sound & Vibration, Vol.281,2005, pp. 1093–1115.
[30] V. C. Raykar, R. Duraiswami, B. Yegnanarayana,“Extracting the frequencies of the pinna spectral notches in measured head related impulse responses,” Journal of the Acoustical Society of America, Vol. 118, no. 1, 2005, pp. 364-374.
[31] K. Iida, Y. Ishii, S. Nishioka, “Personalization of head-related transfer functions in the median plane based on the anthropometry of the listener’s pinnae,” Journal of the Acoustical Society of America, Vol. 136, no. 1, 2014, pp. 317-333.
[32] P. Bilinski, J. Ahrens, et al., “HRTF magnitude synthesis via sparse representation of anthropometric features,” Proc. ICASSP, 2014, pp.4501-4505.
[33] F. Grijalva, L. Martini, et al., “A manifold learning approach for personalizing HRTFs from anthropometric features,” IEEE/ACM Transactions on Audio Speech & Language Processing, Vol. 24,no. 3, 2016, pp. 559-570.
[34] S. Hwang, Y. Park, “HRIR Customization in the Median Plane via Principal Components Analysis,” Proc. Audio Engineering Society Conference,International Conference: New Directions in High Resolution Audio, 2007, pp. 638-648.
[35] “Cipic hrtf database files, realase 1.2,” 2004,http://interface.cipic.ucdavis.edu/.
[36] V. R. Algazi, R. O. Duda, et al., “The CIPIC HRTF database,” Proc. Applications of Signal Processing to Audio and Acoustics, 2001 IEEE Workshop on the. IEEE, 2001, pp. 99-102.
[37] Hugeng, et al., “The Effectiveness of Chosen Partial Anthropometric Measurements in Individualizing Head-Related Transfer Functions on Median Plane,” Itb Journal of Information &Communication Technology, Vol. 5, no. 1, 2011,pp. 35-56.
[38] C. S. Reddy, R. M. Hegde, “A Joint Sparsity and Linear Regression Based Method for Customization of Median Plane HRIR,” Proc. Asilomar Conference on Signals, 2015, pp. 785-789.
[39] V. R. Algazi, R. O. Duda, et al., “Structural composition and decomposition of HRTFs,” Proc.Applications of Signal Processing to Audio and Acoustics, 2001 IEEE Workshop on the, 2001, pp.103-106.
[40] M. Rothbucher, M. Durkovic, et al., “HRTF customization using multiway array analysis,” Proc.Signal Processing Conference, 2010, pp. 229-233.
[41] Alexander, Rothbucher, et al., “HRTF Customization by Regression,” Technische Universität München, 2014.
[42] T. Nishino, N. Inoue, et al., “Estimation of HRTFs on the horizontal plane using physical features,”Applied Acoustics, Vol. 68, no. 8, 2007, pp. 897-908.
[43] H. M. Hu, et al., “Head-Related Transfer Function Personalization Based on Partial Least Square Regression,” Journal of Electronics & Information Technology, Vol. 30, no. 1, 2011, pp. 154-158.
[44] Q. Huang, L. Li, “Modeling individual HRTF tensor using high-order partial least squares,” EURASIP Journal on Advances in Signal Processing,Vol. 1, 2014, pp. 1-14.
[45] G. Grindlay, M. A. O. Vasilescu, “A Multilinear(Tensor) Framework for HRTF Analysis and Synthesis,” Proc. IEEE International Conference on Acoustics, Speech and Signal Processing, 2007,pp. I-161-I-164.
杂志排行

China Communications的其它文章
- Geometric Mean Decomposition Based Hybrid Precoding for Millimeter-Wave Massive MIMO
- Outage Performance of Non-Orthogonal Multiple Access Based Unmanned Aerial Vehicles Satellite Networks
- Outage Probability Minimization for Low-Altitude UAV-Enabled Full-Duplex Mobile Relaying Systems
- Optimal Deployment Density for Maximum Coverage of Drone Small Cells
- Energy Efficient Multi-Antenna UAV-Enabled Mobile Relay
- Energy-Efficient Trajectory Planning for UAV-Aided Secure Communication