Causality Diagram-based Scheduling Approach for Blast Furnace Gas System
2018-05-02FengJinJunZhaoChunyangShengandWeiWangSenior
Feng Jin,Jun Zhao,,Chunyang Sheng,and Wei Wang,Senior
I.INTRODUCTION
BLAST furnace gas(BFG)is one of the most important byproduct gases generated from blast furnace,which is widely used as secondary fuel for some other production processes in iron and steel industry.Rational scheduling of BFG can raise the economic pro fit,improve the production efficiency,reduce the waste of energy and alleviate the environmental pollution.In practical production processes,scheduling solutions are determined mostly by the experience of the scheduling experts.In such a way,low accuracy and incomplete scheduling might be generated.Thus,studies focused on the scheduling problem were presented in literature.A Bayesian network was used to determine the structure of the adjustable users in[1],and the scheduling amount was obtained by computing the posterior probability.In order to obtain the scheduling amount,a hybrid parameter optimization algorithm was developed to optimize the model for high prediction accuracy in[2].Also,a Gaussian process-based echo states network(ESN)was proposed to predict the gas tank level,and a certain heuristic method was developed to quantify the users gas adjustment[3].A dynamic mixed integer linear programming model is established to achieve total scheduling amount in[4]and a bene fit and cost(BAC)model-based algorithm was proposed to solve the online byproduct gas scheduling problem in[5].However,these methods enumerated above had two common limitations.One is that the real-time status of the scheduling units was not being taken into account,and the other is that the total scheduling amount obtained by the gas tank level prediction may cause the accumulation of iteration error.
Fuzzy C-means(FCM)clustering[6]is one of the major clustering algorithms which has been widely used in many fields,such as the long-term prediction for time series[7],the image segmentation[8]and the feature extraction[9].FCM establishes the uncertainty description of the samples and can objectively reflect the actual situation of industrial data.Based on its characteristics that data can be separated into a number of groups and the objects in each group showing a high similarity,FCM is capable of selecting the historical scheduling solutions most close to the current condition and calculating the total scheduling amount.However,the traditional FCM is not suitable for such an industrial scheduling problem since the reported studies in literature only take the geometric distances among the sample data into account,which failed to clearly describe the causal relationships among the clustering variables,especially for the practical industrial problem.
Causality is a kind of analysis method which is highly consistent with human cognition mode.Pearl established the causality model[10],and employed a directed acyclic graphs(DAGs)to denote the cause and the effect among variables.One can reference a series of typical instances related to the causality-based research.A syntax and semantics of neuron diagrams were formalized to identify the causal effects in[11].A graphical representation of missing data mechanism was presented in[12].And then a causal model was reported to solve the problem of estimating the causal relationship from data with missing entries[13].Similarly,a minimal causal model is presented for the reliable knowledge discovery[14].In addition,a causal effect criterion was made for model selection[15].The above mentioned studies indicated the reliability of the causality-based approaches when facing with the data-driven modeling or referencing.

Fig.1.Structure of BFG system.
In this paper,a causality diagram is established to describe the causal relationships among the decision objective and variables of the scheduling process for the BFG energy system,based on which the total scheduling amount can be computed by using a modified fuzzy C-means clustering algorithm.Given that the Euclidean distance is combined with the causal relationships among the clustering variables,the proposed clustering method is more suitable to the application problems described in this paper than the traditional one.A most reasonable solution will be generated according to the current status of the scheduling units.Then,an evaluation method is designed to quantify the effectiveness of the suggested solution.A series of comparative experiments using the real industrial data are carried out.The results indicate that the proposed method achieves much higher scheduling accuracy and improves the efficiency of the BFG utilization.
This paper is organized as follows.In Section II,a practical scheduling problem in steel industry is described.And a causality diagram-based approach is proposed in Section III to deduce the scheduling solution.The proposed method is verified in Section IV by using the real data from a steel plant in China,and the related results with some analysis are addressed.Finally,Section V draws the conclusions for this study.
II.PROBLEM DESCRIPTION
In practice(the studied Shanghai Baosteel Co.Ltd,in China),a large amount of sensors acquire the energy real time data and transfer them into programmable logic control(PLC).And then,the data are stored into the real time database(iHistorianTM on-site),and are displayed with various time intervals on the supervisory control and data acquisition(SCADA)system.The running states of the energy units are monitored by the energy operators through SCADA system on-site.The BFG system in steel industry is very complex,and its balance status is mainly represented by the varying tendency of the gas tank level.Fig.1 shows the structure of the BFG system.Regarded as a kind of very important byproduct gas,BFG is generated from four blast furnaces,and its generation amounts can be up to 1800km3/h on average.The transportation system contains pressure stations,mixing devices and pipeline network,through which BFG can be transported to a number of consumption units,such as coke ovens,hot rolling and cold rolling.The surplus gas is stored in the two gas tanks,which are connected to the pipeline as buffer devices,and they always keep one connected to the pipeline,and the other standby at high tank level for emergent situation.Each of the blast furnaces is fed by four hot blast stoves.Due to the production requirements,the combustion status of them should be switched frequently.As the BFG consumption of one hot blast stove can be up to about 10km3/h,when the combustion status switches,there will be a drastic impact of the generated BFG on the whole gas system.Although the gas tanks can be treated as the buffer devices,the capacity of about only 60km3/h can hardly completely stabilize the gas fluctuation.
For the stability of the system,the trend of the gas tank level has to be maintained in the safety region.When the gas tank level is becoming out of the boundaries,the operators have to change the operational mode of some adjustable units so as to balance the generation and the consumption amounts of BFG.In this study,a typical example to describe the BFG scheduling problem can be briefly addressed as follows.Fig.2 shows the situation that the gas tank level has reached the upper boundary while the generation amount is continually higher than that of the consumption.In this case,the diffusing towers have to diffuse the excess gas if the scheduling operation is not carried out in time or correctly.
Thus,in order to ensure the efficient production,the scheduling operation must be performed ahead of time.Currently,the total scheduling amount and the corresponding scheduling units,which are referred to the tendency of the gas tank level and the difference amount between the gas generation and the consumption,are roughly determined by the operators.This may cause a large computational cost and uncompleted scheduling.
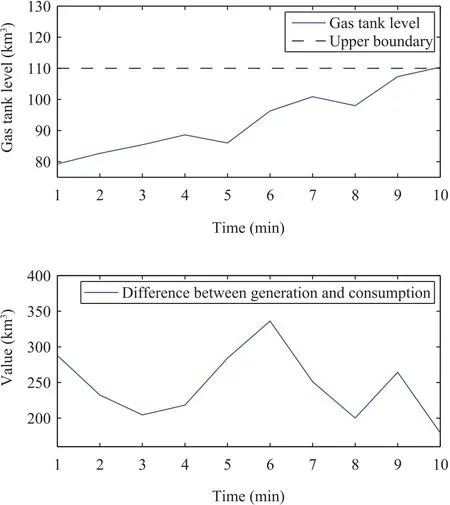
Fig.2. Condition that gas tank level has reached the upper boundary.
III.CAUSALITY DIAGRAM-BASED APPROACH
In this paper,a causality diagram-based approach is proposed.The algorithm flow is shown in Fig.3.
A.Causality Diagram-based Approach
In view of the fact that the scheduling of the BFG system should take the related factors(such as the current gas tank level and the flow difference between gas generation and consumption)into account,the causality diagram of the variables is established as shown in Fig.4.
In the causality diagram,y(t)denotes the current gas tank level,and the flow difference between gas generation and consumption(FDGGC)can be denoted byX=[x(t-θi+1),...,x(t)]Twheretis the current time andθidenotes the time span beforet.The gas tank level in the future is denoted byY=[y(t+1),...,y(t+θ2)]Twhereθ2denotes the time span of the tank level in the future,andZdenotes the corresponding scheduling solution.The probability of the gas tank level reaching the boundary which is represented byPadjustis described as

whereRsafe=[ε2,ε1]denotes the safety region,ε1andε2are the upper boundary and the lower one,respectively.The gas tank level has to be adjusted when the total probability is not 0.
B.Causal Fuzzy C-Means Algorithm
In the studied practical problem,it is highly possible that two different production conditions could lead to the same flow differences of the gas generation and the consumption,but different scheduling amounts.In contrast,the identical scheduling amounts could also correspond to somewhat various generation-consumption flow differences.In order to obtain the solutions,a causal fuzzy C-means(CFCM)clustering method is proposed,which combines the historical solutions with the corresponding production status.The minimal variance criterion is used as the objective function of the proposed clustering method.Assuming that there arenpatterns,andcclusters required,the optimization problem can be formulated by
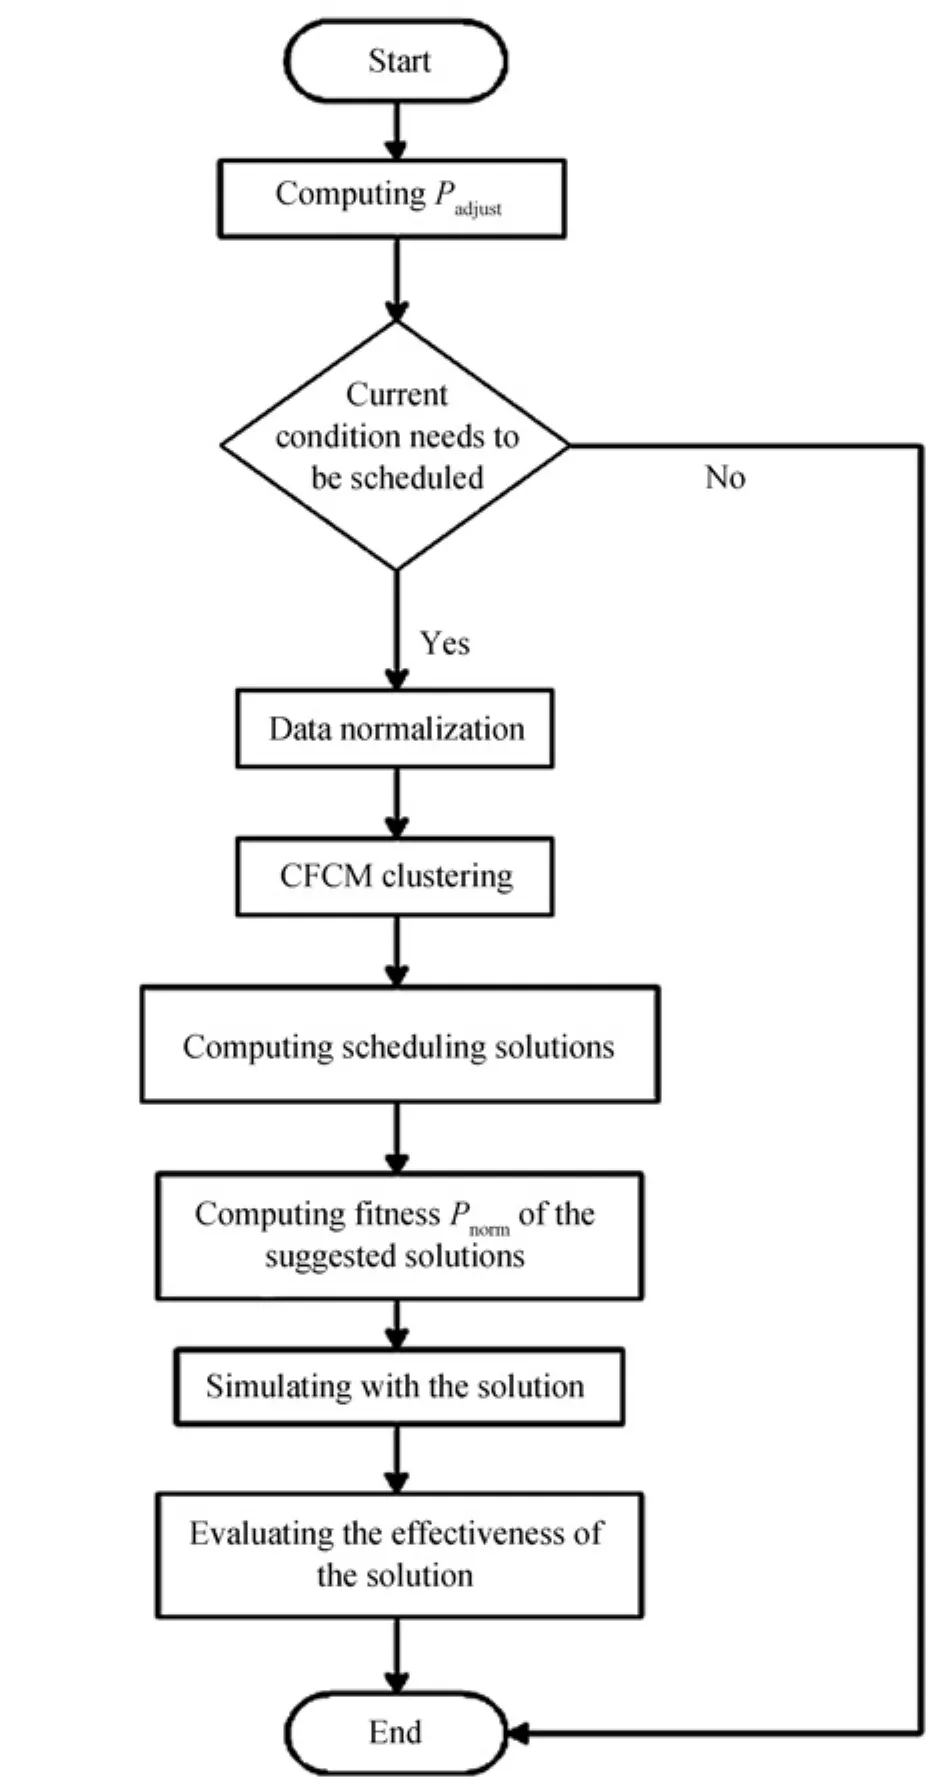
Fig.3.Algorithm flow of the proposed approach.

Fig.4.Causality diagram of the variables.

wheredij=‖vi-xj‖denotes the Euclidean distance between theith clustering center and thejth data sample,m∈[1,+∞)is the weighted index,w1andw2are the weights of the distances.ACEijis the average causal effect(ACE)between data samples and clustering centers which can be described by

where do(·)is Pearl’s do-operator andyiis the gas tank level inith cluster.Equation(3)provides the relationship between the production status of thejth historical solution and theith clustering,meanwhile measures the expectation differences of the gas tank level after being scheduled by the historical solution and the corresponding clustering center.LetDij=w1dij+w2ACEij,then the clustering centersviand the degree of membershipuijcan be expressed by
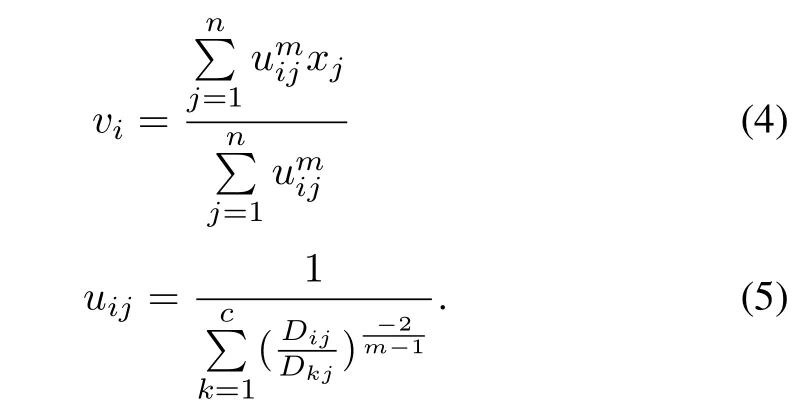
According to the causality principle,the historical total scheduling amount and the difference flow between gas generation and consumption are taken as the clustering variables,which are regarded as the inputs of the clustering.The outputs,i.e.,the clustering centers,correspond to the different production status.The center,whose gas flow difference is close to the current difference,is regarded as the key center,and the total scheduling amount of the center will be taken as the average value of the total amount of the current solution.The historical solutions that belong to the key center are recomposed as follows.
1)If the scheduling amount of one historical solution is close to the average total scheduling amount,then the historical solution is regarded as a suggested solution.
2)If the sum of the amounts of several historical solutions is close to the total scheduling amount,then the group of them is regarded as a suggested solution.
C.Causal Probability of Suggested Solution
The causal probability of each new solution can be computed by considering the running states of the scheduling units.DenotingPnormas the probability of each scheduling solution,we have

whereCrepresents all the new solutions.Equation(6)can be explained as the probability of the gas tank level back to the safety region with the intervention of the scheduling solutionZ.
D.Input Delay-based Least Square Support Vector Machine(LSSVM)for Scheduling Solution Verification
In this study,given the characteristic of the BFG system,an input delay-based LSSVM model is established to verify and evaluate the effectiveness of the proposed solution for the gas scheduling.
According to the causal relationship of the BFG system,one can designate the previous gas generation,consumption and the gas tank level as the most relevant factors of the current gas tank level.Therefore,the cumulative flow difference between gas generation and consumption in the previous moments and the previous gas tank level are taken as the inputs of the model,and the tank levels in the future are taken as the outputs.Letτ1andτ2be the input delay values of the flow difference between the gas generation and the consumptionX1and the previous tank levelX2,respectively.Ndenotes the sample length,and the training samples are constructed by

The regression model established in this paper can be formulated by

whereyis the gas tank level in the future,bis the bias,xjdenotes thejth factor of the inputs,mdenotes the number of the factors.The nonlinear mapping function and the weight of thejth factor are represented byφandwwj,respectively.The solving of the input delay-based LSSVM can be regarded as an optimization problem

whereγis a penalty coefficient,ndenotes the length of the sample andeijis the fitting error of thejth input.One has to solve the equations set as follows

whereKj=φ(xj)Tφ(xi)is the kernel function(usually Gaussian kernel function)of thejth factor,Iis annorder unit matrix and 1=[1,1,...,1]T.Then,we have the regression model

By repeating the process above,the gas tank levels in the future will be computed to verify the effectiveness of the scheduling solution.
E.Scheduling Evaluation
The effectiveness of the scheduling solution should be evaluated.The definition of the objective function is de fined as follows

whereGdrefers to the BFG diffusion andGgthe generation,Tsrefers to the moment needed to be scheduled andTpthe predicted length.In(13),both the rate of BFG diffusion in the next period of time and the frequency of the scheduling operation are considered.When the scheduling amount was not consumed by the scheduling units,the gas will be diffused,leading to a waste of energy and environment pollution.The smaller the value ofJobjis,the better the scheduling solution is.When the value ofJobjis 0,it means that there will be no diffusion and the gas tank level will be in the safety region in a period of time.
IV.EXPERIMENTS AND ANALYSIS
To verify the performance of the proposed method,the practical data obtained in April 2016 from a steel plant in China are employed for the experiments.In the experiments,both circumstances,approaching the lower boundary and the upper one,are considered.The scheduling units include#1-#4 power plants(PP)and low pressure boiler(LPB).The evaluation index mentioned in this paper is regarded as the judgment criteria of the scheduling solutions.
A.Approaching the Lower Boundary
The lower boundary of the gas tank is 60km3in this plant,and the solution has to be provided when the level is becoming lower than it.In this section,a typical practical situation is studied,in which the gas tank level is becoming lower than 60km3and the gas generation amount,meanwhile,is continually lower than the consumption amount.
Initially,one can computePadjustaccording to the current production status.In this situation,it equals to 0.4356,which means the scheduling is required.For the sake of calculating the total scheduling amount,the proposed CFCM is used for clustering all the 43 samples selected from the historical data.The number of clusters is 5,which is decided by expert knowledge.The clustering results based on CFCM and normal FCM are shown in Fig.5,whereXlabel is the flow difference between gas generation and consumption andYlabel is the total scheduling amounts.The value ofw1andw2are set to 0.7 and 0.3,respectively.
Comparing to the current situation with the clustering centers in Fig.5,the average value of the total amount is-100km3and-50km3respectively.The running states of the scheduling units are shown in Table I wheretrepresents the current moment.

Fig.5. Clustering results of the historical solutions.(a)Clustering result with CFCM.(b)Clustering result with normal FCM.
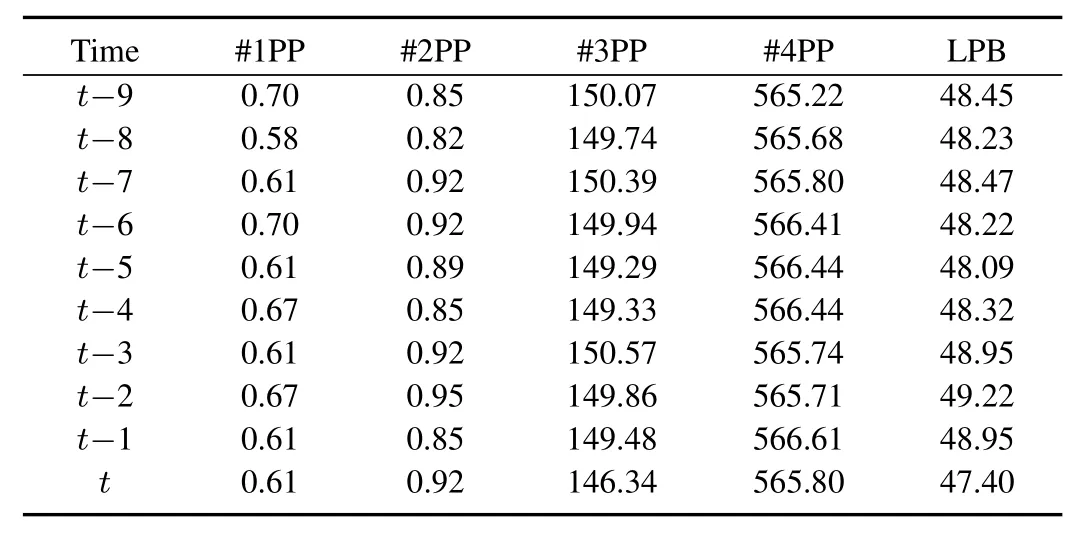
TABLE ICURRENT RUNNING STATES OF THE SCHEDULING UNITS
Table I shows that#1PP and#2PP are at stopping stage,therefore the maximal adjustment ranges of#1PP,#2PP and#3PP according to the operation load are 0km3,0km3,and-150km3respectively.In order to ensure the regular running of#4PP and LPB,the maximal adjustable range of them are-100km3and 0km3,respectively.Therefore,the new solutions with special scheduling units and the corresponding amount and the causal probability can be shown in Table II and Table III.
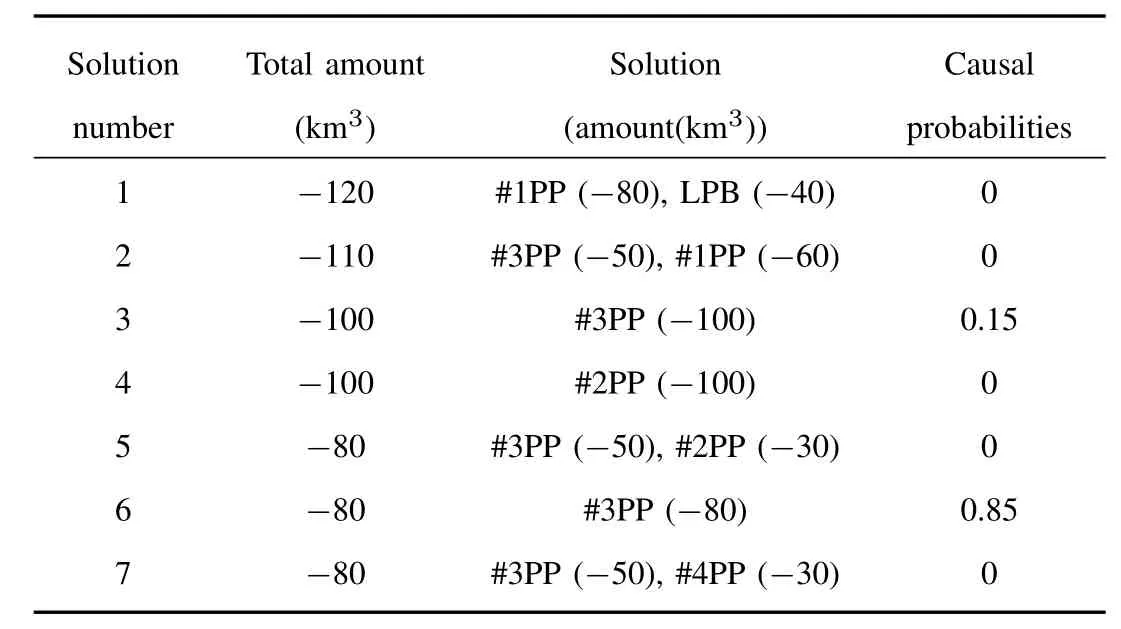
TABLE IISOLUTIONS OBTAINED BY CFCM

TABLE IIISOLUTIONS OBTAINED BY NORMAL FCM
According to Table II,the sixth solution is regarded to be the best one,while the fifth solution is the best in Table III.As to the human experience,the solution is to reduce the usage of#3PP for 50km3first,then reduce the usage of#4PP for 30km3after 10 minutes.The comparison of the results for 60 minutes in the future by the three methods,i.e.,the proposed one,the generic FCM and the human experiences applied in the current production is illustrated in Fig.6.The gas tank level can be pulled back to the safety region by the proposed method and can last for at least 60 minutes.The FCM based method can also pull the gas tank level back to the safety region,but it may lack stability.The human experience method results in a second operation due to the uncompleted scheduling in the first time,and the accuracy is apparently the lowest.The scheduling evaluation of the three methods are shown in Table IV.
In Table IV,we can see the evaluation result clearly.The proposed method makes the gas tank no diffusion and no second scheduling,while the other two methods contain second,even third operation in the next 60 minutes.
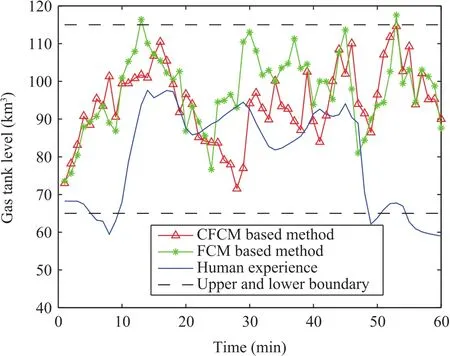
Fig.6. Comparison of the three scheduling solutions.

TABLE IVSCHEDULING EVALUATION OF THE THREE METHODS
B.Approaching the Upper Boundary
The upper boundary of the gas tank is 115km3.A typical situation is here studied,in which the tank level is becoming higher than the boundary and the gas generation,however,continually higher than the consumption.
As the value ofPadjustis above zero,the result of the two clustering methods using 54 historical samples is shown in Fig.7,where the average of the total amount is 95km3and the running states of the scheduling units are shown in Table V,wheretrepresents the current moment.
Table V lists that#1PP is at stopping stage,so the maximal adjusting ranges of the first three scheduling units are 60km3,0km3,50km3,respectively.In order to ensure the regular running of#4PP and LPB,the maximal adjustment range of them are 0km3and 50km3respectively.Therefore,the new solutions with special scheduling units,the corresponding amount and the causal probability are shown in Table VI and Table VII.
According to Table VI,the first solution is the best one,while in Table VII,the first solution is also the best one.The human experience is to increase the usage of#3PP for 50km3.The comparison of the results for 60 minutes in the future is shown in Fig.8 and the scheduling evaluation of the three methods is listed in Table VIII,where the proposed method makes the gas tank no diffusion and no second scheduling,while the FCM based method causes the level lower than the lower boundary.As compared to the human experience,the proposed method produces the scheduling amount in advance,which can prevent the gas tank level from going higher than the upper boundary.
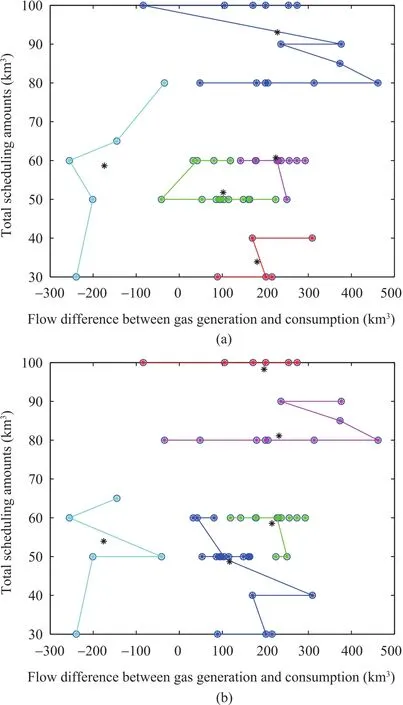
Fig.7. Clustering results of the historical solutions.(a)Clustering result with CFCM.(b)Clustering result with normal FCM.

TABLE VCURRENT RUNNING STATES OF THE SCHEDULING UNITS

TABLE VISOLUTIONS OBTAINED BYC FCM

TABLE VIISOLUTIONS OBTAINED BY NORMAL FCM
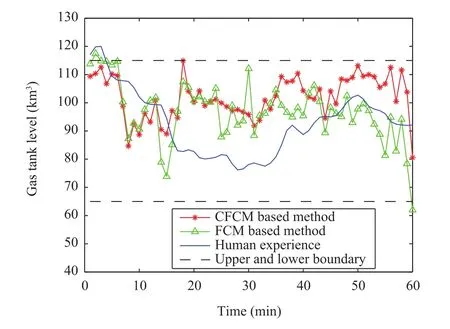
Fig.8. Comparison of the three scheduling solutions.

TABLE VIIISCHEDULING EVALUATION OF THE THREE METHODS
V.CONCLUSION
Considering that the scheduling solution is fairly critical in BFG system,a causality diagram-based scheduling approach is proposed in this study to provide the total scheduling amount and allocate it to the reasonable scheduling units.The proposed method takes the running states of the scheduling units into account to ensure the practicability of the suggested scheduling solution.An evaluation method is also proposed to evaluate all the suggested scheduling solutions.To verify the effectiveness of the proposed method,a set of experiments are conducted based on the real-world data from an iron and steel enterprise.The experimental results illustrate that the proposed method exhibits higher accuracy in comparison with the human experience based approach and provides an effective guidance for energy balancing.
[1]J.Zhao,W.Wang,K.Sun,and Y.Liu,“A Bayesian networks structure learning and reasoning-based byproduct gas scheduling in steel industry,”IEEE Trans.Automat.Sci.Eng.vol.11,no.4,pp.1149-1154,Oct.2014.
[2]X.P.Zhang,J.Zhao,W.Wang,L.Q.Cong,and W.M.Feng,“An optimal method for prediction and adjustment on byproduct gas holder in steel industry,”Expert Syst.Appl.,vol.38,no.4,pp.4588-4599,Apr.2011.
[3]J.Zhao,Q.L.Liu,W.Wang,W.Pedrycz,and L.Q.Cong,“Hybrid neural prediction and optimized adjustment for coke oven gas system in steel industry,”IEEE Trans.Neural Netw.Learn.Syst.,vol.23,no.3,pp.439-450,Mar.2012.
[4]H.N.Kong,E.S.Qi,S.G.He,and G.Li,“MILP model for plant-wide optimal by-product gas scheduling in iron and steel industry,”J.Iron Steel Res.Int.,vol.17,no.7,pp.34-37,Jul.2010.
[5]H.Ru,F.Gao,Y.F.Xu,and X.H.Guan,“Online strategy for scheduling
by-product gas supply,”inProc.2013 IEEE International Conference on Information and Automation(ICIA),Yinchuan,China,pp.1246-1251.
[6]J.C.Bezdek,Pattern Recognition with Fuzzy Objective Function Algorithms.New York,USA:Plenum Press,1981.
[7]J.Zhao,Z.Y.Han,W.Pedrycz,and W.Wang,“Granular model of long-term prediction for energy system in steel industry,”IEEE Trans.Cybern.,vol.46,no.2,pp.388-400,Feb.2016.
[8]H.B.Cao,H.W.Deng,and Y.P.Wang,“Segmentation of M-FISH images for improved classification of chromosomes with an adaptive fuzzy C-means clustering algorithm,”IEEE Trans.Fuzzy Syst.,vol.20,no.1,pp.1-8,Feb.2012.
[9]X.Y.Tang,J.Zhao,C.Y.Sheng,and W.Wang,“Long term prediction for generation amount of Converter gas based on steelmaking production status estimation,”inProc.2014 IEEE International Conference on Fuzzy Systems(FUZZ-IEEE),Beijing,China,pp.1088-1095.
[10]J.Pearl,Causality:Models,Reasoning,and Inference.Cambridge,UK:MIT Press,2000.
[11]M.Erwig,and E.Walkingshaw,“Causal reasoning with neuron diagrams,”inProc.2010 IEEE Symposium on Visual Languages and Human-Centric Computing(VL/HCC),Leganes,Philippines,2010,pp.101-108.
[12]F.Thoemmes and K.Mohan,“Graphical representation of missing data problems,”Struct.Equat.Model.,vol.22,no.4,pp.631-642,2015.
[13]K.Mohan and J.Pearl,“Graphical models for recovering probabilistic and causal queries from missing data,”inProc.27th International Conference on Neural Information Processing Systems,Montreal,Canada,2014,pp.1520-1528.
[14]H.H.Dai,S.Keble-Johnston,and M.Gan,“Reliable knowledge discovery with a minimal causal model inducer,”inProc.2012 IEEE 12th International Conference on Data Mining Workshops(ICDMW),Brussels,Belgium,pp.629-634.
[15]F.M.Chen and D.Zhang,“Combining a causal effect criterion for evaluation of facial attractiveness models,”Neurocomputing,vol.177,pp.98-109,Feb.2016.
杂志排行
IEEE/CAA Journal of Automatica Sinica的其它文章
- Decomposition Methods for Manufacturing System Scheduling:A Survey
- Nonlinear Bayesian Estimation:From Kalman Filtering to a Broader Horizon
- Vehicle Dynamic State Estimation:State of the Art Schemes and Perspectives
- Coordinated Control Architecture for Motion Management in ADAS Systems
- An Online Fault Detection Model and Strategies Based on SVM-Grid in Clouds
- An Adaptive RBF Neural Network Control Method for a Class of Nonlinear Systems
