Durability related environmental zonation and design methodology for marine RC structures
2018-04-12WuHairongQingfangJinWeiliang
Wu Hairong Lü Qingfang Jin Weiliang
(1Institute of Structural Engineering, Zhejiang University, Hangzhou 310058, China)(2School of Civil and Transportation Engineering, Henan University of Urban Construction, Pingdingshan 467036, China)(3School of Civil Engineering, Southeast University, Nanjing 210096, China)
Among all of the durability deterioration mechanisms in RC structures, corrosion of the reinforcing steel bar embedded in concrete is one of the most serious deterioration mechanisms.At the initial state of corrosion, the rebar corrosion rate may exhibit at a steady rate[1], and then, the expansion of the iron rust layer will lead to the surface cracking and subsequently spalling over the cover concrete.As a result, the service life of RC structures will be significantly reduced.Environmental factors, such as the temperature, humidity, precipitation, wind (direction, force and speed), and density of erosion medium on the exposed surface, are all relevant to the durability of reinforced concrete structures[2-3].
Different working environmental classifications have been introduced into some durability design specifications and standards[4-5].These qualitative and experience-based design methods lack quantitative indices and evaluations.As a consequence, the environmental action level chosen for a same target project may be different by different engineers even in a same real case.Thus, it is necessary to establish a quantitative-based durability design method as guidelines for concrete structures.
The basic concept of quantitative-based concrete durability design, durability zonation (DZ), for the design of concrete structures was first proposed in 2005[6].Basic principles for durability zonation standard (DZS)and methodology of the durability environmental zonation standard (DEZS)were further developed and applied in several projects[6-10].Also, other relevant attempts were made on environmental regionalization or classification for concrete structures[11-13].However, the quantification of environmental factors, the effects of material parameters on concrete durability, the performance degradation prediction models, the zonation indices and the design method in accordance with the established zonation need further discussion.
For RC structures exposed to marine environments, chloride penetration is a complex phenomenon, involving various factors such as the diffusion of chloride ions and the movement of chloride ions due to permeation of water into concrete[14].It has been commonly recognized that the working environment can be divided into four regions: atmospheric zone, splash zone, tidal zone and underwater zone.However, only qualitative descriptions for environmental conditions and chloride ions penetration mechanisms are given for each zone[2,4,15], and the quantitative relationship between external environmental actions on the structures and altitudes or other dominant environment indices have not been reported.Many previous investigations have been attempted on the durability of RC structures to predict the service life and give suggestions for the durability design[11,16-17], but these works have been generally limited to a particular problem, especially focusing on one specific zone (splash, tidal, submerged or atmospheric), and lacking consideration for the environmental spatial continuity.The objective of this paper is to present a quantitative-based durability design methodology associated with environmental zonation considering the spatial continuity.The methodology can be used to guide engineering practice and ease the structural design for structures exposed to marine environments.
1 Data and Method
1.1 Experimental work
To evaluate the variation of chloride ions penetration into concrete in the marine environment, field detection was performed in Zhapu Port of Jiaxing City, which is located in Zhejiang province, the eastern coast of China.
Zhapu Port belongs to a typical subtropical monsoon climate, with clear distinctions between the four seasons.The environmental characterisation comprises of meteorological and hydrological characteristic data(see Tab.1).The data was collected by the headquarters of the Hangzhou Bay Cross-Sea Bridge.The temperature shows a large variation with a difference of 24.1 ℃ between the average temperature of July and January.The relative humidity stays high, ranging from 79% to 85%.The wind direction is remarkably different in summer (SE)from that in winter (NW), and there are obvious seasonal variations in precipitation.
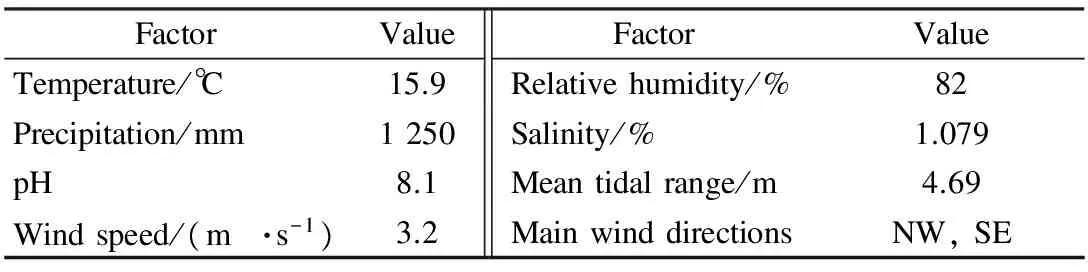
Tab.1 Annual average values of environmental factors
The experimental work of field detection consists of two parts.The first one focused on studying the distribution of chloride penetration in concrete considering the spatial continuity in the vertical direction and the second concentrated on the probability characteristics and the variation of relevant parameters.For the first part, two concrete walls were chosen to be detected with a 0.5 m interval in an altitude from+1.30 to+5.80 m (see Fig.1), respectively, in Berth 2 of the first phase project (denoted as BN1-2)and Berth 1 of the second phase project (denoted as BN2-1), where the altitude was based on the Wusong Height data.For the second part, specific points were detected and a series of chloride profiles were obtained in different altitudes for+2.3, +5.25 and +7.6 m (roughly located in splash, tidal or atmospheric zones divided by the Industry Standard of China JTJ 275—2000[15])from BN1-2, BN2-1, Berth 4 of the second phase project (denoted as BN2-4)and Berth 1 of the third phase project (denoted as BN3-1).
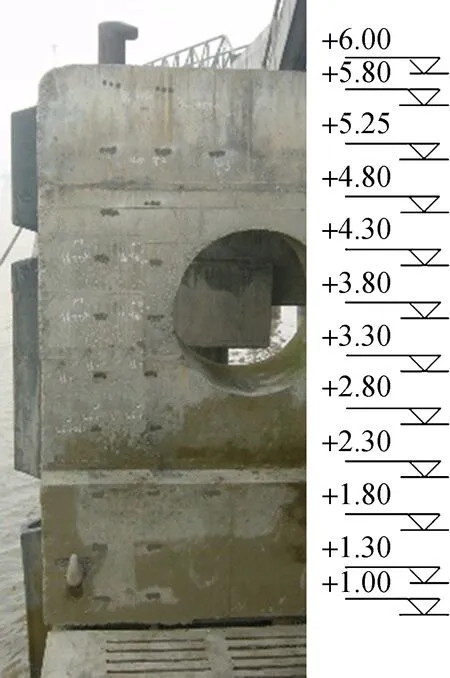
(a)
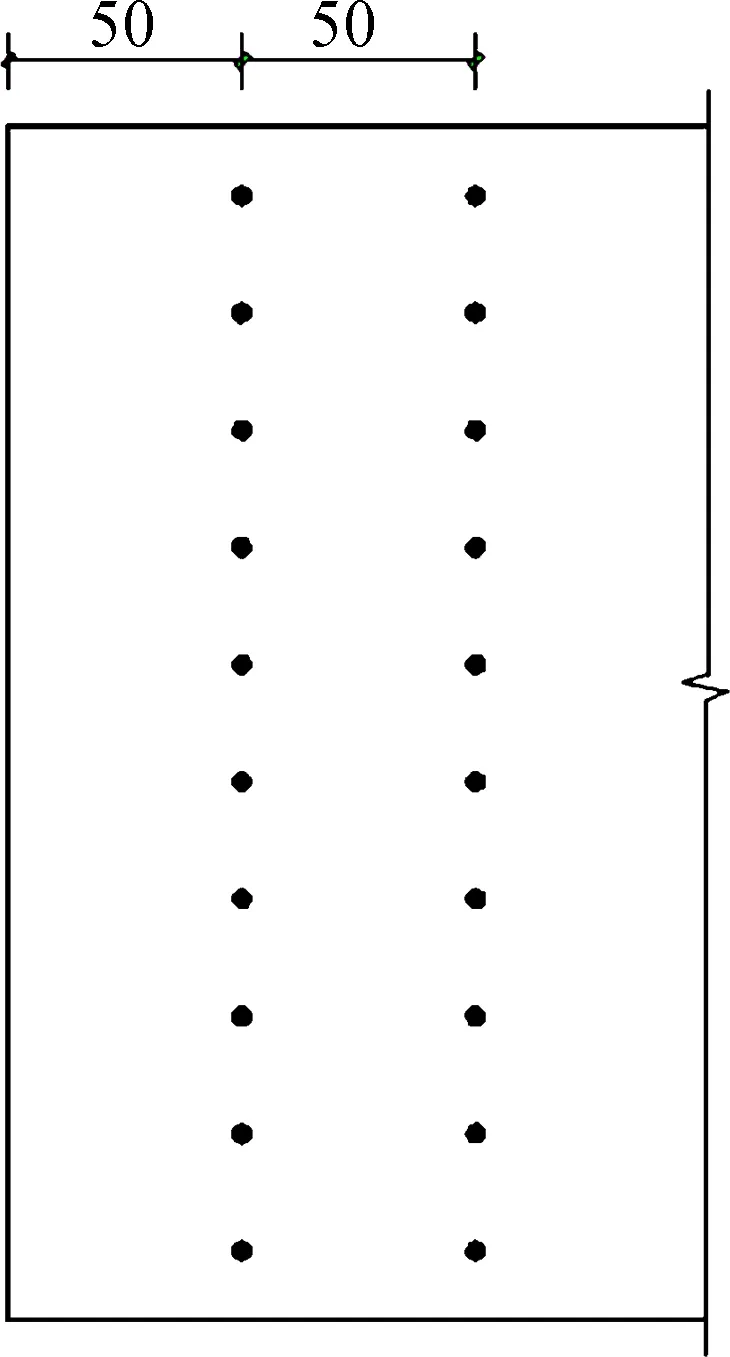
(b)
1.2 Chloride ion concentration in concrete
This paper focused on the methodology of concrete durability design, and therefore only the water/binder ratio of concrete mixtures was discussed, which was a key mix proportion parameter.Five concrete mixes (0.45, 0.40, 0.55, 0.52 and, 0.48)were used in the investigation corresponding to BN1-2, BN2-1, BN2-4, BN3-1 (+7.6 m)and BN3-1 (+2.3 and+5.25 m), respectively.
Concrete powder samples were extracted in situ from the predetermined measuring points of each berth to obtain the chloride profiles through drilling by percussion drill.Considering the exposure location and time, the sampling depths were determined as follows: for BN1-2 and BN2-1, the drilling depth is determined to be 70 mm with an interval of 7 mm; for BN 3-1 and BN2-4, the drilling depth is determined to be 50 mm with an interval of 5 mm.In addition, the samples of measuring points at an altitude of +7.6 m, where the degree of exposure environmental action is relatively low, were all taken up to 50 mm with an interval of 5 mm.For each sample, the amount of the water-soluble chloride ion concentration was determined by a RCT (rapid chloride test)instrument in the laboratory following a procedure similar to that in ASTM C 1218[18].
2 Results and Discussion
2.1 Chloride profiles
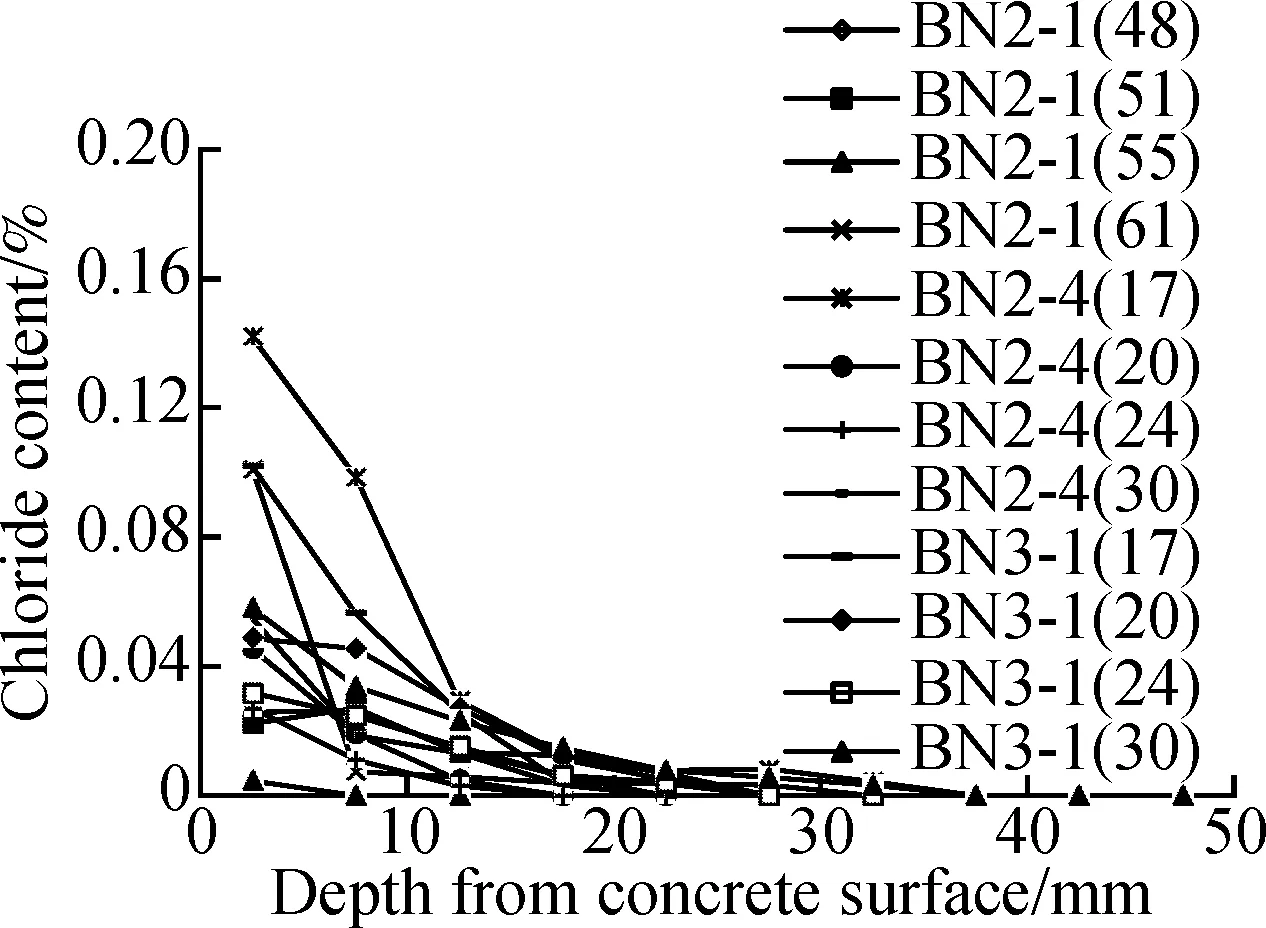
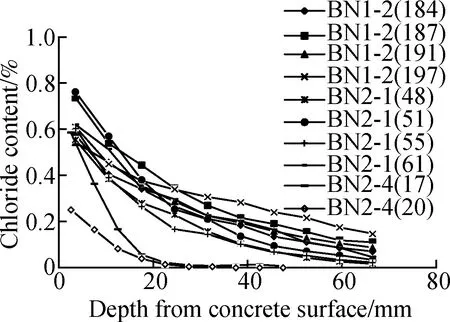
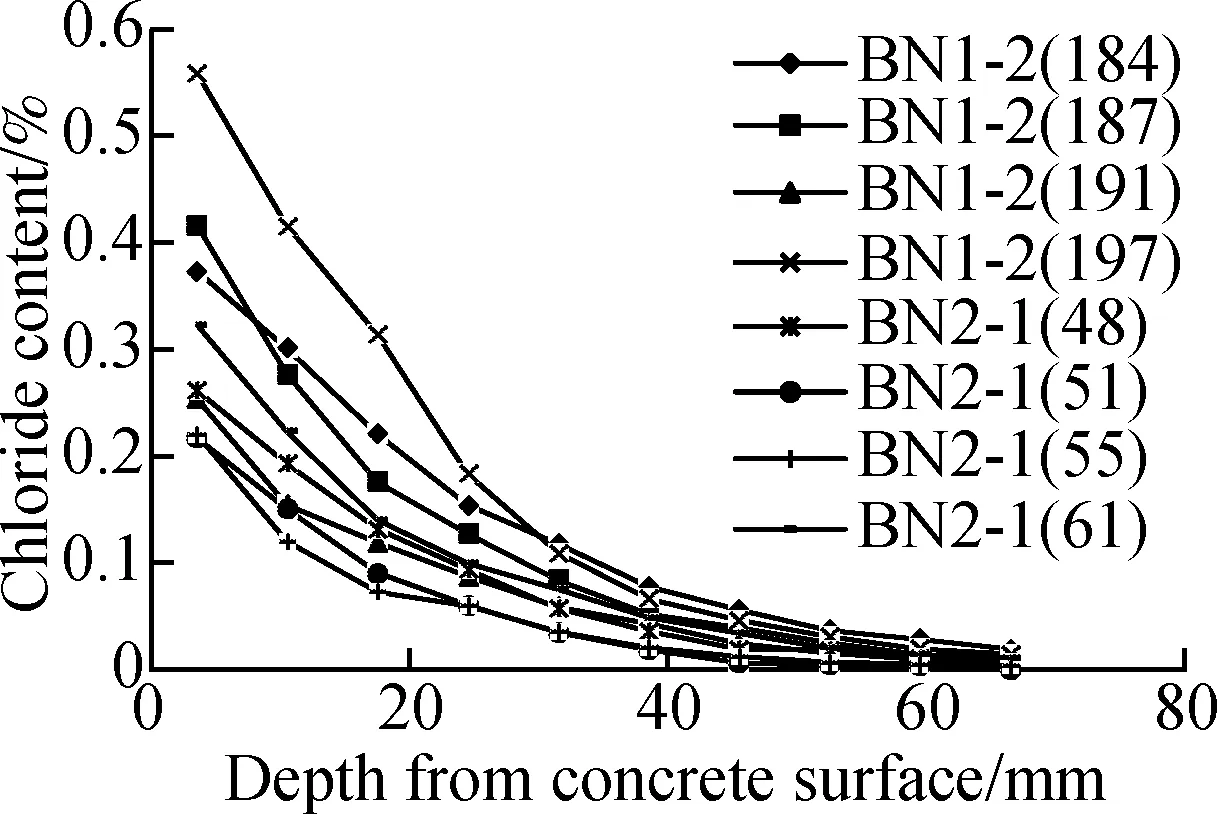
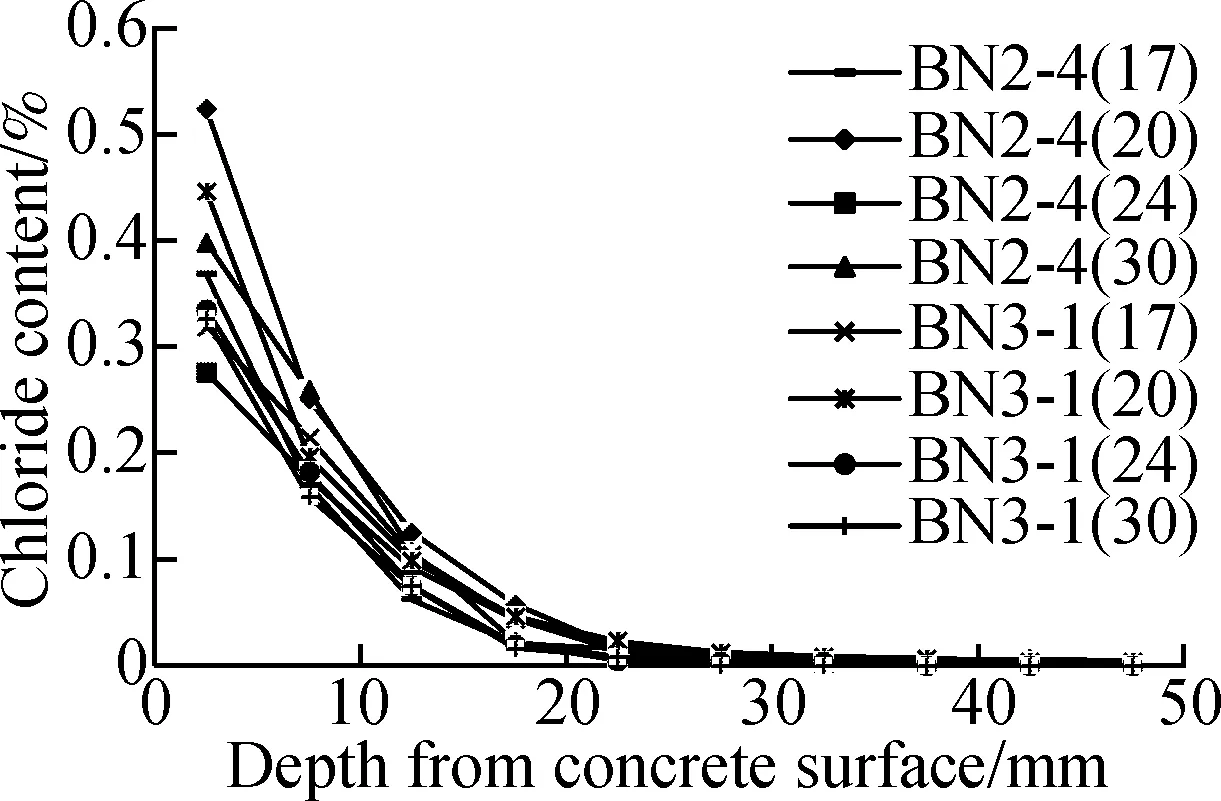
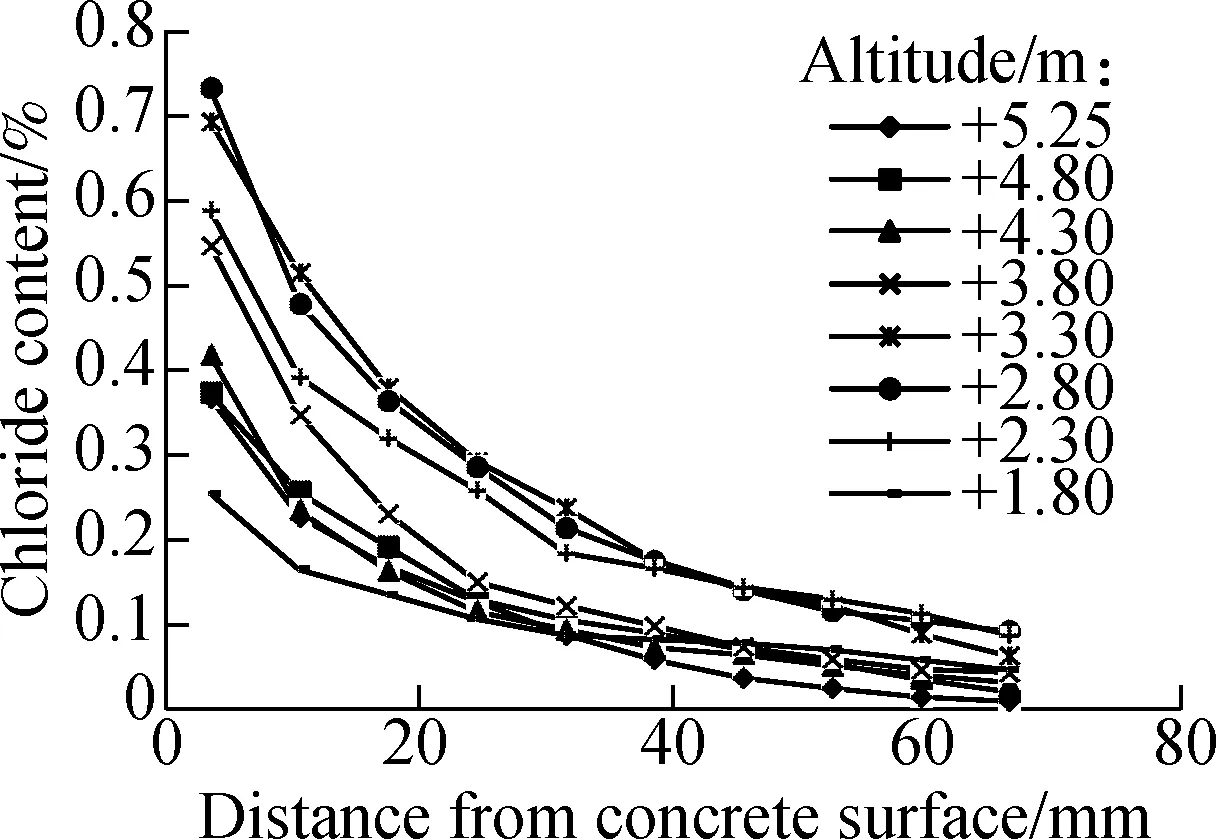
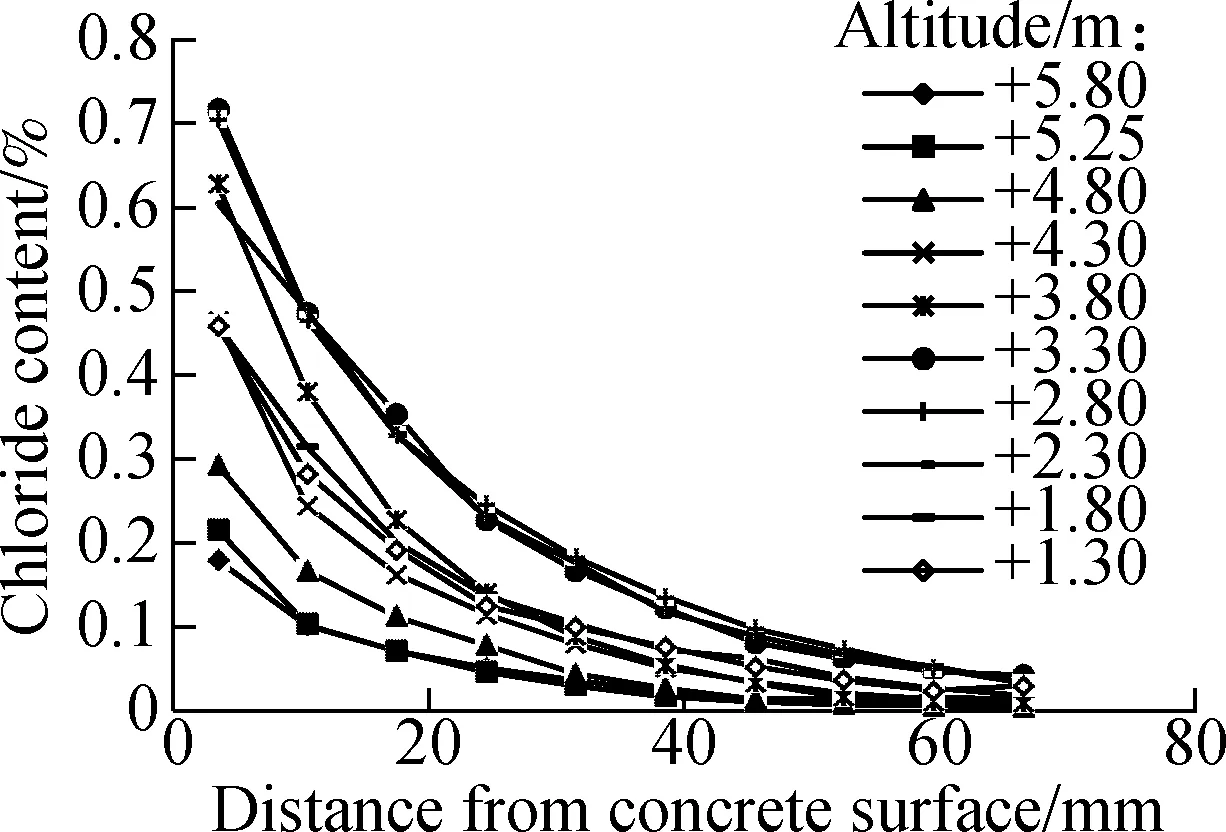
After field detection, more than 200 chloride profiles were obtained and analyzed.The chloride ion concentration profiles are shown in Fig.2, in which the data of each profile are the corresponding mean values with the same exposure time and altitude of each berth.Therefore, each profile in Fig.2 is the “mean curve” of 2 to 8 detected profiles.The number in the brackets of the legends in Figs.2(a)to (d)represents the exposure time (in month)till the detection.
A clear variation of chloride penetration into concrete over altitude is observed.The surface chloride ion concentration of concrete and chloride ion concentration in the same depth from the concrete surface increase with the increase of the altitude and reach the maximum value when the altitude is located between +2.8 and +3.8 m, and then decrease (see Figs.2(e)and (f)).
The influence of exposure time can be clearly seen between different berths.Chloride penetration depth and content in concrete of BN1-2 (about 70-80 mm)are larger than that of BN2-1 (about 40-60 mm)under a shorter exposure time, and are much larger than that of BN2-4 (less than 20 mm)with a higher water/binder ratio but a relatively short time of exposure (see Fig.2(b)).Similar phenomena can be seen in Fig.2(c).As a validation, the chloride penetration depths and contents in concrete of BN2-4 and BN3-1, which have the same exposure and similar water/binder ratio, show very little difference between each other (see Fig.2(d)).
(a)
(b)
(c)
(d)
(e)
(f)
Figs.2(a),(c)to (f)show that the water/binder ratio plays an important role in concrete surface chloride ion concentration when the altitude is above+4.8 m.The accumulation rate of surface chloride ion concentration in concrete increases with the increase in the water/binder ratio (see Fig.2(a)and (c)), and is proportional to the water/binder ratio when the surface chloride ion concentration comes up to a stable value (exposure for a relatively long time, see Fig.2(c)).
Generally, diffusion due to a concentration gradient, which is usually described by Fick’s second law, is considered to be the primary mechanism.A typical error function solution of Fick’s second law[19]is commonly introduced to analyze the chloride profiles in order to obtain the surface chloride ion concentration and the diffusion coefficient, which are regarded as constants with time and independent variables.Considering the differences between real conditions in engineering and theoretical hypothesis in the solution of Fick’s second law for chloride ingress into concrete[11], ignoring the initial chloride ion concentration in concrete as it is usually very low, an expression used in this paper is defined as
(1)
whereC(x,t)is the chloride ion concentration at the depthxfrom the concrete surface with exposure timet;Csnis the nominal surface chloride ion concentration;Dais the apparent diffusion coefficient; and erf( ·)is the error function.
In Eq.(1),CsnandDaare obtained by performing a nonlinear regression of Eq.(1)according to the experimental data, which are not the real values at the timetbut the equivalent average values during the time interval oft.Consequently, the obtainedCsnandDacan be directly substituted into Eq.(1)to calculate the chloride ion concentration at a certain depthxat the corresponding exposure timetwhich can avoid complex calculations such as integral when considering the time dependence of diffusion coefficient.
The values ofCsnandDainvolved in the following parameter analysis are obtained by fitting about 200 chloride profiles using Eq.(1).
2.2 Nominal surface chloride ion concentration Csn
The influence of factors (exposure time, water/binder ratio, environment, etc.)on the surface chloride ion concentration of concrete at different locations is very complicated.The water/binder ratios of the berths are between 0.40 and 0.55, and the amount of detected data of BN1-2 with the longest exposure time (about 15 years)and a water/binder ratio of 0.45 is the largest.The maximum values of regulations for the requirements of the water/binder ratio in the durability design codes[20-21]are generally between 0.40 and 0.45.The surface chloride ion concentration of concrete accumulating up to a stable value has a linear relationship with the water/binder ratio of concrete[4,22].Taking the above mentioned into account, differences of mix proportion and exposure time in detection points are not considered in the analysis of concrete surface chloride ion concentration, which is assumed to be stable and constant in the following analysis.
2.2.1Relationship between Csnand altitude
Fig.3 presents the relationship betweenCsnand the corresponding detection altitudeh, where each data point represents the mean value of the corresponding results in the same altitude of BN1-2 and BN2-1.A single peak Gaussian distribution with a tendency of “decrease-increase-decrease” can be observed in Fig.3, which can be expressed as
(2)
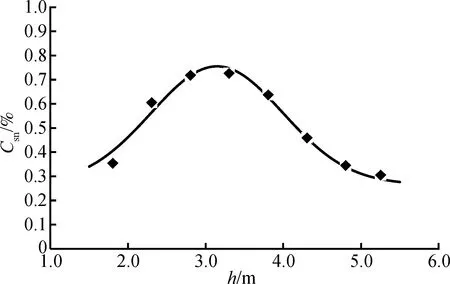
Fig.3 Relationship between nominal surface chloride concentration Csn and the corresponding detection altitude h
2.2.2Probability characteristic of Csn
A statistical analysis is conducted on data ofCsnrelated to the second part of the experimental work.A large scatter of the analyzed data is observed at the altitude+7.6 m which should be located at the atmospheric zone and has a small amount of data.The range of variation coefficient is from 0.28 to 0.41 (Only data at altitude +2.3 m and+5.25 m is considered).The result shows thatCsncan be considered to obey a log-normal distribution.The statistical distribution ofCsnis thus defined as follows: Log-normal distribution with a variation coefficientδ=0.40.
2.3 Apparent diffusion coefficient Da
Darepresents the equivalent mean value of the chloride diffusion coefficient during the time period from initial exposure to detection.It has been generally recognized thatDais a time-dependent variable and decreases with time due to the development of cement hydration, the reduction of pore distribution, the swelling of cement paste, the pore blocking effect due to chloride ingress, and the reaction of hydration products with chloride ions.The relationship betweenDaand exposure time can be described as[11,16,23]
(3)
whereDaandD0are the corresponding apparent diffusion coefficients at exposure timetandt0, respectively;nis the age exponent related to concrete mixes and environmental conditions.Regardingt0as a standard reference time,Dacan be obtained by Eq.(3)whenD0is known.In practice, the reference timet0is commonly regarded as 28 d or 1 year.
2.3.1Influence of environmental factors on Da
Focusing on the reaction between concrete materials and environmental conditions, many standardization studies on test methods for corroded concrete have been accomplished[22,24]to establish the influence law and correlation equations corresponding to different materials and environments.Based on the study results[22], the coefficients of environmental temperaturekTand chloride ion concentrationkClcan be expressed as
kCl=3.48-1.20CCl1/3
(4)
(5)
whereCClis the chloride ion concentration of the environmental solution, %;Tis the environmental temperature, K.
2.3.2Determination of D0at reference time t0
The reference apparent diffusion coefficientD0is generally determined by the analysis of original detection data or by experience.In this paper, the reference timet0is regarded as 28 d.D28was determined referring to only experimental data tested following the procedure similar to the regulations in NT Build 443(Concrete, hardened: Accelerated chloride penetration)[25]of North Europe.Published data on the relationship between apparent diffusion coefficient and water/cement ratio were collected for OPC based concrete.Fig.4 shows the relationship betweenD28and the water/binder ratiow/b, which is converted into equivalent values under a standard reference environmental condition at 20 ℃ and a concentration of (165±1)g/dm3NaCl solution using Eq.(4)and Eq.(5).As a comparison, the relationship between the chloride migration coefficientDRCM,28andw/b, suggested by LIFECON[11], is also presented in Fig.4.It can be seen that the converted results of different environmental conditions at laboratory and natural environment have a good agreement with each other, which indicates thatkTandkClare reasonably determined.The suggested relationship betweenDRCM,28andw/bin Life-365[23]is basically larger than the other data sets and can be regarded as the conservative values.Also, a good correlation is shown betweenD28andDRCM,28, which indicates that the value of the migration coefficient can be used as a substitute when the apparent coefficient is not available and the reference timet0is relatively short, e.g.28 d.
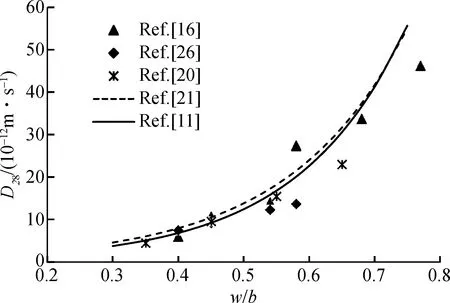
Fig.4 Relationship between D28 and water/binder ratio w/b
For security and conservative concerns, the suggested curve ofD28andw/bin Life-365[23]is introduced as
D28=10-12.06+2.4w/b
(6)
2.3.3Age exponent n
Age exponentnis an empirical coefficient related to concrete mixes and environmental conditions.It is an important factor of the decay rate of the concrete diffusion coefficient.Under the same environmental condition, the resistance of concrete to chloride ingression decreases largely with the decrease ofn.
Based on the obtained chloride profiles and the related environmental conditions of BN1-2 (longest exposure duration, OPC-based concrete with water/binder ratio 0.45), age exponentncan be obtained by Eq.(3)with the values ofDa(obtained by fitting the standard numerical solutions of Fick’s second Law)andD0(calculated by Eqs.(4)to (6)).Fig.5 shows five curves to represent the relationship betweennand altitudeh, in which each curve is the “average curve” of the corresponding detected data at the same detection conditions (altitude and exposure time).An increasing trend ofncan be seen with the increase of altitude.By taking the value at+2.3 m as reference (denoted asnref),the relationship betweennand the altitudeh, which is the mean value of the corresponding results in Fig.5, can be found:
n=nrefknh=0.46·(0.8e0.1h)=0.368e0.1hh>2.3 m
(7)
whereknhis the influence coefficient of altitudehto the age exponentn.

Fig.5 Relationship between age exponent n and altitude h
In Fig.5, it can be seen that the values ofnat +1.8 m and +2.3 m are similar except the curve at 197 months.Therefore,ndecays with the decrease ofhaccording to Eq.(7)untilhreaches +2.3 m, and thennis assumed to be a constant with the decrease ofh.
Statistical analysis ofnis done with the data of the second part of the experimental work.nat different altitudes can all be considered to obey a log-normal distribution, with a range of variation coefficient from 0.12 to 0.34.The statistical distribution ofnis thus defined as follows: Log-normal distribution with variation coefficientδ=0.30.
The relationships betweennand the water/binder ratio of concrete have been reported in some literature.The value ofnis regarded as a constant in Duracrete[4]and Life-365[23], but considered to increase with the increase of the water/binder ratio by Jin[27]and Mangat et al[16].Also, the value ofndecreasing with the increase of the water/binder ratio is reported in Ref.[28].The influence of other parameters of concrete mixes, such as content of cementitious material and type of cementitious material, on the value ofnis involved in Refs.[4,23,27].Therefore, there is no agreement on the relationship betweennand concrete mixes.Thus, the influence of concrete mixes is not considered in this paper.However, a conservative approach is to considernas a constant.
2.4 Probability-based prediction method
Safety, serviceability and durability of concrete structures are the key issues in the reliability analysis and design.How to identify the relevant limit states and reliability index for the durability of RC structures are the prerequisites for the probabilistic method based durability prediction.
Considering that the limit state relevant to structural design generally does not account for the crack stage of components, the durability limit state for concrete structures under chloride ingression is identified as chloride ion concentration in concrete at the surface of the rebar reaching the critical chloride ion concentrationCcr[29]:
pf=p(C(x=dcover)-Ccr≥0)≤Φ(-β)
(8)
wherepfis the failure probability;C(x=dcover)is the chloride ion concentration at the depthxanddcoveris the reinforcement protection layer thickness of concrete;βis the reliability index.
The durability limit state is usually identified according to the requirements for serviceability and reparability of structures.It is similar to the method for determining the limit state of serviceability, but the two limit states are essentially different[30].According to Lay et al.[11], for the durability design, the value ofβ=1.5 is accepted.Durable life with 95% confidence is predicted in actual conditions.
The critical chloride ion concentrationCcrrefers to the chloride ion concentration in concrete at the surface of reinforcing steel required to initiate corrosion.There is no identifiable concentration of chloride ion to initiate corrosion.According to the relevant results presented in Refs.[11,23,31-32], theCcrvalue selected is 0.15% chloride ions by weight of concrete, which is a conservative estimate.The probability characteristic ofCcris defined as: Log-normal distribution with variation coefficientδ=0.20.
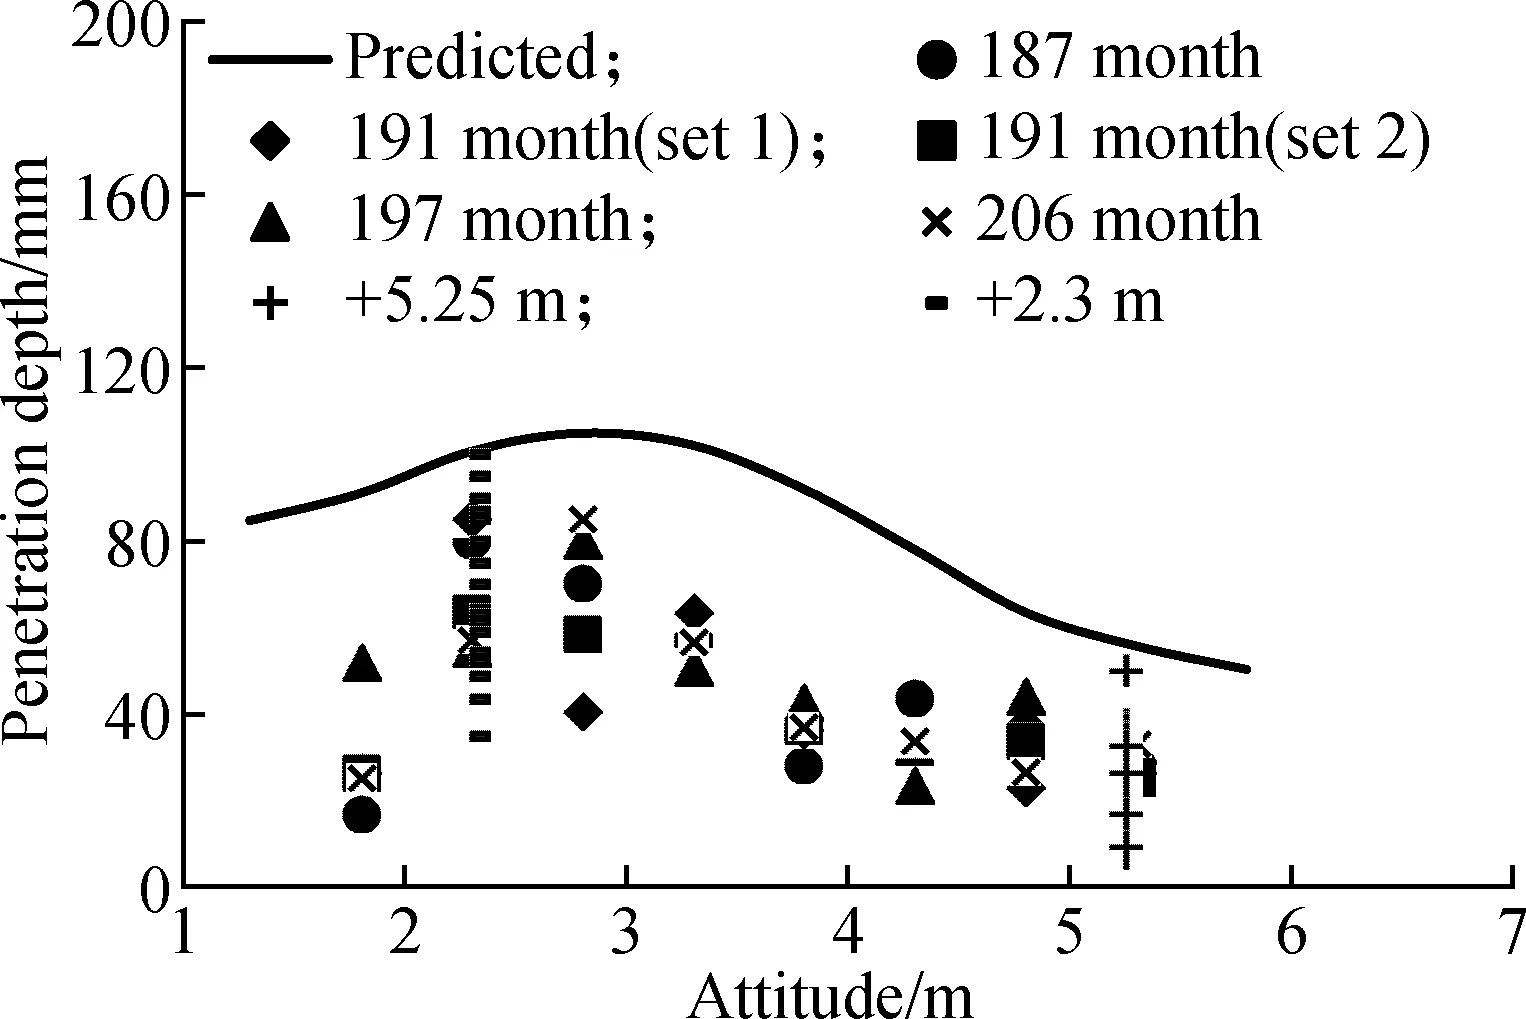
With the associated parameter analysis, based on Eqs.(1)and (8), the calculated results of chloride penetration depth at different altitudes and the corresponding detected values of BN 1-2 and BN 2-1 are shown in Fig.6.The reference demarcation point of chloride ion concentration is considered to be 0.1% by the weight of concrete for convenience of the determination of detected chloride penetration depth.The changing trend of chloride ion concentration with the altitude can be well reflected by the predicted curve which is on the safe side.
(a)
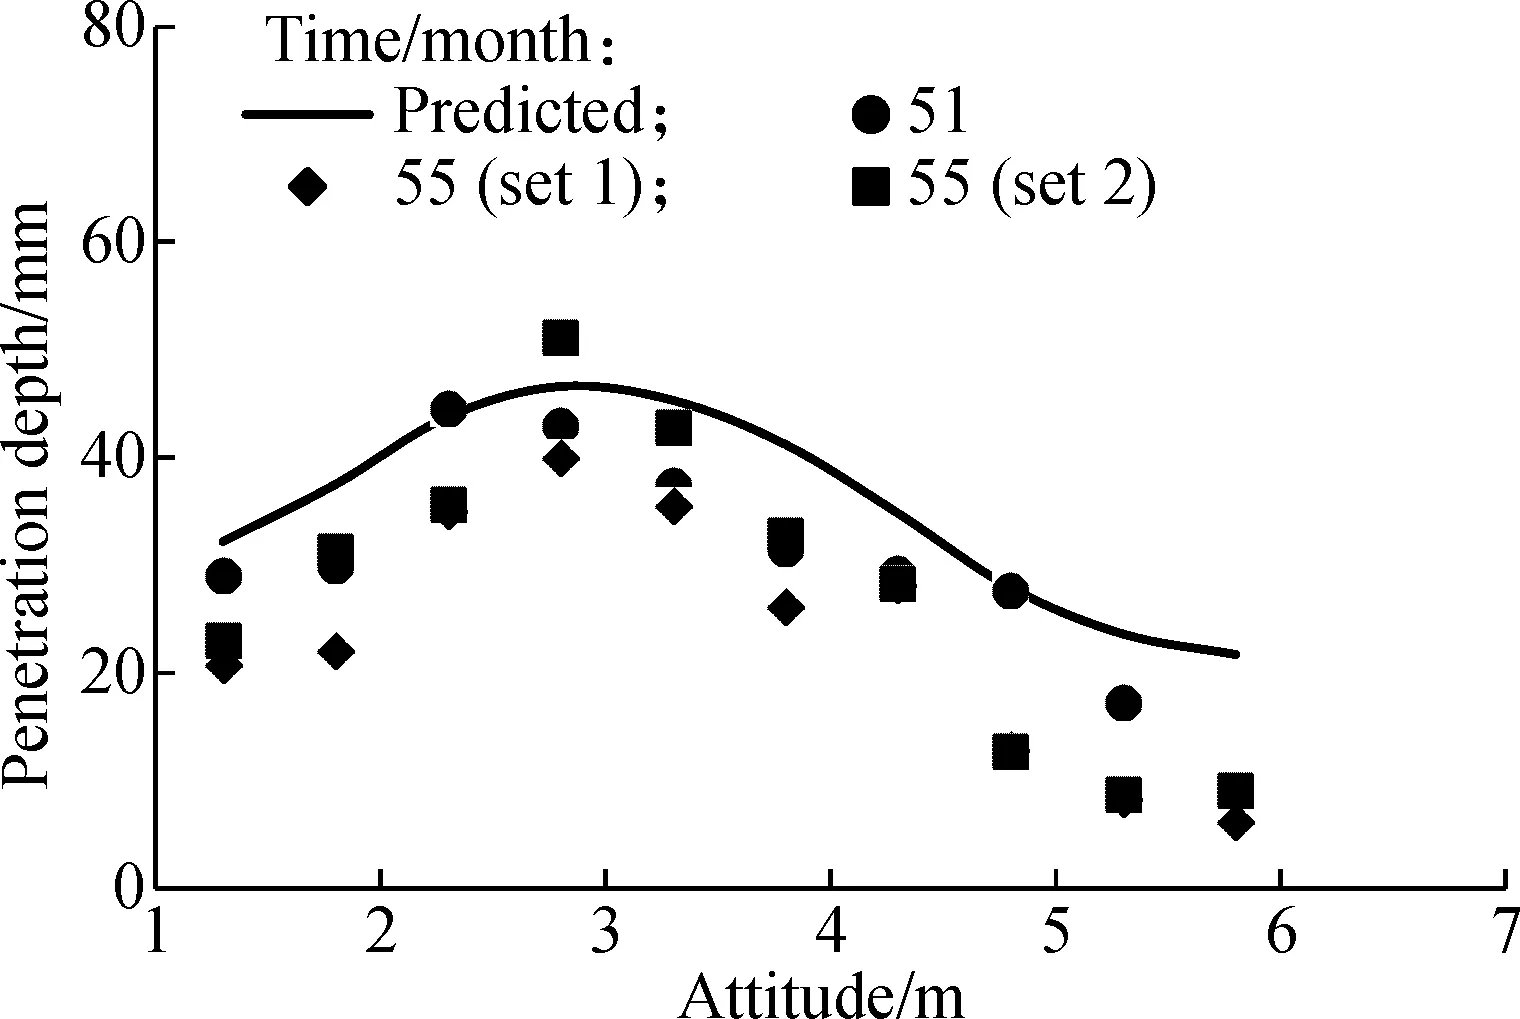
(b)
3 Durability Design Methodology
The design methodology for chloride penetration induced durability under the marine environment is developed based on the research work of DEZ by Jin et al[6-7].Focusing on the interaction between the external environmental action and the resistance of concrete structures, research on DEZ of concrete structures can be divided into two parts: 1)The environmental zonation according to the effects of environments on the durability of concrete structures, and 2)Suggested regulations of materials and constructions for each zone meeting the durability limit states and the corresponding reliability index.By combining the two parts, the durability design zonation standard can be established, which can be used as guidelines for the durability design in the lifecycle.
3.1 Environmental zonation
3.1.1Choose of zonation index
The index for environmental zonation related to concrete structural durability should not only represent the characteristics of the environments but also the changing law of concrete structural durability with the change of exposure environments.
The distribution of chloride penetration into concrete along altitude is determined by the law of environmental factors changing along the altitude.The ratio of the wetting time per-periodkJRis proposed and defined as the time proportion of concrete in wet conditions for the whole time period, and it can be used to describe the dry-wet conditions in concrete.Analysis on the in-situ detected results of Zhapu Port shows that the penetration of chloride, the accumulation of surface chloride concentration, and the decay of the chloride diffusion coefficient are all related tokJR[33].
Therefore, the ratio of the wetting time per-periodkJRin concrete is the essential reflection of the environmental characteristics.It is a dominant environmental factor influencing the chloride penetration and is determined as a common index in different coastal areas.
The calculation ofkJRat each altitude should refer to the tide level records within a relatively long period by statistical tests.The detailed method can be referred to in Ref.[33].
3.1.2Index-based environmental zonation
According to the achieved models Eq.(1), Eq.(8)and the corresponding parameter analysis, chloride penetration depth(or concrete cover depth)X50meeting the given limit state and target reliability index are calculated for the virtual specimen (defined as OPC-based concrete with a water/cement ratio of 0.45)exposed for 50 years under natural environments in Zhapu Port (see Tab.1)by means of the Monte-Carlo simulation.The statistical distribution of the thickness of concrete cover is assumed to obey a normal distribution with the variation coefficientδ=0.11.The relationships between the predicted penetration depthX50, the ratio of the wetting time per-periodkJRand the corresponding altitudehare shown in Fig.7.TakingkJRas the environmental zonation index, determination of the boundary lines of delineation is shown in Fig.7 based on the principle that the gap of the damage in each zone is relatively equal.It can be concluded as follows: 1)Divide the value range of the lower half curve ofX50vs.hwhich is gradually stabilized into five equal parts; 2)Divide the curve ofX50vs.hinto five zones according to the obtained cut-off values ofX50; 3)Determine the cut-off values ofkJRat each zone according to the corresponding cut-off values ofhat each zone of the curve ofX50vs.h.Thus, the environmental zonation for concrete structures in marine environments is achieved and shown in Fig.7 by takingkJRas the environmental zonation index.Five zones can be obtained and expressed as [1,2,3,4,5], in which 1 represents the least severe degree of erosion and 5 the most.Environmental zonation levels and characteristics for each zone are introduced in Tab.2.
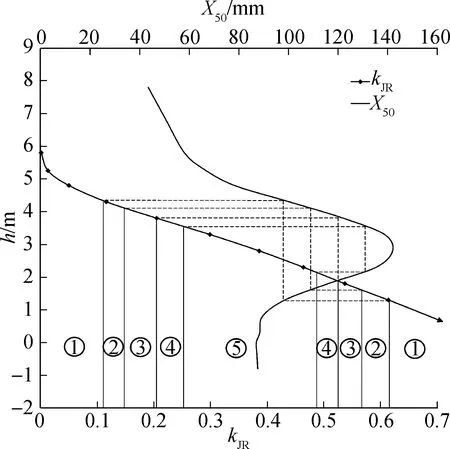
Fig.7 Relationships between X50, kJR and h
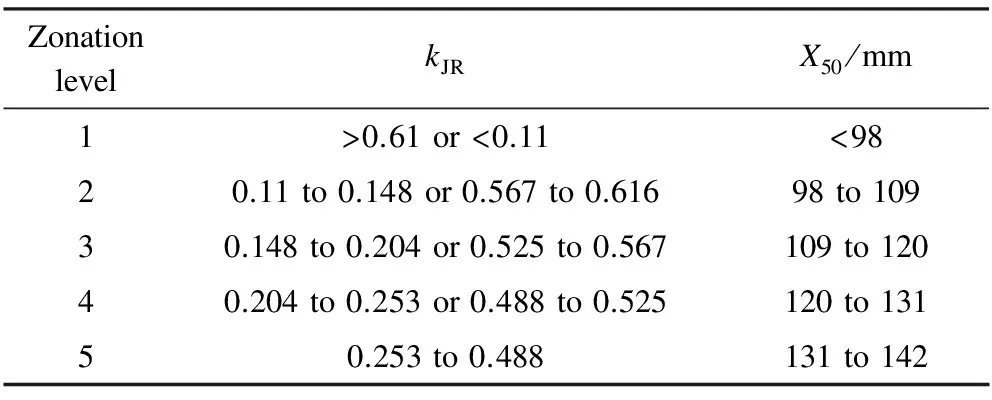
Tab.2 Environmental characteristics and values of X50 for each zone
3.2 Regulations of materials and constructions
The material and environmental conditions involved in the establishment and analysis of the chloride penetration prediction model and environmental zonation are the reference conditions when a different environment or concrete mix needs to be considered.Subsequently, the reference conditions are referred to as a standard condition, and it includes two aspects: standard material conditions (OPC-based concrete with a water/binder ratio of 0.45)and standard environmental conditions.Relevant parameters are listed in Tab.1.
Based on the available results of environmental zonation under marine chloride environments (see Fig.7 and Tab.2), the construction regulations of concrete cover depthX50, which meets the durability limit states and the corresponding reliability index for concrete structures in the standard condition (standard material conditions and standard environmental conditions mentioned above)with 50 years’ exposure, are presented in Tab.3.
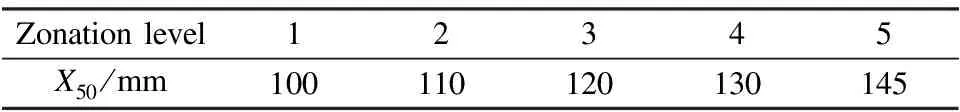
Tab.3 Suggested values of X50 for standard specimen
In engineering practice, numerous material and environmental conditions, different from the standard condition, need to be considered in the durability design.In this case, the corresponding durability design regulations for each zone level are given.The correction coefficients for different water/binder ratiosζiare shown in Tab.4.The correction coefficients for different ageζtare shown in Tab.5.The correction coefficients for different temperatureζTare shown in Tab.6.The correction coefficients for different chloride ion concentrationsζClare shown in Tab.7.
When the material and environmental conditions are determined, the design values of cover depthXcan be determinate asX50ζiζtζTζCl.
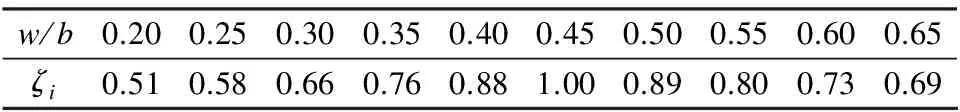
Tab.4 Correction coefficients for different water binder ratios
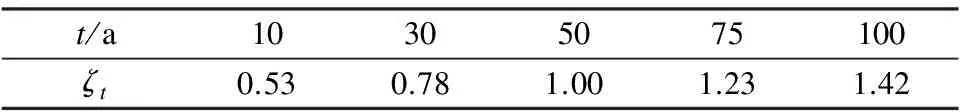
Tab.5 Correction coefficients for strength
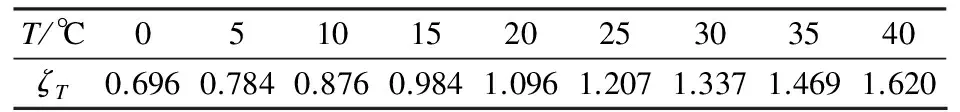
Tab.6 Correction coefficients for temperature
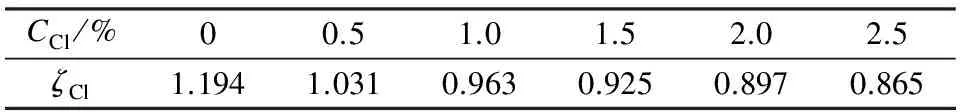
Tab.7 Correction coefficients for chloride ion concentration
4 Conclusions
1)The nominal surface chloride ion concentrationCsnand the penetration depth of chloride into concrete have a similar change law to the altitude or the ratio of the wetting time per-periodkJR.The relationship betweenCsnand the altitude is expressed in a single peak curve with the peak appearing when the value ofkJRranges from 0.253 to 0.488.
2)Focusing on the interaction between the external environments and the structures, the quantitative durability design methodology is presented particularly for the RC structures exposed to marine environments.The ratio of the wetting time per-period is identified as the environmental zonation index, and it can characterize the environments in different coastal areas and has a crucial influence on the ingress of chloride into concrete.
3)The environmental zonation methodology and the corresponding durability design method for each zone level are established.The durability design regulations contain the zoning design regulationsX50of the specimen in the standard condition, correction coefficients for different water/binder ratiosζi, correction coefficients for different agesζt, correction coefficients for different temperaturesζT, and correction coefficients for different chloride ion concentrationsζCl.The durability design regulations associated with environmental zonation can be used as guidelines for durability design of concrete structures.
[1]Ahmad S.Reinforcement corrosion in concrete structures, its monitoring and service life prediction—A review[J].CementandConcreteComposites, 2003,25(4/5): 459-471.DOI:10.1016/s0958-9465(02)00086-0.
[2]Conciatori D, Grégoire É, Samson É, et al.Sensitivity of chloride ingress modelling in concrete to input parameter variability[J].MaterialsandStructures, 2015,48(9):3023-3036.
[3]Angst U M, Polder R.Spatial variability of chloride in concrete within homogeneously exposed areas[J].CementandConcreteResearch, 2014,56: 40-51.DOI:10.1016/j.cemconres.2013.10.010.
[4]Ministry of Housing and Urban-Rural Development of the People’s Republic of China.GB/T 50476—2008 Code for durability design of concrete structures[S].Beijing: China Building Industry Press, 2008.(in Chinese)
[5]Crete D.General guidelines for durability design and redesign [R].Brussels: The European Union-Brite EuRam Ⅲ, 2000.
[6]Jin W L, Lü Q F.Study on durability zonation standard of concrete structural design[C]//ProceedingsofDurabilityofReinforcedConcreteontheCombinedMechanicalClimaticLoads.Qingdao, China, 2005: 35-42.
[7]Jin W L, Lü Q F.Durability zonation standard of concrete structure design[J].JournalofSoutheastUniversity(EnglishEdition), 2007,23(1): 98-104.
[8]Jin W L, Yuan Y S, Wei J.Theoriesanddesignfordurabilityofconcretestructuresexposedtochlorideenvironment[M].Beijing: Science Press, 2011.(in Chinese)
[9]Wu H R, Jin W L, Lv Q F, et al.Reliability-based zonation of environmental area according to its effect on durability of concrete structures[J].JournalofZhejiangUniversity(EngineeringScience), 2012,46(3):416-423.(in Chinese)
[10]Wu H R, Jin W L, Yan Y D, et al.Environmental zonation and life prediction of concrete in frost environments[J].JournalofZhejiangUniversity(EngineeringScience), 2012,46(4):650-657.(in Chinese)
[11]Lay S, Schissel P, Cairns J.Probabilistic service life models for reinforced concrete structures[D].Munich,Germany: School of Architectural Technology, Technical University of Munich, 2003.
[12]Luo D M, Wang Y, Niu D T.Durability environmental regionalization for concrete structures[J].MathematicalProblemsinEngineering, 2013,2013:1-11.DOI:10.1155/2013/482641.
[13]Huang Q H, Xu N, Gu X L.Environmental zonation for durability assessment and design of reinforced concrete structures in China[C]//ProceedingsoftheFirstInternationalConferenceonMicrostructureRelatedDurabilityofCementitiousComposites.Nanjing, China, 2008: 735-743.
[14]Otieno M, Beushausen H, Alexander M.Chloride-induced corrosion of steel in cracked concrete—Part Ⅱ: Corrosion rate prediction models[J].CementandConcreteResearch, 2016,79: 386-394.DOI:10.1016/j.cemconres.2015.08.008.
[15]Ministry of Transport of the People’s Republic of China.JTJ 275—2000 Corrosion prevention technical specifications for concrete structures of marine harbour engineering[S].Beijing: China Communications Press, 2001.(in Chinese)
[16]Mangat P S, Molloy B T.Prediction of long term chloride concentration in concrete[J].MaterialsandStructures, 1994,27(6): 338-346.DOI:10.1007/bf02473426.
[17]Kassir M K, Ghosn M.Chloride-induced corrosion of reinforced concrete bridge decks[J].CementandConcreteResearch, 2002,32(1):139-143.
[18]ASTM International.ASTM C 1218/C 1218M—99 Standard test method for water-soluble chloride in mortar and concrete[S].West Conshohocken, PA, USA: ASTM International, 2008.
[19]Crank J.Themathematicofdiffusion[M].2nd ed.Oxford: Clarendon Press, 1979: 1-18.
[20]American Concrete Institute.ACI 318—05 Building code requirements for structural concrete and Commentary (ACI 318R-05)[S].Farmington Hills, USA: American Concrete Institute, 2005.
[21]CEBFIP.The fib model code for concrete structures 2010[S].Lausanne, Switzerland:Comité Euro-International du Béton (CEB)-Fédération Internationale de la Précontrainte (FIP), 2010.
[22]Wang C K.Standardization study on test of chloride ion penetration and carbonation of concrete[D].Hangzhou: School of Architectural Engineering,Zhejiang University, 2010.(in Chinese)
[23]Bentz E C,Thomas M D A.Life-365 user manual: Computer program for predicting the service life and life-cycle cost of reinforced concrete exposed to chlorides[R].Washington, DC, USA: The Silica Fume Association, 2013.
[24]Xu X W.Standardizing study on concrete freeze-thaw tests under different environments[D].Hangzhou: School of Architectural Engineering,Zhejiang University, 2010.(in Chinese)
[25]NordTest.NT BUILD 443 Accelerated chloride penetration into hardened concrete[S].Nordtest, Espoo, Finland: NordTest, 1995.
[26]Zhao S C.The impact of non-bearing elements on reliability of flexural component under chloride environment[J].Highway,2003,9:12-17.(in Chinese)
[27]Jin L B.Multi-environmental time similarity (METS)theory and its application in coastal concrete structural durability[D].Hangzhou: School of Architectural Engineering,Zhejiang University, 2010.(in Chinese)
[28]Wu J, Cheng J X.Durability assessment of reinforced concrete structures under marine environment[J].JournalofHydroelectricEngineering,2005,24(1):69-73.(in Chinese)
[29]Söderqvist M K, Vesikari E.Generic technical handbook for a predictive life cycle management system of concrete structures (LMS)[R].Finland: The Finnish Road Administration, 2003.
[30]Chen Z Y.Durability design of concrete structures[J].ArchitectureTechnology, 2003,34(5): 328-333.(in Chinese)
[31]Glass G K, Buenfeld N R.The presentation of the chloride threshold level for corrosion of steel in concrete[J].CorrosionScience, 1997(5): 1001-1013.DOI:10.1016/s0010-938x(97)00009-7.
[32]Alonso C, Andrade C, Castellote M, et al.Chloride threshold values to depassivate reinforcing bars embedded in a standardized OPC mortar[J].CementandConcreteResearch, 2000,30(7): 1047-1055.DOI:10.1016/s0008-8846(00)00265-9.
[33]Yao C J.Penetration laws of chloride ions in concrete infrastructures at coastal ports[D].Hangzhou: School of Architectural Engineering,Zhejiang University, 2007.(in Chinese)
杂志排行

Journal of Southeast University(English Edition)的其它文章
- Effects of superabsorbent polymer particles on flexural properties and self-healing behavior of ECC
- Effects of flat and elongated aggregateson the performance of porous asphalt mixture
- Influence of longitudinal slope on the mechanical response of steel deck pavement
- Generalized Cayley-Hamilton theoremfor core-EP inverse matrix and DMP inverse matrix
- Scheduling optimization problem considering time-of-use tariffs and piece-rate machine maintenance in EAF steelmaking
- Modeling and analysis of cloud computing system survivability based on Bio-PEPA