Effects of flat and elongated aggregateson the performance of porous asphalt mixture
2018-04-12WangXiaoweiGuXingyuDongQiaoWuJiangtao
Wang Xiaowei Gu Xingyu Dong Qiao Wu Jiangtao
(School of Transportation, Southeast University, Nanjing 210096, China)
Porous asphalt mixture (PA)is an open graded mixture.It has a high air void (AV)(18% to 23%)and a coarse aggregate skeleton with stone-on-stone contact[1].PA was designed to infiltrate storm water, reduce the risk of hydroplaning and wet skidding, decrease splash and spray, and lower noise[2].High AV and a coarse granular skeleton bring these advantages, but result in some disadvantages, such as reduced performance, high construction costs, and low durability[3].Aggregate properties play the most important role in the performance of PA since it consists of more than 80% coarse aggregates (retain on the 2.36 mm)[4].Fine aggregate angularity and coarse aggregate shape are the two of the aggregate properties which have the most important influence on mixture performance[5].
According to the ratio of the length to the minimum thickness or width, coarse aggregates can be classified into flat, elongated, flat and elongated (F&E), and neither flat nor elongated (non-F&E)particles[6].In this study, F&E particles include flat, elongated, flat and elongated particles.Superpave mix design system specifies that an aggregate is determined to be F&E particles if the ratio is greater than five and requires that the F&E content in the aggregate shall not exceed 10% for mixture[7].The standard of F&E particles with the ratio of 5∶1 cannot distinguish different aggregates, and most coarse aggregate sources satisfy the current specification of a maximum limit of 10% content of F&E with the ratio of 5∶1.Therefore, many researchers recommend that F&E particles should be changed from the ratio of 5∶1 to 3∶1[8-9].In China, specifications have the same requirement that the F&E content must not exceed 15% for all types of mixtures, even though PA has larger coarse aggregate proportion.
Huber et al.[5]found that the dense graded mixtures with 19.4% and 9.0% F&E (ratio 3∶1)contents have no significant difference in volumetric properties.Other studies conducted by Buchanan[9]revealed that F&E (ratio is 3∶1)contents of 29.5%, 21.8% and 16.2% show no significant differences in volumetric properties, rutting resistance, fatigue resistance, and breakdown for traditional dense graded mixture.However, regarding granite with F&E contents of 57%, 14.4%, and 2.1%, significant changes were found in the voids in mineral aggregate (VMA)and gradation.Brown et al.[8]evaluated various F&E contents (0%, 25%, 50%, 75% and 100%)for stone matrix asphalt (SMA)mixtures.The results also indicated that the change in percent passing the 4.75 mm sieve shows an increase with the increase in F&E content.Airey et al.[10]stated that gap graded asphalt mixtures have a greater amount of aggregate degradation after compaction compared with dense graded asphalt mixtures.
PA has a larger proportion of coarse aggregates and higher requirements on the quality of coarse aggregates than that of dense graded mixture.The skeleton of coarse aggregate of PA is potentially more sensitive to the F&E content.However, most agencies required the same F&E content limitation for both dense and open graded mixtures.Only limited research was conducted to evaluate the effects of F&E aggregates on the performance of PA.Therefore, it is of great significance to investigate the effects of F&E contents on the physical and mechanical properties of PA.The role of F&E particles can be evaluated by evaluating the effects of different F&E contents on the performance of PA through laboratory tests.The laboratory tests including volumetric determination, two-dimensional image analysis, Cantabro tests, breakdown tests, and permeability tests, were conducted to evaluate the volumetric properties, the state of stone-on-stone contact, durability, skeleton stability and permeability of PA, respectively.
1 Objectives and Scope
The main objective of this paper is to investigate the influence of the F&E content on the volumetric properties, stone-on-stone contact, durability, aggregate breakdown and permeability of PA.Since every F&E particle was manually picked from different groups of coarse aggregates, four F&E contents (0% (control), original, 30%, and 40%)were considered.Statistical analysis was then conducted to determine whether the F&E content has a significant influence on the performance of PA.In the statistical analysis, the null hypothesis H0: F&E aggregates will not have a significant influence on the volumetric properties, durability, stability and permeability of PA.
2 Materials and Mixture Design
2.1 Materials
High viscosity polymer-modified asphalt is commonly used in Asian countries to improve the anti-ravelling and high-and-low temperature performance.Compared with traditional modified asphalt, high viscosity polymer-modified asphalt has an extremely high dynamic viscosity and soft point.The dynamic viscosity at 60 ℃ is 143 202 Pa·s, and the soft point is 90 ℃
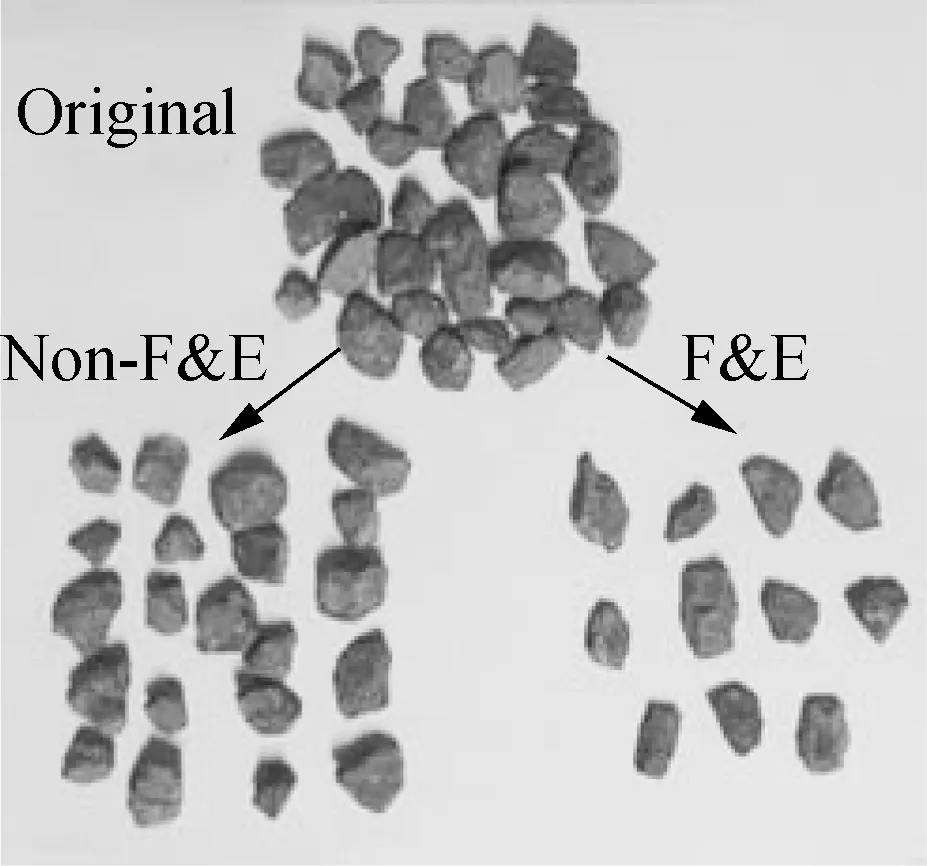
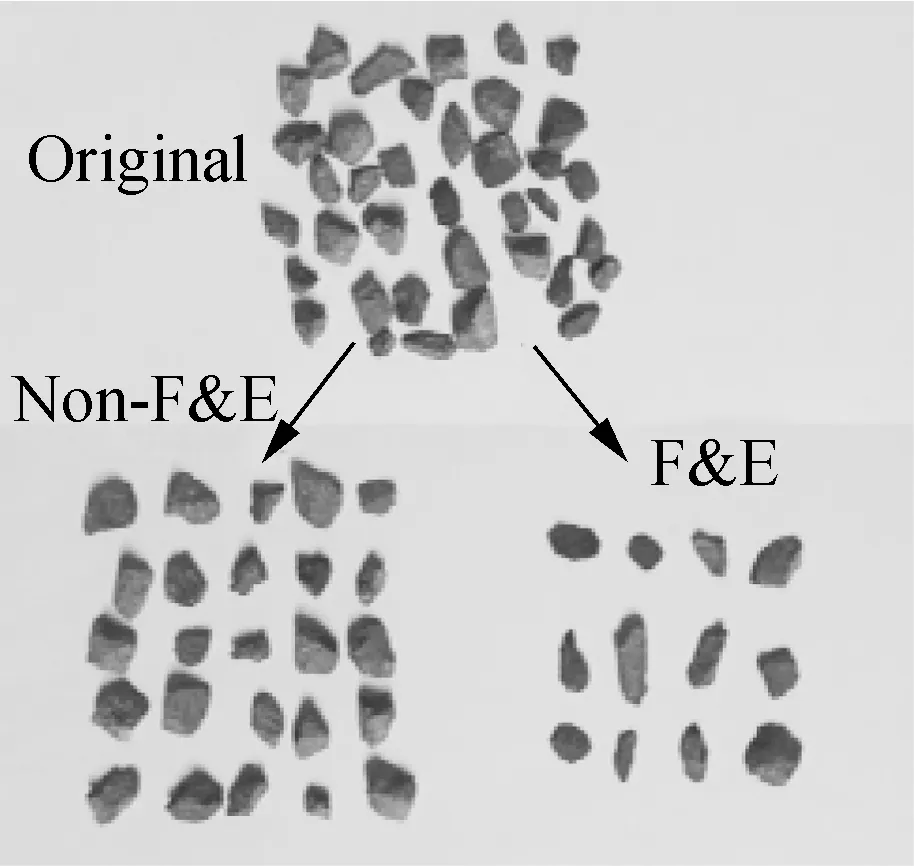
Basalt coarse aggregate is used in the mixture.The properties of aggregate are summarized in Tab.1.In this paper, an aggregate is determined to be F&E particles if the ratio of the length to the minimum thickness or width is greater than 3.In order to design a mixture with different F&E contents, F&E and non-F&E particles were manually picked up from the original aggregates one by one, as shown in Fig.1.The original aggregates were divided into F&E and non-F&E particles by comparing the ratio of the length to minimum thickness or width.Two groups of original 10-15 mm and 5-10 mm coarse aggregates were prepared.As shown in Tab.1, the F&E content of original 10-15 mm and 5-10 mm are 11.2% and 14.0%, respectively.A large amount of aggregates was processed in this study to fabricate a total of 64 specimens.

Tab.1 Summary of the properties of original aggregates
(a)
(b)
Fig.1Different particle shapes of two groups of coarse aggregates.(a)10-15 mm; (b)5-10 mm
2.2 Mixture design
PA with 13.2 mm nominal aggregate size, mostly used in the drainage pavement wearing course, was used as the control mixture.The mixture design process contains aggregate gradation selection and asphalt content determination.The selection of the PA gradation was mainly based on an evaluation of AV combined with the evaluation of stone-on-stone contact[1].AV should satisfy the minimum requirement of 18% to ensure adequate functionality[11].The state of stone-on-stone contact is required to provide sufficient resistance to permanent deformation and is determined by comparing the AV in the coarse aggregate (VCA)evaluated in the dry-rodded condition (VCADRC)and the compacted PA mixture (VCAmix).The breaking-sieve size is 2.36 mm and the stone-on-stone contact was verified by using a maximum VCAmix/VCADRCratio (VCA ratio)of 1.0[12].The selected gradation of PA is shown in Tab.2.The mass percent of four aggregate groups of 10-15 mm, 5-10 mm, 0-3 mm, and filler in a specimen are 39%, 43%, 13%, and 5%, respectively.The asphalt content is 4.8% and the VCA ratio is 0.989.A superpave gyratory compactor (SGC)with 50 gyrations was used to fabricate two groups of cylindrical samples with a diameter of 100 mm and approximate height of 63.5 mm, and a diameter of 100 mm and approximate height of 100 mm.Specimens with a length of 300 mm, width of 300 mm, and height of 50mm were fabricated for the permeability test with the same gradation.All of the specimens produced and studied in this paper had the same gradation and asphalt content regardless of the F&E content.

Tab.2 The selected gradation of PA
2.3 F&E content design for mixture
To evaluate the influence of different F&E contents on the performance of PA, four different F&E contents (0%, original, 30% and 40%)reference to the selected gradation were considered.Each F&E content mix was made by blending original aggregates, non F&E and F&E particles in various proportions.Assuming that one specimen contains a total mass of 1 100 g aggregates, the composition of each specimen is shown in Tab.3.

Tab.3 Composition of mixtures with different F&E contents
3 Laboratory Tests
3.1 Volumetric determination
Volumetric parameters depend on the bulk specific gravity (Gmb)and the theoretical maximum specific gravity of the mixtures (Gmm).Total AV (Atotal)and water-accessible AV (Awater-accessible)are calculated as[13]
(1)
(2)

(3)

(4)
wheremis the mass of the specimen in air, g;Vis the total volume of the specimen which is calculated by average height and diameter;ρωis the density of water, g/cm3;Pbis the asphalt content based on mass of mixture;Gseis the average effective specific gravity of the aggregate;mwis the saturated sample mass in water, g.
3.2 Two-dimensional (2-D)image analysis
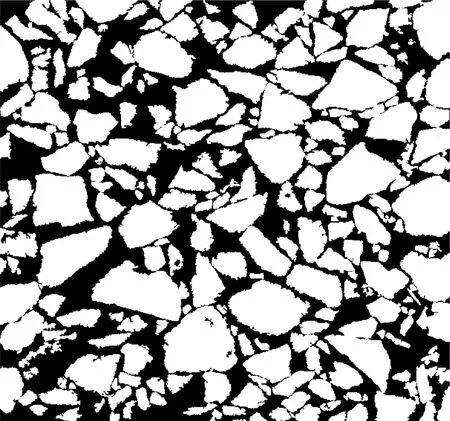
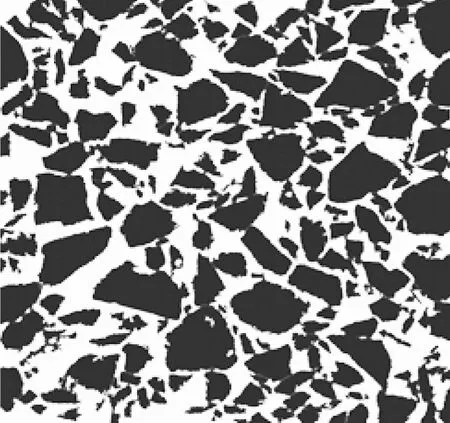
Volumetric and gradation information can be processed using 2-D image analysis to characterize the internal structure of asphalt mixtures[14].Furthermore, aggregate interaction information, such as the number of aggregate contacts, contact length, normal to contact plane orientation, can also be captured from 2-D image analysis to define the state of stone-on-stone contact[15].The influence of F&E contents on the state of stone-on-stone contact was evaluated using 2-D image analysis.2-D image analysis was conducted on MATLAB software by programming a series of algorithms.Adjacent aggregates are defined as contacted if the distance of two aggregates is less than 0.2 mm for PA[16], and the contact length can be obtained.Testing specimens with a diameter of 100 mm and height of 100 mm were fabricated at 50 gyrations of SGC.The specimens were cut into three sections to attain six 2-D images, with one cutting section at the middle of the specimen and two in a distance of 2.5 cm from the middle section (see Fig.2)[15].Image analysis processes are shown in Fig.3.
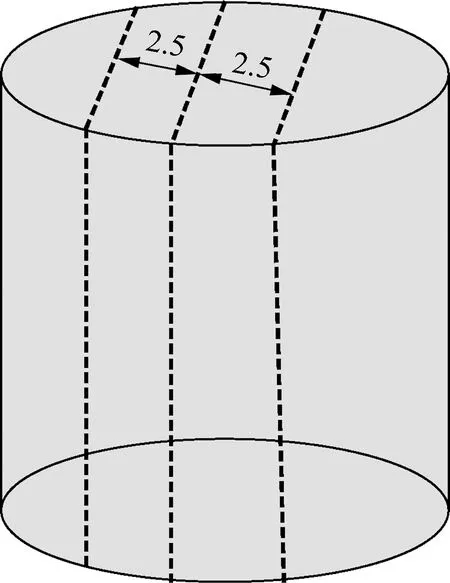
Fig.2 Cutting sections (unit: cm)

(a)
(b)
(c)

(d)
Fig.3Image analysis processes.(a)Scanned images of mixtures; (b)Coarse aggregates; (c)Thresholding; (d)Aggregate contact line
3.3 Cantabro loss test
The Cantabro loss test can provide an indirect evaluation of mixture cohesion and adhesion.Alvarez et al.[17]compared the Cantabro loss test, Hamburg wheel-tracking test, and overlay test to evaluate the durability of the permeable friction course, and the result recommended the Cantabro loss test as the most appropriate for durability evaluation.The Cantabro loss test was performed by placing a compacted specimen into the Los Angeles (LA)abrasion machine and used the percent of weight loss (Cantabro loss)to evaluate the durability of mixtures.Three different conditioning scenarios (dry, wet, and 7 d aging)were prepared to evaluate the moisture susceptibility and long-term durability of PA.The dry conditioning was performed at room temperature (25 ℃).The wet conditioning involves soaking the specimen in a water bath for 48 h at 60 ℃ and then drying the specimen for 24 h using a fan at room temperature.7 d aging was used to investigate the long-term durability of PA which involved aging the specimens at 60 ℃ in an oven for 7 d and then cooling them at room temperature for 24 h.Cantabro loss was obtained after applying 300 revolutions in the LA abrasion machine and was calculated by

(5)
wheremis the initial weight;m1is the retained weight;Sis the Cantabro loss, %.For wet specimens, the Cantabro loss was calculated by

(6)
wheremdis the weight after drying to eliminate the water trapped during immersion in water.
3.4 Breakdown test
It is believed that mixtures which contain high F&E content have a tendency to break down during compaction.According to Jiang et al.[18], changes in geometrical parameters of aggregate will affect the transmission of load in the asphalt mixture.F&E particles have a tendency to break down during compaction and will affect the overall stress-strain distribution in the asphalt mixture.Aggregate breakdown was tested after compaction with SGC.Each specimen was put into the oven at (538±5)℃ until the mass was fixed.Gradation after ignition oven burn was determined by a sieve analysis, then compared to the design gradation and the percent breakdown calculated[19].
3.5 Permeability test
A permeability test[20]was performed to evaluate the influence of F&E contents on the permeability of PA.The permeameter was placed on the specimen, and the bottom of the permeameter was sealed with putty to ensure that no water would drain around the outer edges of the specimen (see Fig.4).The test result was reported as the amount of water (mL)penetrating into the specimen within 15 s on average[21].
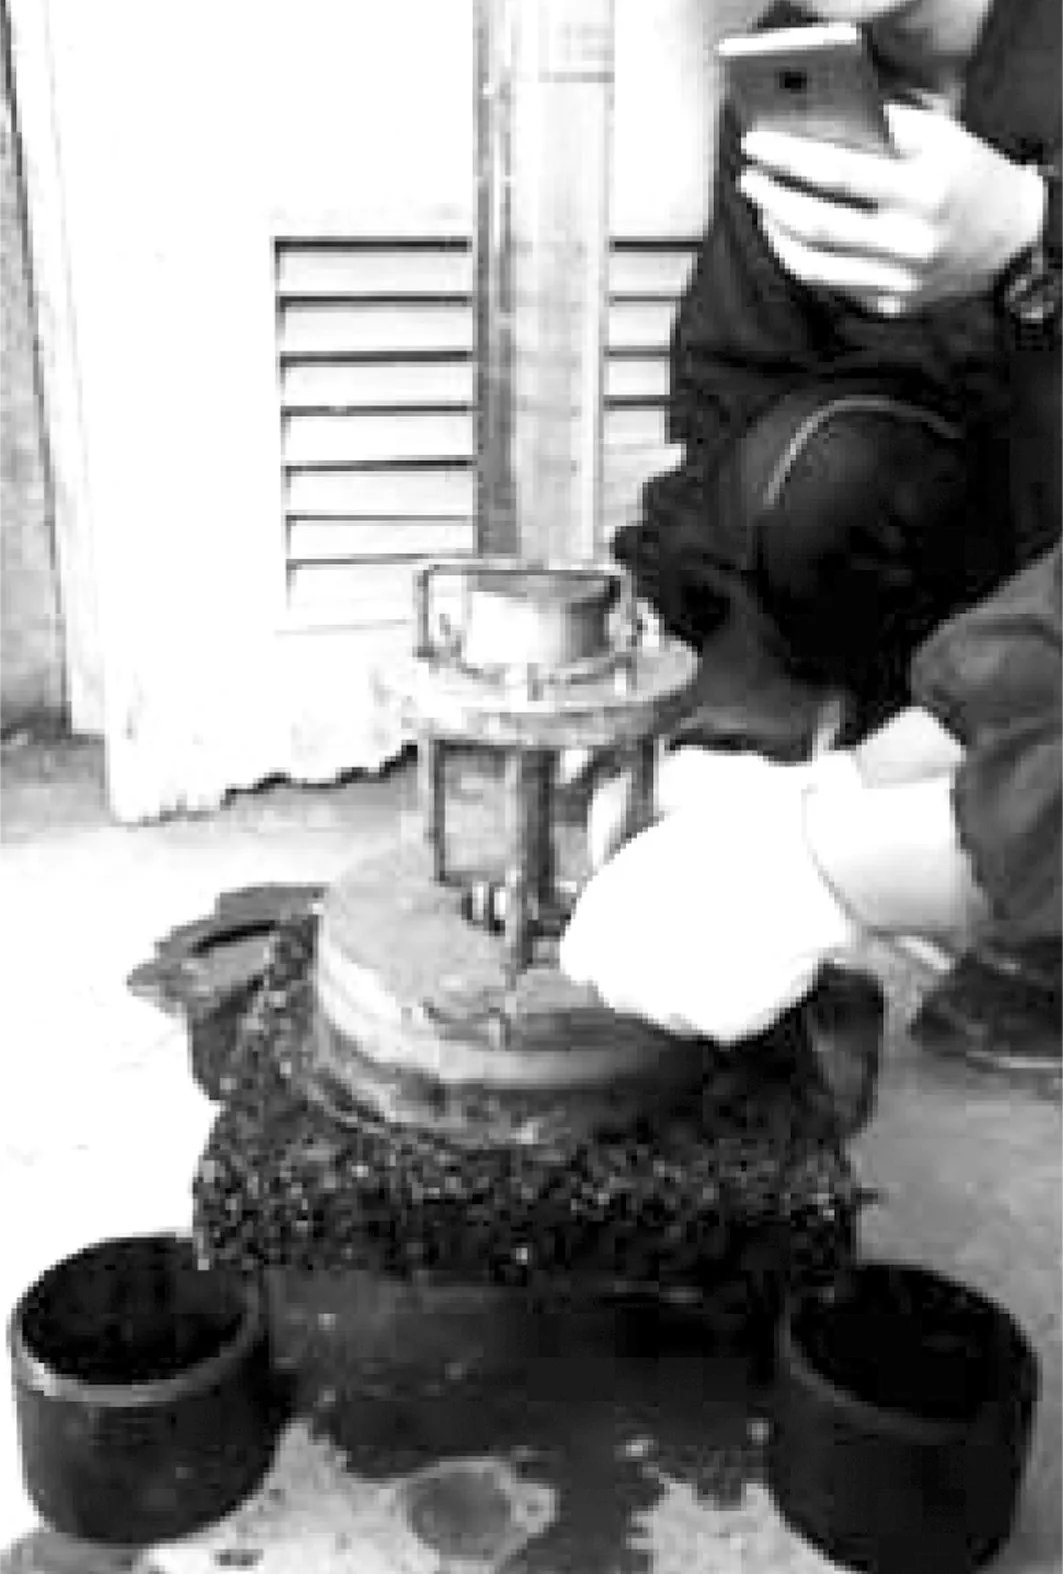
Fig.4 Permeability test
4 Results and Discussion
This section presents the results of four groups (the control, original, 30% F&E content, and 40% F&E content)in terms of volumetric properties, the state of stone-on-stone contact, durability, skeleton stability and permeability.Test results are compared by statistical analysis with a 5% level of significance.
4.1 Volumetric properties
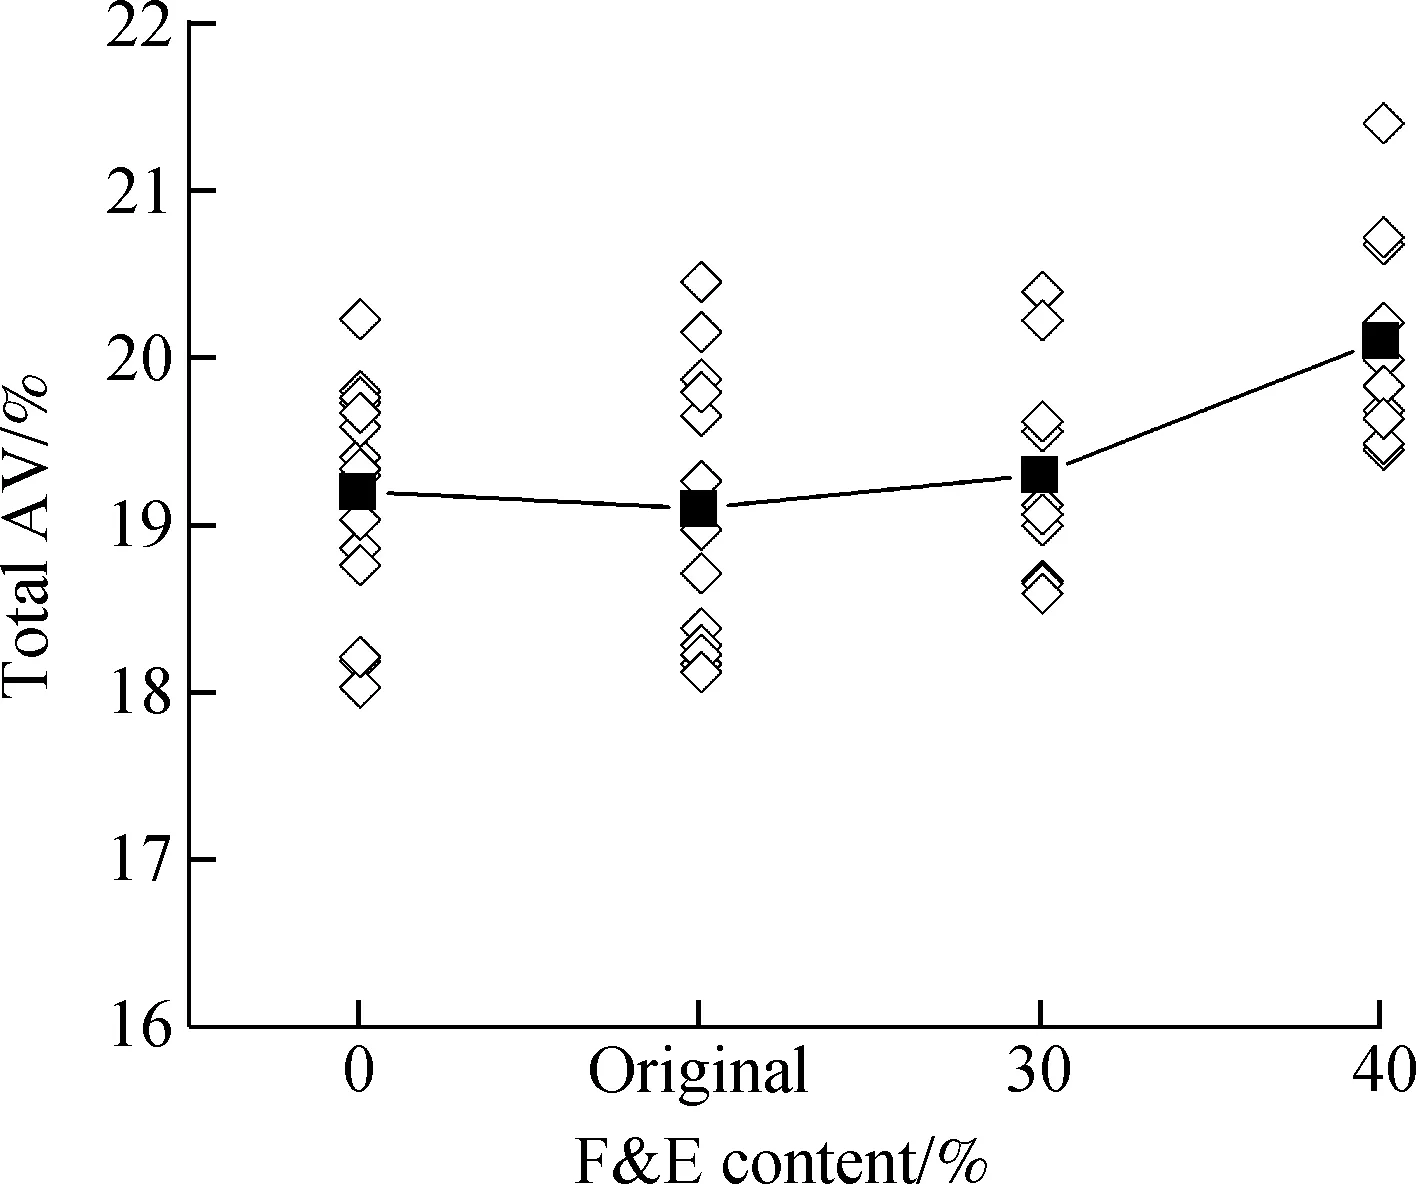
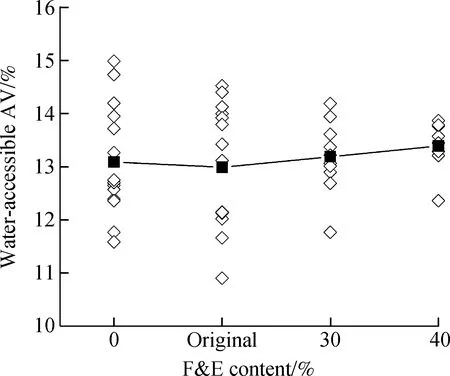
The volumetric properties of the four groups (the control, original, 30% F&E content, and 40% F&E content)are evaluated in this study and shown in Fig.5.Fig.5(a)shows the total AV of PA versus different F&E contents, and Fig.5(b)shows the water-accessible AV versus the four F&E contents.The total AV with four F&E contents all satisfied the requirement of 18% minimum total AV.Statistical analysis results as shown in Tab.4 indicate that no significant difference was found in total AV values among the control, original, and 30% groups.Meanwhile, no significant differences in water-accessible AV were found for all of the four groups.However, significantly different total AV can be found while F&E content changes up to 40%.This is different from the traditional dense graded mixtures.Mahboub et al.[22]conducted research to evaluate three groups (0%, 15% F&E content and 40% F&E content)on the volumetric properties of traditional dense graded mixtures.No significant difference was found in volumetric properties of 40% F&E content.In this study, the 40% F&E group has the largest total AV and water-accessible AV.However, previous research concluded that the increased AV is false AV created by the fracture of coarse aggregate[23].This can be verified by the later permeability test.
(a)
(b)
Fig.5Volumetric properties versus change in F&E contents.(a)Total AV; (b)Water-accessible AV

Tab.4 Statistical analysis of various F&E contents (α=0.05)
4.2 Stone-on-stone contact
The number of contact points (NCP)and total contact length (TCL)were chosen to define the state of stone-on-stone contact[15].The area of the analytical image for all specimen sections is 6 500 mm2.The average values of two replicate images for each F&E content are shown in Fig.6.NCP represents the connectivity of the internal aggregate structure.Higher NCP can lead to a better stress distribution with fewer stress concentrations.Longer contact length can increase the friction and interlocking between aggregates[15].TCL and NCP show a good susceptibility to the change of F&E contents.The original group has the largest value of NCP and TCL, while 40% F&E content mixture is the smallest.The PA of 40% F&E content has the weakest resistance to permanent deformation.Statistical analysis results are presented in Tab.5 and a significant difference was observed in NCP among the four F&E groups.Oduroh et al.[24]concluded that up to 40% of F&E (3∶1)particles could be permitted in a mixture without negative effects on its performance.Apparently, the PA does not agree with this conclusion.

Tab.5 Statistical analysis of image analysis results (α=0.05)
4.3 Durability
The Cantabro loss test results at different conditions and F&E contents are presented in Fig.7.To guarantee the durability of PA, it is recommended that Cantabro loss should not exceed 20% for unaged specimen and 30% for aged specimen[17].Fig.7 indicates that the four F&E groups all satisfied this requirement.Statistical analysis presented in Tab.6 indicates that there are no significant differences in Cantabro loss for dry, wet, and 7 d aging conditions among the control, original, and 30% groups.When the F&E content is up to 40%, significant difference is found under wet and 7 d aging conditions.Compared with the control group, the Cantabro loss of the 40% group is increased by 77.9%, 128.2% and 97.8% under wet, 7 d aging, and dry conditions, respectively.Therefore, the long-term durability and moisture susceptibility of PA will be deteriorated when the F&E content is high.
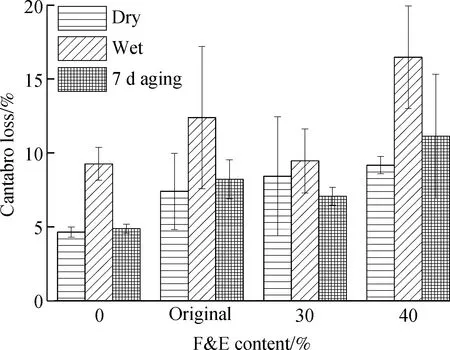
Fig.7 Average cantabro loss for different F&E contents

Tab.6 Statistical analysis of various F&E contents (α=0.05)
4.4 Breakdown
The results of the breakdown test are presented in Fig.8, in which strong linear relationships between F&E contents and percent breakdown are observed on the 2.36 mm sieve and 4.75 mm for the PA mixture.The percent breakdown increased significantly with the increase of the F&E content and this trend was reported in previous research[9].As reported by previous research, the percent of aggregate breakdown was 3.0% on the 4.75 mm sieve for dense graded mixture with 30% F&E content[9].In this research, the percent of aggregate breakdown is 6.8% with the same F&E content for the PA mixture.Greater breakdown of 9.1% and 6.3% on 4.75 mm and 2.36 mm are observed for 40% F&E content.Therefore, PA mixture has greater risk of breakdown than dense graded mixture because it has an open graded aggregate structure.High F&E content has a significant influence on the percent breakdown, and this may induce the failure of the aggregate structure.Based on previous studies, F&E contents did not have significant influence on the performance of traditional dense graded mixtures even though they are up to 40%[22, 24].However, the F&E contents have a significant influence on the performance of the PA, and 40% F&E content seriously reduced the performance of the PA.It can be concluded that the PA is more sensitive to the F&E content than traditional dense graded mixtures.
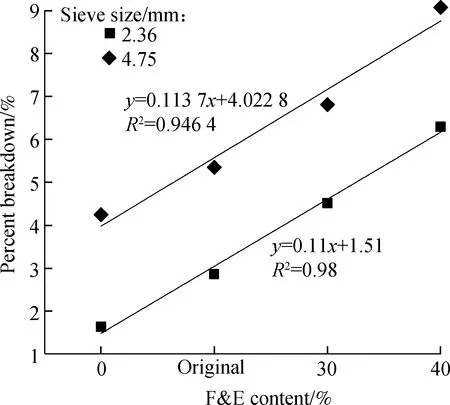
Fig.8 Aggregates percent breakdown versus change in F&E content
4.5 Permeability
The permeability of PA for the four F&E contents of 0%, original, 30%, and 40% is 74.9, 81.8, 68.6, and 62.3 mL/s, respectively.The lowest permeability satisfies the requirements of minimum 60 mL/s[21].Fig.5 (a)shows that the 40% F&E group has the largest total AV and water-accessible AV.Based on the previous research, permeability increased with the increase of total AV and water-accessible AV[4].However, the 40% F&E group had the lowest permeability in this study.Permeability decreased with the increase of the F&E content because the breakdown greatly increased false voids.As shown in Tab.7, a significant difference can be found for the four F&E groups.F&E content has a significant influence on the permeability, and permeability may constantly deteriorate during long-term operations.
Tab.7Statistical analysis with different F&E contents (α=0.05)

F&Econtent/%0Original30400SSSOriginalSSS30SSS40SSS
5 Conclusions
1)A significant difference in total AV is found as the F&E content reaches up to 40% and the F&E content has no significant influence on the water-accessible AV.However, a significant difference in permeability is found among the four F&E groups.The 40% F&E group has the lowest permeability even though total AV and water-accessible AV are the largest.This phenomenon can be attributed to the fact that the increased AV created by breakdown is false AV.Therefore, the F&E content has a significant influence on the functionality of the PA.
2)2-D image analysis, the Cantabro loss test, and breakdown test were conducted in this study.Results indicate that F&E particles have negative effects on the rutting resistance, long-term durability and skeleton stability.At the same F&E content, the PA was observed to have significant negative effects on the performance while traditional dense graded mixtures did not.PA has greater breakdown than dense graded mixtures, and breakdown exacerbates negative effects.
3)From what was discussed above, the PA is more sensitive to F&E particles due to an open graded aggregate skeleton with a larger proportion of coarse aggregates.Specifications should recommend different F&E limitations for PA and traditional dense graded mixtures instead of having the same.
[1]Alvarez A E, Fernandez E M, Epps-Martin A, et al.Comparison of permeable friction course mixtures fabricated using asphalt rubber and performance-grade asphalt binders[J].ConstructionandBuildingMaterials, 2012,28(1):427-436.DOI:10.1016/j.conbuildmat.2011.08.085.
[2]Ma X, Li Q, Cui Y C, et al.Performance of porous asphalt mixture with various additives[J].InternationalJournalofPavementEngineering, 2016: 1-7.DOI:10.1080/10298436.2016.1175560.
[3]Hernandez-Saenz M A, Caro S, Armbula-Mercado E, et al.Mix design, performance and maintenance of permeable friction courses (PFC)in the United States: State of the art[J].ConstructionandBuildingMaterials, 2016,111: 358-367.DOI:10.1016/j.conbuildmat.2016.02.053.
[4]Mansour T N, Putman B J.Influence of aggregate gradation on the performance properties of porous asphalt mixtures[J].JournalofMaterialsinCivilEngineering, 2013,25(2): 281-288.DOI:10.1061/(asce)mt.1943-5533.0000602.
[5]Huber G, Jones J, Messersmith P, et al.Contribution of fine aggregate angularity and particle shape to superpave mixture performance[J].TransportationResearchRecord, 1998,1609(1): 28-35.DOI:10.3141/1609-04.
[6]ASTM International.ASTM D4791 Standard test method for flat or elongated particles in coarse aggregate [S].Washington, DC: ASTM, 2009.
[7]Cominsky R, Leahy R B, Harrigan E T.Level one mix design: materials selection, compaction, and conditioning, SHRP-A-408 [R].Washington, DC: National Research Council, 1994.
[8]Brown E R, Haddock J E, Mallick R B, et al.Development of a mixture design procedure for stone matrix asphalt (SMA)asphalt content, NCAT Report 97-03 [R].Auburn, AL, USA: National Center for Asphalt Technology, 1997.
[9]Buchanan M S.Evaluation of the effect of flat and elongated particles on the performance of hot mix asphalt mixtures, NCAT Report 00-03 [R].Auburn, AL, USA: National Center for Asphalt Technology, 2000.
[10]Airey G D, Hunter A E, Collop A C.The effect of asphalt mixture gradation and compaction energy on aggregate degradation[J].ConstructionandBuildingMaterials, 2008,22(5): 972-980.DOI:10.1016/j.conbuildmat.2006.11.022.
[11]Putman B J.Evaluation of open-graded friction courses: Construction, maintenance, and performance, FHWA-SC-12-04 [R].Clemson, SC, USA: South Carolina Department of Transportation, Clemson University, 2012.
[12]Putman B J, Kline L C.Comparison of mix design methods for porous asphalt mixtures[J].JournalofMaterialsinCivilEngineering, 2012,24(11): 1359-1367.DOI:10.1061/(asce)mt.1943-5533.0000529.
[13]Alvarez A E, Martin A E, Estakhri C, et al.Determination of volumetric properties for permeable friction course mixtures[J].JournalofTestingandEvaluation, 2009,37(1): 1-10.DOI:10.1520/jte101696.
[14]Coenen A R, Kutay M E, Sefidmazgi N R, et al.Aggregate structure characterisation of asphalt mixtures using two-dimensional image analysis[J].RoadMaterialsandPavementDesign, 2012,13(3): 433-454.DOI:10.1080/14680629.2012.711923.
[15]Sefidmazgi N R, Tashman L, Bahia H.Internal structure characterization of asphalt mixtures for rutting performance using imaging analysis [J].RoadMaterials&PavementDesign, 2012,13(Sup 1): 21-37.DOI:10.1080/14680629.2012.657045.
[16]Huurman M.Lifetime optimisation tool[R].Delft, the Netherlands: Civil Engineering and Geosciences, Delft University of Technology, 2008.
[17]Alvarez A E, Epps-Martin A, Estakhri C, et al.Evaluation of durability tests for permeable friction course mixtures[J].InternationalJournalofPavementEngineering, 2010,11(1): 49-60.DOI:10.1080/10298430902730539.
[18]Jiang J, Ni F, Gao L, et al.Effect of the contact structure characteristics on rutting performance in asphalt mixtures using 2D imaging analysis[J].ConstructionandBuildingMaterials, 2017,136: 426-435.DOI:10.1016/j.conbuildmat.2016.12.210.
[19]Herndon D A, Xiao F P, Amirkhanian S, et al.Investigation of Los Angeles value and alternate aggregate gradations in OGFC mixtures[J].ConstructionandBuildingMaterials, 2016,110: 278-285.DOI:10.1016/j.conbuildmat.2016.01.008.
[20]JTG E20 T0730—2011.Standard test methods of bitumen and bituminous mixtures for highway engineering [S].Beijing: Research Institute of Highway Ministry of Transport, 2011.(in Chinese)
[21]Yu B, Jiao L, Ni F, et al.Long-term field performance of porous asphalt pavement in China [J].RoadMaterialsandPavementDesign, 2014,16(1): 214-226.DOI:10.1080/14680629.2014.944205.
[22]Mahboub K C, Oduroh P K, Anderson R M.Hot mix asphalt with fiat and elongated aggregates [C]//ConstructionandMaterialsIssues.Houston, TX, USA, 2001: 183-192.DOI:10.1061/40591(269)19.
[23]Vavrik W, Fries R, Carpenter S.Effect of flat and elongated coarse aggregate on characteristics of gyratory compacted samples[J].TransportationResearchRecord, 1999,1681: 28-36.DOI:10.3141/1681-04.
[24]Oduroh P K, Mahboub K C, Anderson R M.Flat and elongated aggregates in superpave regime[J].JournalofMaterialsinCivilEngineering, 2000,12(2): 124-130.DOI:10.1061/(asce)0899-1561(2000)12:2(124).
杂志排行
Journal of Southeast University(English Edition)的其它文章
- Effects of superabsorbent polymer particles on flexural properties and self-healing behavior of ECC
- Durability related environmental zonation and design methodology for marine RC structures
- Influence of longitudinal slope on the mechanical response of steel deck pavement
- Generalized Cayley-Hamilton theoremfor core-EP inverse matrix and DMP inverse matrix
- Scheduling optimization problem considering time-of-use tariffs and piece-rate machine maintenance in EAF steelmaking
- Modeling and analysis of cloud computing system survivability based on Bio-PEPA
