Quantification and spatial distribution of salicylic acid in film tablets using FT-Raman mapping with multivariate curve resolution
2018-03-28HsletEksiKokSielIlsmisTmerSenemYilmzMerveEryilmzIsmilHkkBoyiUgurTmer
Hslet Eksi-Kok,Siel Ilsmis Tmer,Senem Yilmz,Merve Eryilmz,Ismil Hkkı Boyi,d,Ugur Tmer,*
aDepartment of Biomedical Engineering,Faculty of Engineering,Istanbul Aydin University,Istanbul 34295,Turkey
bDepartment of Pharmaceutical Technology,Faculty of Pharmacy,Gazi University,Etiler,Ankara 06330,Turkey
cDepartment of Analytical Chemistry,Faculty of Pharmacy,Gazi University,Etiler,Ankara 06330,Turkey
dFood Research Center,Hacettepe University,Beytepe,Ankara 06800,Turkey
1. Introduction
Raman spectroscopy is an important tool especially for chemical identification and quantification of active pharmaceutical ingredients(APIs)and excipients in drug analysis.However,Raman scattering is inherently rare event due to the low crosssection,hence it is difficult to collect a well-resolved Raman spectra at lower concentrations of analyte[1].Since the distribution of APIs and excipients in tablet form is crucial for drug industry,there is a need to be combined with an imaging technique and analytical measurements.The morphology of the active ingredients and excipients in solid dosage formulations can be identified with Raman mapping[2].The spatial distribution of active ingredients is studied for troubleshooting of manufacturing processes[3],blend homogeneity[4],monitoring the structure[2–8]and revealing the physical properties of the products[9].After investigation of the spatial distribution of the ingredients,various formulations can be compared[10]and counterfeit products can be distinguished from the original[10–13].Up to date,numerous solid dispersions have been investigated and Raman mapping of pharmaceutical tablets has become a standard method.The active ingredient distribution is generally monitored and the spatial distribution can be determined on the different domains of the investigated area[13–22].
Raman mapping has many advantages over the other analytical techniques.This technique enables a non-destructive and rapid determination in constituent distribution after different manufacturing processes and provides to control the quality of newly developed or final product without using hazardous solvents[23].However,it is necessary to carry out the chemometric approaches to quantify the active pharmaceutical ingredient under optimized experimental conditions.Up to date,partial least squares discriminant analysis(PLS)[24],independent component analysis[23],principal component analysis(PCA)[25],cluster analysis[26]and multivariate curve resolution(MCR)[10]have been employed for data analysis.These studies have concluded that statistical analysis for the determination of active ingredients,excipients or contaminants is inevitable tool to achieve robust Raman methods.Nonetheless,experimental parameters such as spot size and number of collected data points per sample,sampling methods(e.g.point by point,line or global imaging)and particle size are also vital parameters that should be addressed[27].
The quantitative analysis by using Raman mapping is also challenging issue due to the presence of various spectroscopic and imaging parameters[28].A huge number of chemical images should be analyzed and scanned areas have to match the active ingredient concentration in pharmaceutical formulations.The concentration of an ingredient can be estimated from each pixel through Raman chemical images.However,accurate quantitative determination of drug component is thought provoking without using chemometric methods.PLS has generally been used in near infrared chemical imaging(NIR-CI)[29–31]and there are few studies dealing with calibration models for chemical images to quantify ingredients.Some authors performed the PLS regression on Raman chemical images and found the method suitable for quantitative evaluations[29,32–34].Li and coworkers employed different PLS models in order to obtain low-content quantification in powders using Raman mapping and reported that the results are comparable to HPLC analysis[27].S´ašic´et al.,also demonstrated the detection of low content component in solid dosage form[28,35].Different multivariate data analysis including PCA,cluster analysis,direct classical least squares(DCLS)and MCR were compared for Raman imaging using a model pharmaceutical tablet[36].
Raman chemical imaging combined with MCR has potential advantages including the low-level quantification of active and inactive ingredients[37].When these two powerful methods are used together,spatial and spectral information are simultaneously collected and the API is determined with a higher accuracy[29]and sensitivity of scanned sample.In addition,MCR method has been performed with several spectroscopic techniques in order to observe the content uniformity and morphology.To the best of our knowledge,there is no report regarding low-level quantitative analysis of salicylic acid in tablets using FT-Raman mapping with MCR.The aim of the study is to use FT-Raman area mapping in order to develop a rapid and sensitive method for the determination of drug components in tablet form.FT-Raman mapping combined with MCR analysis demonstrated the spatial distribution of salicylic acid and quantified active ingredients in tablet from.
2. Material and methods
2.1. Materials and sample preparation
Salicylic acid and lactose were purchased from Botafarma(Ankara,Turkey).Starch was obtained from Emir Kimya(Ankara,Turkey).Magnesium stearate(Riedel Mannouen,Germany)and Aerosil 200(Werksbescheinigung,Germany),which met the pharmacopoeial quality of US/NF,were used.The compositions of the matrix tablets which were prepared by a direct compression method are given in Table 1.Powdered samples were passed through a#45(0.350 mm)mesh screen separately and blended for 20 min,and then thoroughly mixed with 1%magnesium stearate.Each tablet(average weight 100 mg)containing different salicylic acid(0.5%,1.0%,1.3%,2.0%,2.5%,3.0%,3.4%and 3.9%)(w/w)were prepared in the tablet machine.
2.2. Instrumentation
Tablets were prepared using hydraulic tablet machine(Erweka AR 401,Erweka GmbH,Heusenstamm,Germany)and the mixture was compacted using a 6 or 8 mm flat-faced punch.FT-Raman measurements were obtained using a Raman module mounted in the sample compartment of the Nicolet iS50 spectrometer(Thermo Fisher Scientific Co.,Waltham,MA,USA).A 1064 nm diode laser was used as an excitation source fitted with an InGaAs detector.The laser power on sample was set up to 500 mW with a spot size of approximately 50 microns.
2.3. Raman mapping experiments
FT-Raman mapping experiments were carried out at 8 cm−1resolution and 64 scans at each measurement point.The area maps were taken at 1000×1000 microns step.Spectral maps wereanalyzed using OMNIC™Atlµs software.The Raman spectra of samples were collected at room temperature.In addition,the pure Raman spectra of active pharmaceutical ingredients(APIs)and excipients in tablets were taken individually in the range of 3700 and 200 cm−1and Raman mapping spectra was collected from the flattened surfaces of solid dosage pharmaceutical formulations.

Table 1–Composition of 100 mg tablets(for 100 tablets).
2.4. MCR analysis
MCR analysis which is a feature of the Atlµs mapping software package was performed to spectral data using OMNIC™.A brief description of the MCR is given in this section.The theory of the MCR analysis is based on decomposing instrumental response of the original raw spectral data mathematically and it gives the pure spectra and distribution maps of the components in the imaged sample.As a general rule,the resolution methods are based on decomposing initial data into bilinear model.In this model,the observed spectra are assumed as linear combination of the spectra of the pure components in the system.MCR model can be formulated as D=CST+ε where D is the original data matrix,C is the pure concentration pro files of different species in the system;STis corresponding pure spectra of species and ε is the error.
3. Results and discussion
3.1. Characterization of tablet components
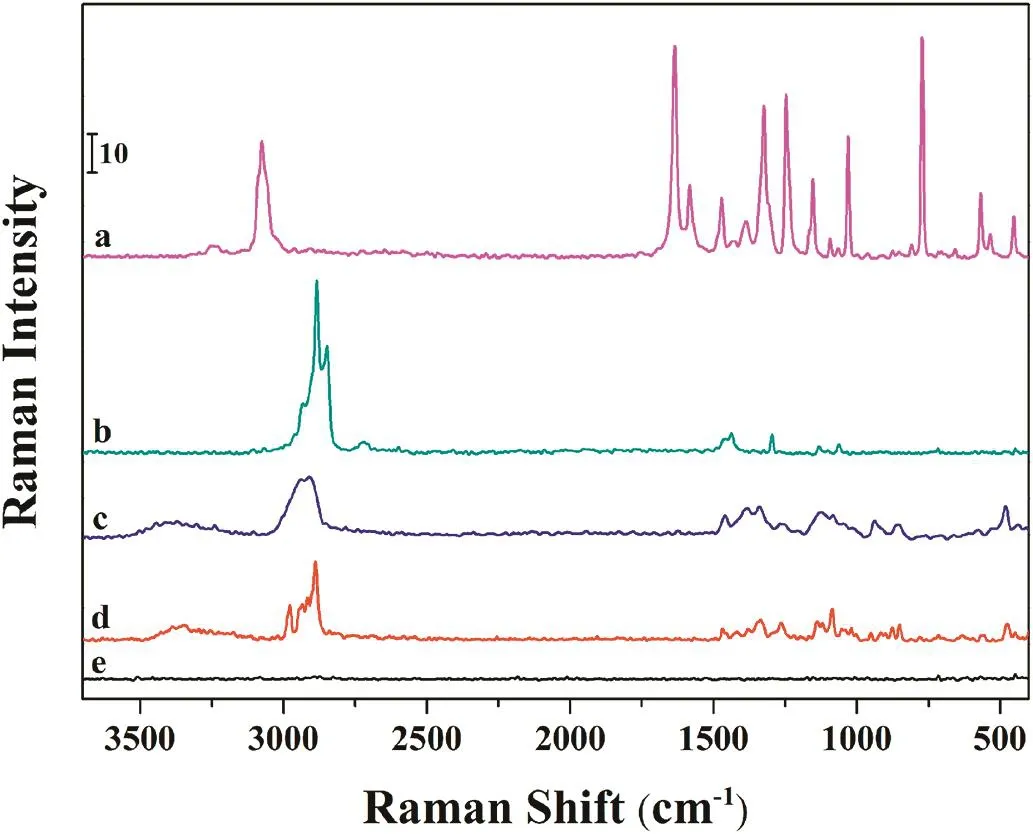
Fig.1–FT-Raman spectra of pure salicylic acid(a),Mgstearate(b),starch(c),lactose(d)and Aerosil 200(e).
Prior to the FT-Raman mapping experiments,the instrumental conditions were optimized for pure active pharmaceutical ingredients(APIs)and excipients in all spectroscopic analysis.For this purpose,FT-Raman spectroscopy was performed on APIs and excipients in powder form in order to monitor the components which were present in tablets.500 mW laser power and 64 scans were applied to drug components in order to obtain well-defined spectra.Fig.1 shows the specific Raman spectrum of pure salicylic acid,magnesium stearate,lactose,starch and Aerosil 200.As it can be seen from Fig.1,the functional groups present in salicylic acid prominently differ from the others.The Raman band located at 3075 cm−1is assigned to the aromatic C–H vibrations in salicylic acid.A distinctive band at 1635 cm−1corresponds to C=O vibrations of carboxylic acid group.The bands surrounding at 1582 and 1471 cm−1were attributed to the C=C stretching vibrations of benzene rings.The C–C in-plane bending vibrations of salicylic acid were observed at 1153 and 772 cm−1.Additionally,the strong bands located at 1386 and 1246 cm−1were related to the O–H in-plane bending and C–O stretching vibration of the hydroxyl group,respectively[24].In contrast with the spectrum of the salicylic acid,the other three substances exhibit C–H vibrations between 2800 and 3000 cm−1.The magnesium stearate has three strong Raman bands at 2931,2883 and 2847 cm−1which correspond to the CH3anti-symmetric,CH2symmetric and anti-symmetric stretching vibrations,respectively.The lactose and starch display similar bands in this region such as 2977,2934,2916 and 2888 cm−1due to the anti-symmetric and symmetric stretching vibrations of CH3and CH2groups.In the spectrum of magnesium stearate,two bands surrounding at 1437 and 1295 cm−1were assigned to the methylene(-CH2)group vibrations.The anti-symmetric and symmetric C–C stretching vibrations were observed at 1131 and 1062 cm−1.
3.2. Visualization of salicylic acid in film tablets by Raman mapping
The hyperspectral Raman imaging has been used to evaluate salicylic acid content in pharmaceutical tablets.The FTRaman maps were collected at 16 sample points over an area of 3000×3000µm with a step size of 1000×1000µm.After then,MCR was applied to mapping data by using Atlµs mapping software package.MCR is a statistical analysis that provides to visualize the API distribution in the presence of the other excipients.For this purpose,eight different concentrations of salicylic acid tablets(0.5%,1.0%,1.3%,2.0%,2.5%,3.0%,3.4%and 3.9%,respectively)were employed in MCR analysis.The compositions of solid dosage formulations are shown in the Table 1.Fig.2 shows the distribution map of salicylic acid for five film tablets of the same concentrations obtained from MCR analysis.The regions used for MCR analysis were determined from the characteristic bands of the components,as mentioned in previous section.To construct the Raman distribution maps,the bands at 1635 cm−1,1085 cm−1and 477 cm−1were selected for salicylic acid,lactose and starch,respectively.The scale bar indicates the changes in Raman intensity.As seen in Fig.2,dark blue colors demonstrated the lower salicylic acid distribution in mapping area.Contrary to this,the higher levels were shown in red color.It can be clearly observed that the salicylic acid content was not homogenously dispersed through the surface of film tablets.The distribution of salicylic acid seems to be agglomerated in particular regions of the scanned area,especially at lower concentrations.As the concentration of salicylic acid increased,the salicylic acid content got more homogenous on the surface of the tablet that the green color became more dominant in the scanned area.It is observed that,there are extensive red regions at higher concentrations which were associated with higher salicylic acid distribution.
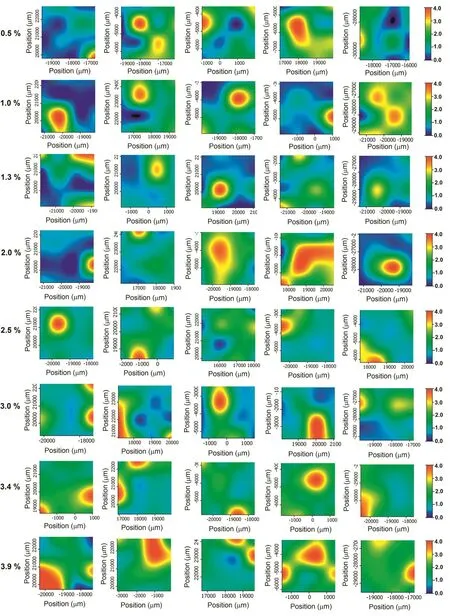
Fig.2–MCR score maps of salicylic acid in film tablets.Different concentrations of salicylic acid tablets(0.5%,1.0%,1.3%,2.0%,2.5%,3.0%,3.4%and 3.9%)were employed in MCR analysis.
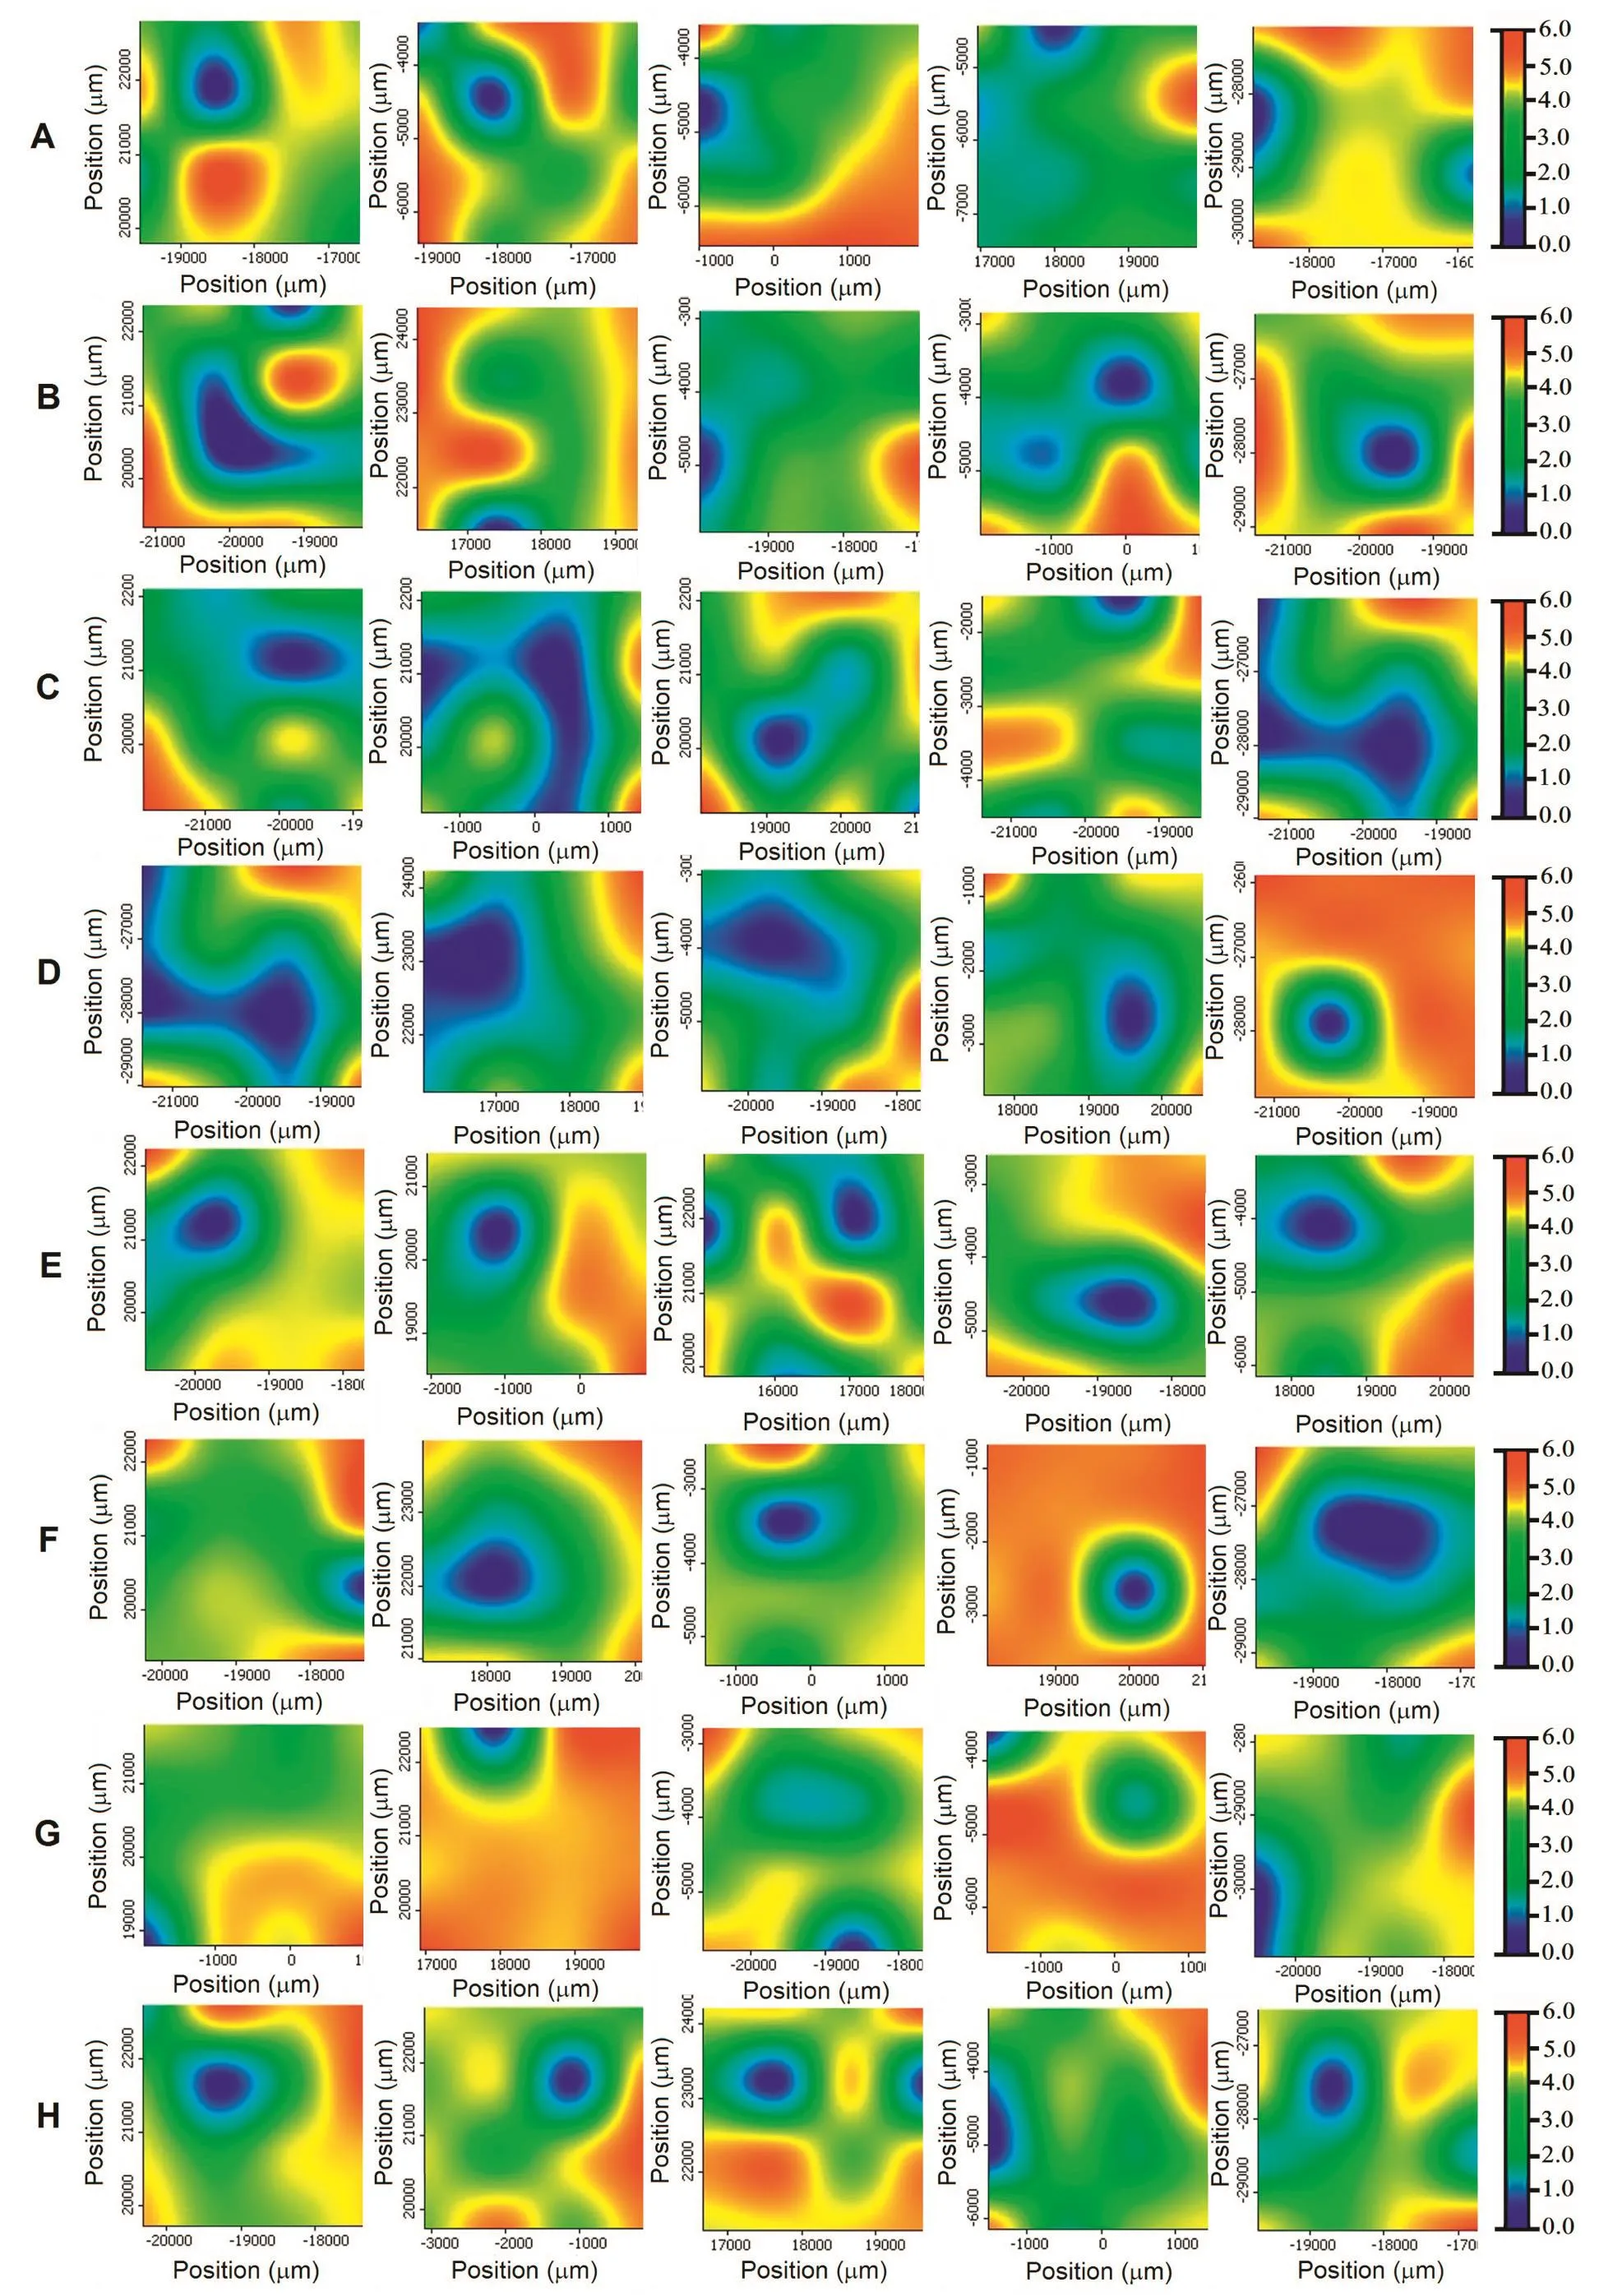
Fig.3–MCR score maps of lactose in five film tablets at same concentrations of SA,0.5%(A),1.0%(B),1.3%(C),2.0%(D),2.5%(E),3.0%(F),3.4%(G)and 3.9%(H).
The distribution map of the lactose,which is the major component of film tablet,was displayed in Fig.3.It can be seen that the distribution of lactose in five film tablets of same concentration was found more homogenous compared to the salicylic acid.Similar with the salicylic acid case,red color represents the highest lactose concentration and blue represents the lowest concentrations.
From the distribution maps,the spectra of components obtained from MCR analysis closely coincided with the Raman spectra of the pure constituents of the tablets.The spectra of pure components obtained from the MCR were compared with FT-Raman spectrum of each drug ingredient which was introduced to the instrument in preliminary studies.As shown in Fig.4,the component spectra produced from MCR analyses were in agreement with the corresponding pure salicylic acid spectra and lactose.
3.3. Quantification of salicylic acid content
For rapid quantitative analysis,the Raman intensity was plotted against salicylic acid concentration in Fig.5.The Raman intensity of the band located at 1635 cm−1was collected from each map point and the average intensity was calculated for the entire map area at specific concentration.The average spectrum of each tablet was calculated from the average of 16 spectra collected from the mapping area.Five film tablets per concentration were used to constitute a calibration graph.As seen in Fig.5,the results showed a good linearity in the range between the concentrations of 0.5%and 3.9%salicylic acid content with a R2of 0.99.The LOD and LOQ values were found 0.35%and 1.06%,respectively.This result revealed that FT-Raman mapping is a convenient method for detecting lower concentrations of salicylic acid in film tablets.Despite the nonhomogenous distribution of the salicylic acid on tablet surface,mapping technique enabled a detailed scanning which provided an increase in the number of spectra collected.
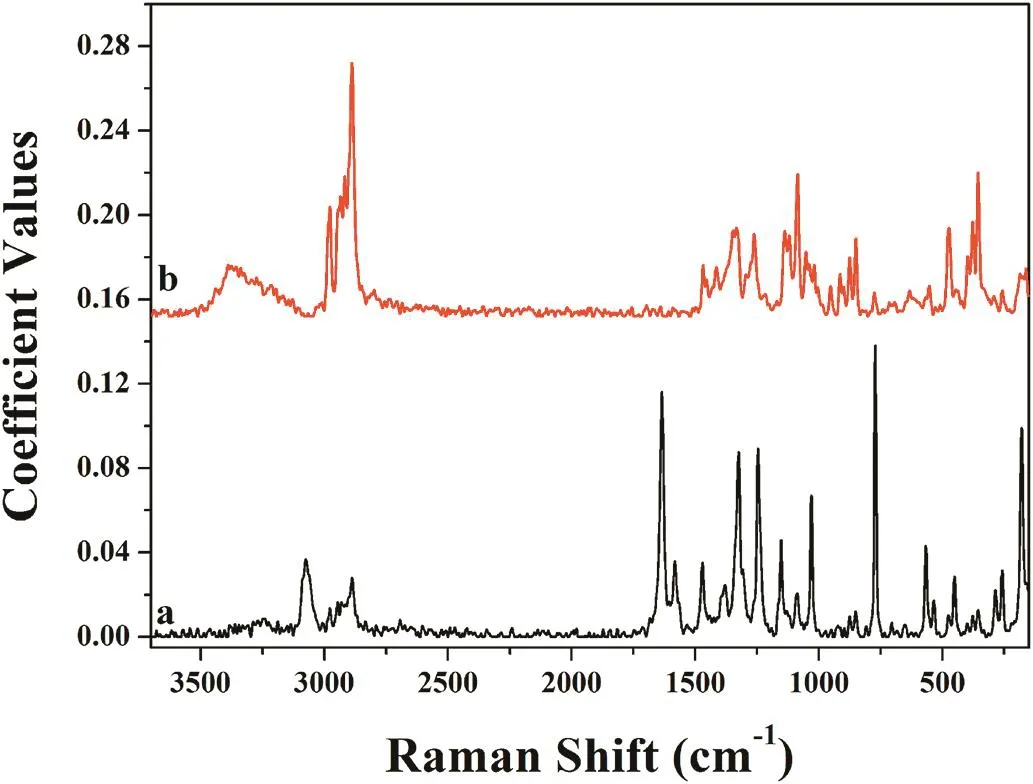
Fig.4–The spectra of pure components obtained from MCR analysis;salicylic acid(a)and lactose(b).
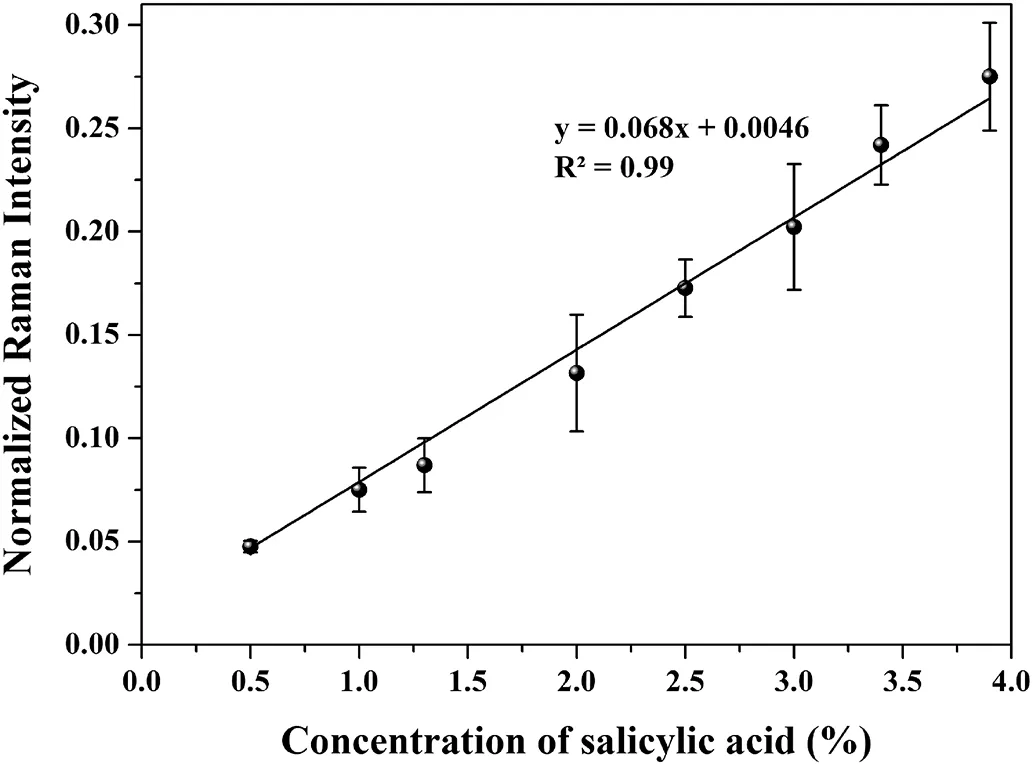
Fig.5–The calibration graph of salicylic acid content in tablet form.Error bars represent standard error for n=5 replicate samples.
3.4. The salicylic acid content in test tablet formulation
To mimic the real tablet formulations and to evaluate the applicability of the method,tablet containing 1.5%salicylic acid was analyzed.Sixteen spectra were collected from each tablet and the average intensity was calculated for each concentration.For 1.5%drug test samples,the Raman intensity introduced into the derived calibration model and calculated concentrations of salicylic acid using proposed method was found as 1.57±0.14.Therefore,the calibration model was suitable for determining the lower concentrations of salicylic acid in test samples.Fig.6 shows the distribution of salicylic acid content in test drug samples.Although the distribution of salicylic acid was seen nonhomogenous in test samples,the number of collected spectra provided to determine the concentration of salicylic acid properly.
The MCR analyses of three test samples were demonstrated in Fig.7.It can be seen from the results that salicylic acid component truly matched with the pure salicylic acid spectra in test samples.Taking into account all of these results,it was decided that FT-Raman mapping combined with MCR analyses is considered to be a promising tool for determining salicylic acid concentration at lower concentrations with a nondestructive and accurate method.
4. Conclusion

Fig.6–The distribution of salicylic acid content in three different test samples.
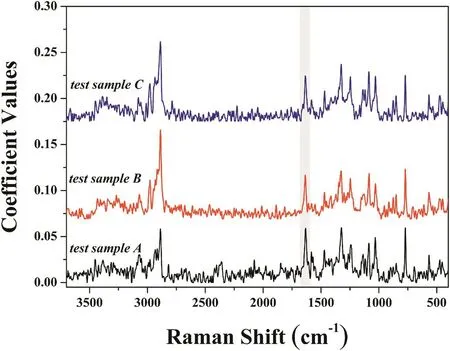
Fig.7–The salicylic acid component obtained from MCR analysis for three test samples.
In this report,we demonstrated an application of FT-Raman mapping for the quantification of the low-level active ingredient in tablet form by using MCR.The pure state of salicylic acid exhibits well-de fined Raman signals and specific bands in fingerprint region.However,it is important to differentiate the API(salicylic acid)content among the other excipients,especially the lower concentrations in tablets.Therefore,we employed FT-Raman area mapping in order to increase the number of collected spectra for each sample and determine the undetectable concentrations.We decided to collect 16 spectra for each mapping area,since the duration of Raman mapping strings out with increasing sample points.We also examined the distribution of active ingredient and major excipient lactose in the prepared tablet form.The LOD value(0.35%w/w)was obtained with a linear range of 0.5%and 3.9%salicylic acid content.It is also important to mention that all steps in the proposed method can be applied with minimal user intervention.Furthermore,it can be implemented in an automated fashion for quantification.
Conflicts of interest
The authors declare that there is no conflict of interest.
Acknowledgements
This work was supported by grant from Gazi University,Project no:02/2012-27.
[1]Long DA.The Raman effect:a unified treatment of the theory of Raman scattering by molecules.England:John Wiley&Sons Ltd;2002.
[2]Lin WQ,Jiang JH,Yang HF,et al.Characterization of chloramphenicol palmitate drug polymorphs by Raman mapping with multivariate image segmentation using a spatial directed agglomeration clustering method.Anal Chem 2006;78:6003–11.
[3]Clarke F.Extracting process-related information from pharmaceutical dosage forms using near-infrared microscopy.Vib Spectrosc 2004;34:2140–6.
[4]Ravn C,Skibsted E,Bro R.Near-infrared chemical imaging(NIR-CI)on pharmaceutical dosage forms-comparing common pharmaceutical approaches.J Pharm Biomed Anal 2008;48:554–61.
[5]S´ašic´S.A comparison of Raman chemical images produced by univariate and multivariate data processing-a simulation with an example from pharmaceutical practice.Analyst 2004;129:1001–7.
[6]Scoutaris N,Vithani K,Slipper I,et al.SEM-EDX along with confocal Raman microscopy as complementary tools for the characterization of pharmaceutical tablets.Int J Pharm 2014;470:88–98.
[7]Charron DM,Ajito K,Kim JY et al.Chemical mapping of pharmaceutical cocrystals using terahertz spectroscopic imaging.Anal Chem 2013;85:1980–4.
[8]S´ašic´S.An in–depth analysis of Raman and near-infrared chemical images of common pharmaceutical tablets.Appl Spectrosc 2007;61:239–50.
[9]Chan KLA,Hammond SV,Kazarian SG.Application of attenuated total reflection infrared spectroscopic imaging to pharmaceutical formulations.Anal Chem 2003;75:2140–6.
[10]Vajna B,Farkas A,Pataki H,et al.Testing the performance of pure spectrum resolution from Raman hyperspectral images of differently manufactured pharmaceutical tablets.Anal Chim Acta 2012;712:45–55.
[11]Puchert T,Lochmann D,Menezes JC,et al.Near-infrared chemical imaging(NIR-CI)for counterfeit drug identification-a four-stage concept with a novel approach of data processing(linear image signature).J Pharm Biomed Anal 2010;51:138–45.
[12]Adar F,Leary P,Kubic T.Raman microscopy for detecting counterfeit drugs-a study of the tablets versus the packaging.Spectroscopy 2014;29(6):10–7.
[13]Vajna B,Farkas I,Farkas A,et al.Characterization of drugcyclodextrin formulations using Raman mapping and multivariate curve resolution.J Pharm Biomed Anal 2011;56:38–44.
[14]Breitenbach J,Schrof W,Neumann J.Confocal Ramanspectroscopy:analytical approach to solid dispersions and mapping of drugs.Pharm Res 1999;16:1109–13.
[15]Nagy ZK,Nyúl K,Wágner I,et al.Electrospun water soluble polymer mat for ultrafast release of donepezil HCl.Express Polym Lett 2010;4:763–72.
[16]Docoslis A,Huszarik KL,Papageorgiou GZ,et al.Characterization of distribution,polymorphism,and stability of nimodipine in its solid dispersions in polyethylene glycol by micro-Raman spectroscopy and powder x-ray diffraction.AAPS J 2007;9:361–70.
[17]Fruyama N,Hasegawa S,Hamaura T,et al.Evaluation of solid dispersions on a molecular level by the Raman mapping technique.Int J Pharm 2008;361:12–8.
[18]Gowen AA,O’Donnell CP,Cullen PJ,et al.Recent applications of chemical imaging to pharmaceutical process monitoring and quality control.Eur J Pharm Biopharm 2008;69:10–22.
[19]Amigo JM.Practical issues of hyperspectral imaging analysis of solid dosage forms.Anal Bioanal Chem 2010;398:93–109.
[20]Stephenson GA,Forbes RA,Reutzel-Edens SM.Characterization of the solid state:quantitative issues.Adv Drug Deliv Rev 2001;48:67–90.
[21]Heinz A,Savolainen M,Rades T,et al.Quantifying ternary mixtures of different solid state forms of indomethacin by Raman and near-infrared spectroscopy.Eur J Pharm Sci 2007;32:182–92.
[22]Rantanen J,Wikstroem H,Rhea FE,et al.Improved understanding of factors contributing to quantification of anhydrate/hydrate powder mixtures.Appl Spectrosc 2005;59:942–51.
[23]Boiret M,Rutledge DN,Gorretta N,et al.Application of independent component analysis on Raman images of a pharmaceutical drug product:pure spectra determination and spatial distribution of constituents.J Pharm Biomed Anal 2013;90:78–84.
[24]Maltas¸DC,Kwok K,Wang P,et al.Rapid classification of pharmaceutical ingredient with Raman spectroscopy using compressive detection strategy with PLS-DA multivariate filters.J Pharm Biomed Anal 2013;80:60–8.
[25]Grahn H,Geladi P.Techniques and applications of hyper spectral image analysis.New York:John Wiley&Son Ltd;2007.
[26]Lopes MB,Wolff JC.Investigation into classification/sourcing of suspect counterfeit HeptodinTMtablets by near infrared chemical imaging.Anal Chim Acta 2009;633:149–55.
[27]Li B,Calvet A,Boucau YC,et al.Low-content quantification using spectroscopy:a facile chemometric approach to sub 0.1%limits of detection.Anal Chem 2015;87:3419–28.
[28]S´ašic´S,Mehrens S.Raman chemical mapping of lowcontent active pharmaceutical ingredient formulations.III.Statistically optimized sampling and detection of polymorphic forms in tablets on stability.Anal Chem 2012;84:1019–25.
[29]Farkas A,Vajna B,Soti PL,et al.Comparison of multivariate linear regression methods in micro-Raman spectrometric quantitative characterization.J Raman Spectrosc 2015;46:566–76.
[30]Huang Y,Cao J,Ye S,et al.Near-infrared spectral imaging for quantitative analysis of active component in counterfeit imidacloprid using PLS regression.Optics 2013;124:1644–9.
[31]Alexandrino GL,Poppi RJ.NIR imaging spectroscopy for quantification of constituents in polymers thin films loaded with paracetamol.Anal Chim Acta 2013;765:37–44.
[32]Breitkreitz MC,Sabin GP,Polla G,et al.Characterization of semi-solid self-emulsifying drug delivery systems(sedds)of atorvastatin calcium by Raman image spectroscopy and chemometrics.J Pharm Biomed Anal 2013;73:3–12.
[33]Nagy ZK,Balogh A,Vajna B,et al.Comparison of electrospun and extruded soluplus®-based solid dosage forms of improved dissolution.J Pharm Sci 2012;101:22–332.
[34]Balss KM,Long FH,Veselov V,et al.Multivariate analysis applied to the study of spatial distributions found in drugeluting stent coatings by confocal Raman microscopy.Anal Chem 2008;80:4853–9.
[35]Spencer JA,Kauffman JF,Reepmeyer JC,et al.Screening of heparin API by near infrared reflectance and Raman spectroscopy.J Pharm Sci 2009;98:3540–7.
[36]Sacre PY,Bleye CD,Chayez PF,et al.Data processing of vibrational chemical imaging for pharmaceutical applications.J Pharm Biomed Anal 2014;101:123–40.
[37]Schonbichler SA,Bittner LK,Weiss AK,et al.Comparison of NIR chemical imaging with conventional NIR,Raman and ATR-IR spectroscopy for quantification of furosemide crystal polymorphs in ternary powder mixtures.Eur J Pharm Biopharm 2013;84:616–25.
杂志排行
Asian Journal of Pharmacentical Sciences的其它文章
- Combretastatin A4/poly(L-glutamic acid)-graft-PEG conjugates self-assembled to nanoparticles
- Development of lamellar gel phase emulsion containing baru oil(Dipteryx alata Vog.)as a prospective delivery system for cutaneous application
- Preparation and toxicity evaluation of a novel nattokinase-tauroursodeoxycholate complex
- Spray freeze drying of small nucleic acids as inhaled powder for pulmonary delivery
- Tablets of paliperidone using compression-coated technology for controlled ascending release
- Role of clove oil in solvent exchange-induced doxycycline hyclate-loaded Eudragit RS in situ forming gel
