Risks involved in fecal DNA-based genotyping of microsatellite loci in the Amur tiger Panthera tigris altaica:a pilot study
2018-03-19XueZhangYanchunXuHuiLiuGuangshunJiang
Xue Zhang•Yanchun Xu•Hui Liu•Guangshun Jiang
Introduction
The emergence of molecular genetic marker-based technologies presents opportunities for mining information from feces and hair,materials that are both commonly collected in the fi eld but made little use of in traditional monitoring methods.Non-invasive sampling of feces and hair and relevant genetic analyses have become popular in wildlife monitoring and management(Taberlet and Luikart 1999),especially for endangered species(Woodruff 1993).The quality and quantity of DNA extracted from fecal samples are more or less in fl uenced by diet composition(Stenglein et al.2010).Research shows that an interaction exists between the complexity of diet composition and the probability of false allele ampli fi cation in polymerase chain reaction(PCR),and compared with herbivores the quality and quantity of DNA extracted from carnivores is poorer because of complicated scat composition(Panasci et al.2011).
Asarareandelusivecarnivorespecies,itisdif fi culttocollect samples like blood or tissue from Amur tigers in the fi eld,but feces are easily obtained during wildlife surveys.Routine procedures for fecal analysis include isolation of genomic DNA and ampli fi cation of a panel of microsatellite loci and bio-informative analyses.However,due to poor quality and small quantities of template DNA resulting from degradation or contamination(Bradley et al.2000;Regnaut et al.2006),microsatellite loci ampli fi cation and genotyping can greatly impact subsequent analyses and have wildlife management implications.Although some population genetic studies of Amur tiger have used feces as a DNA source(Rozhnov et al.2009),their use has not been tested through scienti fi c pilot studies that help to reduce genotyping errors associated with template DNA of poor quality(Arandjelovic et al.2009).
Factors affecting microsatellite analysis of Amur tigers include ef fi ciency of DNA isolation and PCR.The ef ficiency of DNA isolation largely depends on storage methods(Nsubuga et al.2004),season of collection(Hájkováet al.2006),and age of the scat(Murphy et al.2007;Santini et al.2007).The ef fi ciency of PCR mainly depends on the nature of primer sequences,ampli fi cation fragment length,secondary structure,melting temperatureand nucleotide composition(Sambrook et al.2001).Software based estimation of genotyping errors is based on statistical models sensitive to sample size;however,the population size of wild Amur tigers is small,and the chance for sampling different tiger individuals is biased and software may not be effective.In this research,we improved the ef fi ciency of DNA isolation and only studied the effect of microsatellite-based PCR protocols on the genetic analysis of Amur tigers.We compared the accordance rate of genotyping ef fi ciency,individualization and inter-individual genetic relationships between blood and fecal samples for 10 captive Amur tigers(Panthera tigris altaica)with 12 microsatellite loci utilized in wild tiger population monitoring(Bhagavatula and Singh 2006;Rozhnov et al.2009).Speci fi cally,we quanti fi ed the variation in genotyping risk among the 12 microsatellite loci used for individualization and genetic relationship estimation,and further,whether among-loci variation was in fl uenced by repeated PCRs when fecal DNA was used.Our pilot study and the results will provide a frame of reference for conservation programs designed on DNA analyses of wild Amur tigers.
Materials and methods
Samples
Feces and peripheral blood samples of 10 adult Amur tigers were collected in Heilongjiang Amur Tiger Park in November2013.Bloodsampleswerecollectedby veterinarians three months after birth for establishing genetic lineage.These blood samples were anticoagulated with sodium citrate(3.8%)and temporarily stored at 4°C until DNA was extracted.Feces were collected from the same group of tigers using plastic bags within 12 h after defecation and temporarily stored in an ice bag and then transferred to a refrigerator(-20°C)beforeDNA extraction.
DNA extraction
DNA of blood samples was extracted using the standard phenol and chloroform method(Sambrook et al.1989).DNA of fecal samples was extracted using the modi fi ed QIAamp DNA Stool Mini Kit(Qiagen,Hilden,Germany)as described by Zhang et al.(2009)and with optimized preparation work as follows.About 5 g of feces was peeled off from the surface of a fecal pellet and deactivated in 100%ethanol with volume a ratio of 1:1 at room temperature for 12 h.Feces and ethanol were then vortexed at 2200 rpm for 3 min.The mixture was then fi ltered through a piece of sterile gauze.The fi ltrate was collected and centrifuged at 3500 rpm for 15 min and pellets at the bottom were transferred to a new tube for DNA extraction.The quality and quantity of DNA extracted from blood and feces were evaluated using routine agarose(1.0%)electrophoresis with quanti fi cation molecular markers.
Microsatellite analysis
A panel of 12 microsatellite loci was selected from former studies on tiger monitoring and individualization,including D10,Fca43,Fca304,E21B,E6 and E7 for wild tigers(Bhagavatula and Singh 2006;Rozhnov et al.2009),and FCA391,FCA441,Fca094,Fca152,Pti007 and Pti010 for captive tigers(Xu et al.2005;Menotti-Raymond et al.1999;Zhang et al.2003).Primer sequences,repeating motifs,annealing temperatures and expected allele size ranges of these microsatellite loci are shown in Table 1.The 5′end of each forward primer was labeled with fl uorescent dye(e.g.,5-FAM,TAMRA and HEX).
PCR was carried out in a 20 μL system containing 1×PCR buffer containing 50 mM Tris–HCl(pH 8.0),25 mM KCl,0.1 mM EDTA,1 mM dTT;0.4 mM each of 4 dNTP(TOYOBO),0.2 μM each of forward and reverse primer,0.4 U units of KOD FX Neo DNA polymerase(TOYOBO)and about 80 ng of genomic DNA.PCR ampli fi cation was performed on a Model 9700 Thermocycler(Perkin-Elmer)using the following condition:1 cycle of 2 min at 94°C,35 cycles of 98°C for 20 s,annealing temperature(i.e.Tm)(52–62 °C,Table 1)for 30 s,68 °C for 20 s,and 1cycle of 68°C for 20 min.A positive and two negative controls were included for each set of ampli fi cation.
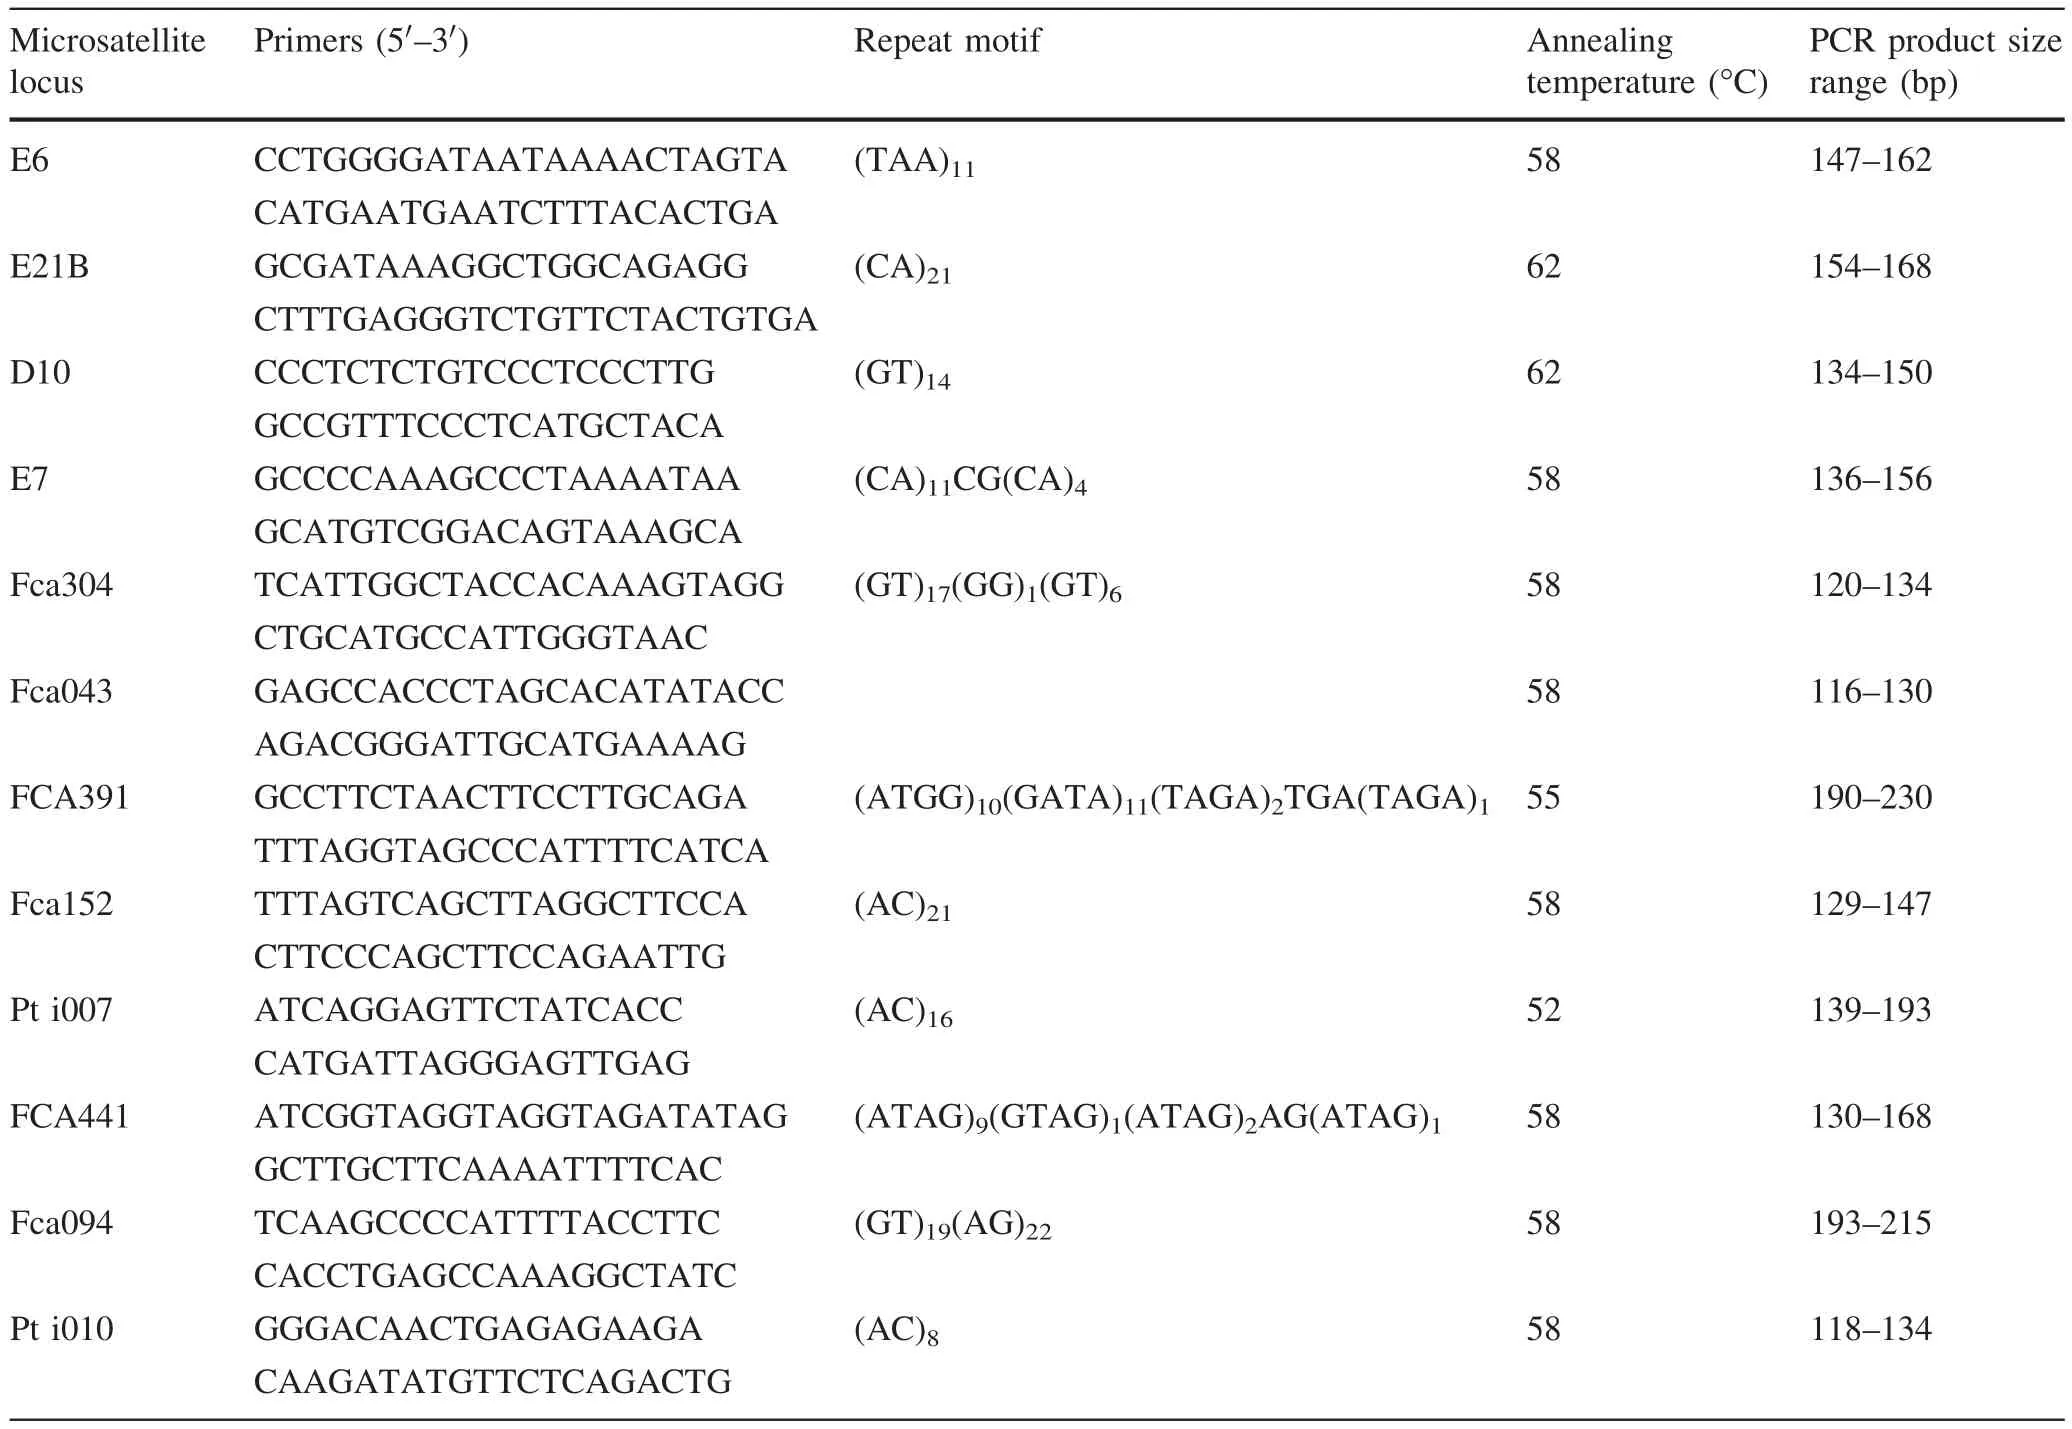
Table 1 Characterizations and conditions of polymerase chain reaction for 12 microsatellite loci of Amur tiger
PCR products were analyzed with an ABI 3100 Automated DNA Sequencer(Applied Biosystems)and genotyping data collected using GeneScan3.1 and Geno-Typer 3.1(Applied Biosystems).Ampli fi cation and genotyping were repeated 7 times for fecal DNA,while for blood DNA,homozygotes whose signals were not perfect were reampli fi ed twice to con fi rm the genotypes as described by Liu et al.(2013).
Evaluation of genotyping correctness at each locus
The blood genotype of each microsatellite locus for each tiger was regarded as 100%correct and used as the standard for our evaluation of genotyping correctness of fecal DNA ampli fi cations.A genotype from a fecal sample at a locus was determined as ‘correct genotyping’when it matched the genotype of blood DNA of the same individual,and as ‘false genotyping’when it failed to match the blood DNA genotyping result.For each locus we calculated the accumulative matching rate of genotypes(Rm)between blood and fecal samples for each locus as the total number of correctly genotyped tigers divided by the total number of genotyping trials:
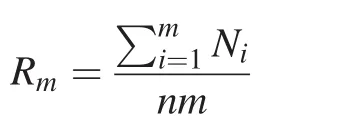
where,Rmis the cumulative matching rate of genotypes between blood and feces when PCR is repeatedmtimes,nthe number of tigers(n=10),andNiis the number of tigers with correct genotyping at theith PCR.The genotyping risk of fecal samples for each locus is then expressed as 1-Rm.
Evaluation of population genetic parameters using fecal samples
Population genetic parameters were computed for blood samples and fecal samples using POPGENE v1.32(Yeh et al.2001),including observed heterozygosity(Ho),expected heterozygosity(He),the number of alleles(A),allelic frequency,effective number of alleles(Aa),and polymorphism information content(PIC).Discrimination power(DP)and the exclusion probability of paternity(EPP)were computed using CERVUS v3.0(Marshall et al.1998).Pearson’s bivariate correlation between genotyping risk(1-Rm)and absolute differences of these parameters between blood and feces groups were calculated using SPSS 13.0.Pairwise relatedness of individuals(rR)was computed by Coancestry v1.0.12 based on genotyping data from blood and feces.Linear regression ofrRbetween blood and fecal samples was analyzed using SPSS 13.0(SPSS,Inc.,Chicago,USA).
Results
Evaluation of genotyping correctness at each locus
For each fecal sample and microsatellite marker,PCR was performed 7 times and the matching rate for genotypes varied from 30–100%,averaging 71%across the 12 loci.According to the association between the cumulative matching rate of genotypes(Rm)and number of PCR repeats,for 8 lociRmplateaued by the third PCR and for 11 loci,Rmplateaued by the fi fth PCR(Fig.1).Pti010 had a fl uctuatingRm,indicating an unstable allele ampli fi cation ef fi ciency for each PCR round.
Rmat the plateau(e.g.after the fi fth PCR)varied signi fi cantly among loci(Fig.1;Table 2).E6 had the greatest plateaued cumulativeRmat 0.871,while Pti007 had the lowest value at 0.357.The mean plateau cumulativeRmwas 0.710±0.139 for the 12 microsatellite loci.
Effects of genotyping error on estimation of population genetic parameters
For each fecal sample and microsatellite locus,PCR was performed 7 times.The fecal genotype of each locus was regarded ascorrectwhen it matched the genotype obtained from a blood sample of the same tiger 4 times or more.Characteristics of the 12 microsatellite loci and comparisons between fecal and blood samples are listed in Table 2.
The number of alleles(A)observed per locus ranged from 3 to 6 for blood samples(¯x=4:25),and from 3 to 5 for fecal samples(¯x=4:08).Allelic frequency was different between blood and feces for all loci except E6.This in fl uenced population genetic parameters based on allelic frequencies.Parameter values calculated from blood samples and fecal samples were differed insigni fi cantly(ttest,allp>0.05)for mean effective number of alleles(mean Aa=2.629 for blood;mean Aa=2.439 for feces),mean expected heterozygosity(mean He=0.616 for blood;mean He=0.597 for feces),PIC(mean PIC=0.543 for blood;mean PIC=0.518 for feces),DP (mean DP=0.228 for blood;mean DP=0.245 for feces),and EPP(mean EPP=0.470 for blood;mean EPP=0.502 for feces).Pearson’s bivariate correlation test showed that genotyping risk(1-Rm)was not correlated with absolute differences in population parameters between blood and fecal samples(He:a=0.431,p=0.161;Aa:a=0.354,p=0.259;PIC:a=0.411,p=0.184;DP:a=0.385,p=0.217;and EPP:a=0.365,p=0.244).

Fig.1 Association between accumulative matching rate of genotypes(Rm)and repeated PCR for each locus
We computed pairwise relatedness(rR)among individuals using blood and fecal genotypes.The range ofrRamong individuals using blood genotypes was-0.36 to 0.22,and the range ofrRamong individuals using fecal genotypes was-0.41 to 0.23.The regression coef fi cient should be 1.0 ifrRvalues of a given individual pair generated from blood and feces are equal,demonstrating that genotyping errors for feces do not in fl uence the estimation of pairwise relatedness.Our results showed thatR2wasonly 0.491,although the linear trend was signi fi cant(p<0.001;Fig.2).This violated the prediction and suggests that genotyping errors in fecal samples in fl uenced the estimation of individual genetic relatedness.
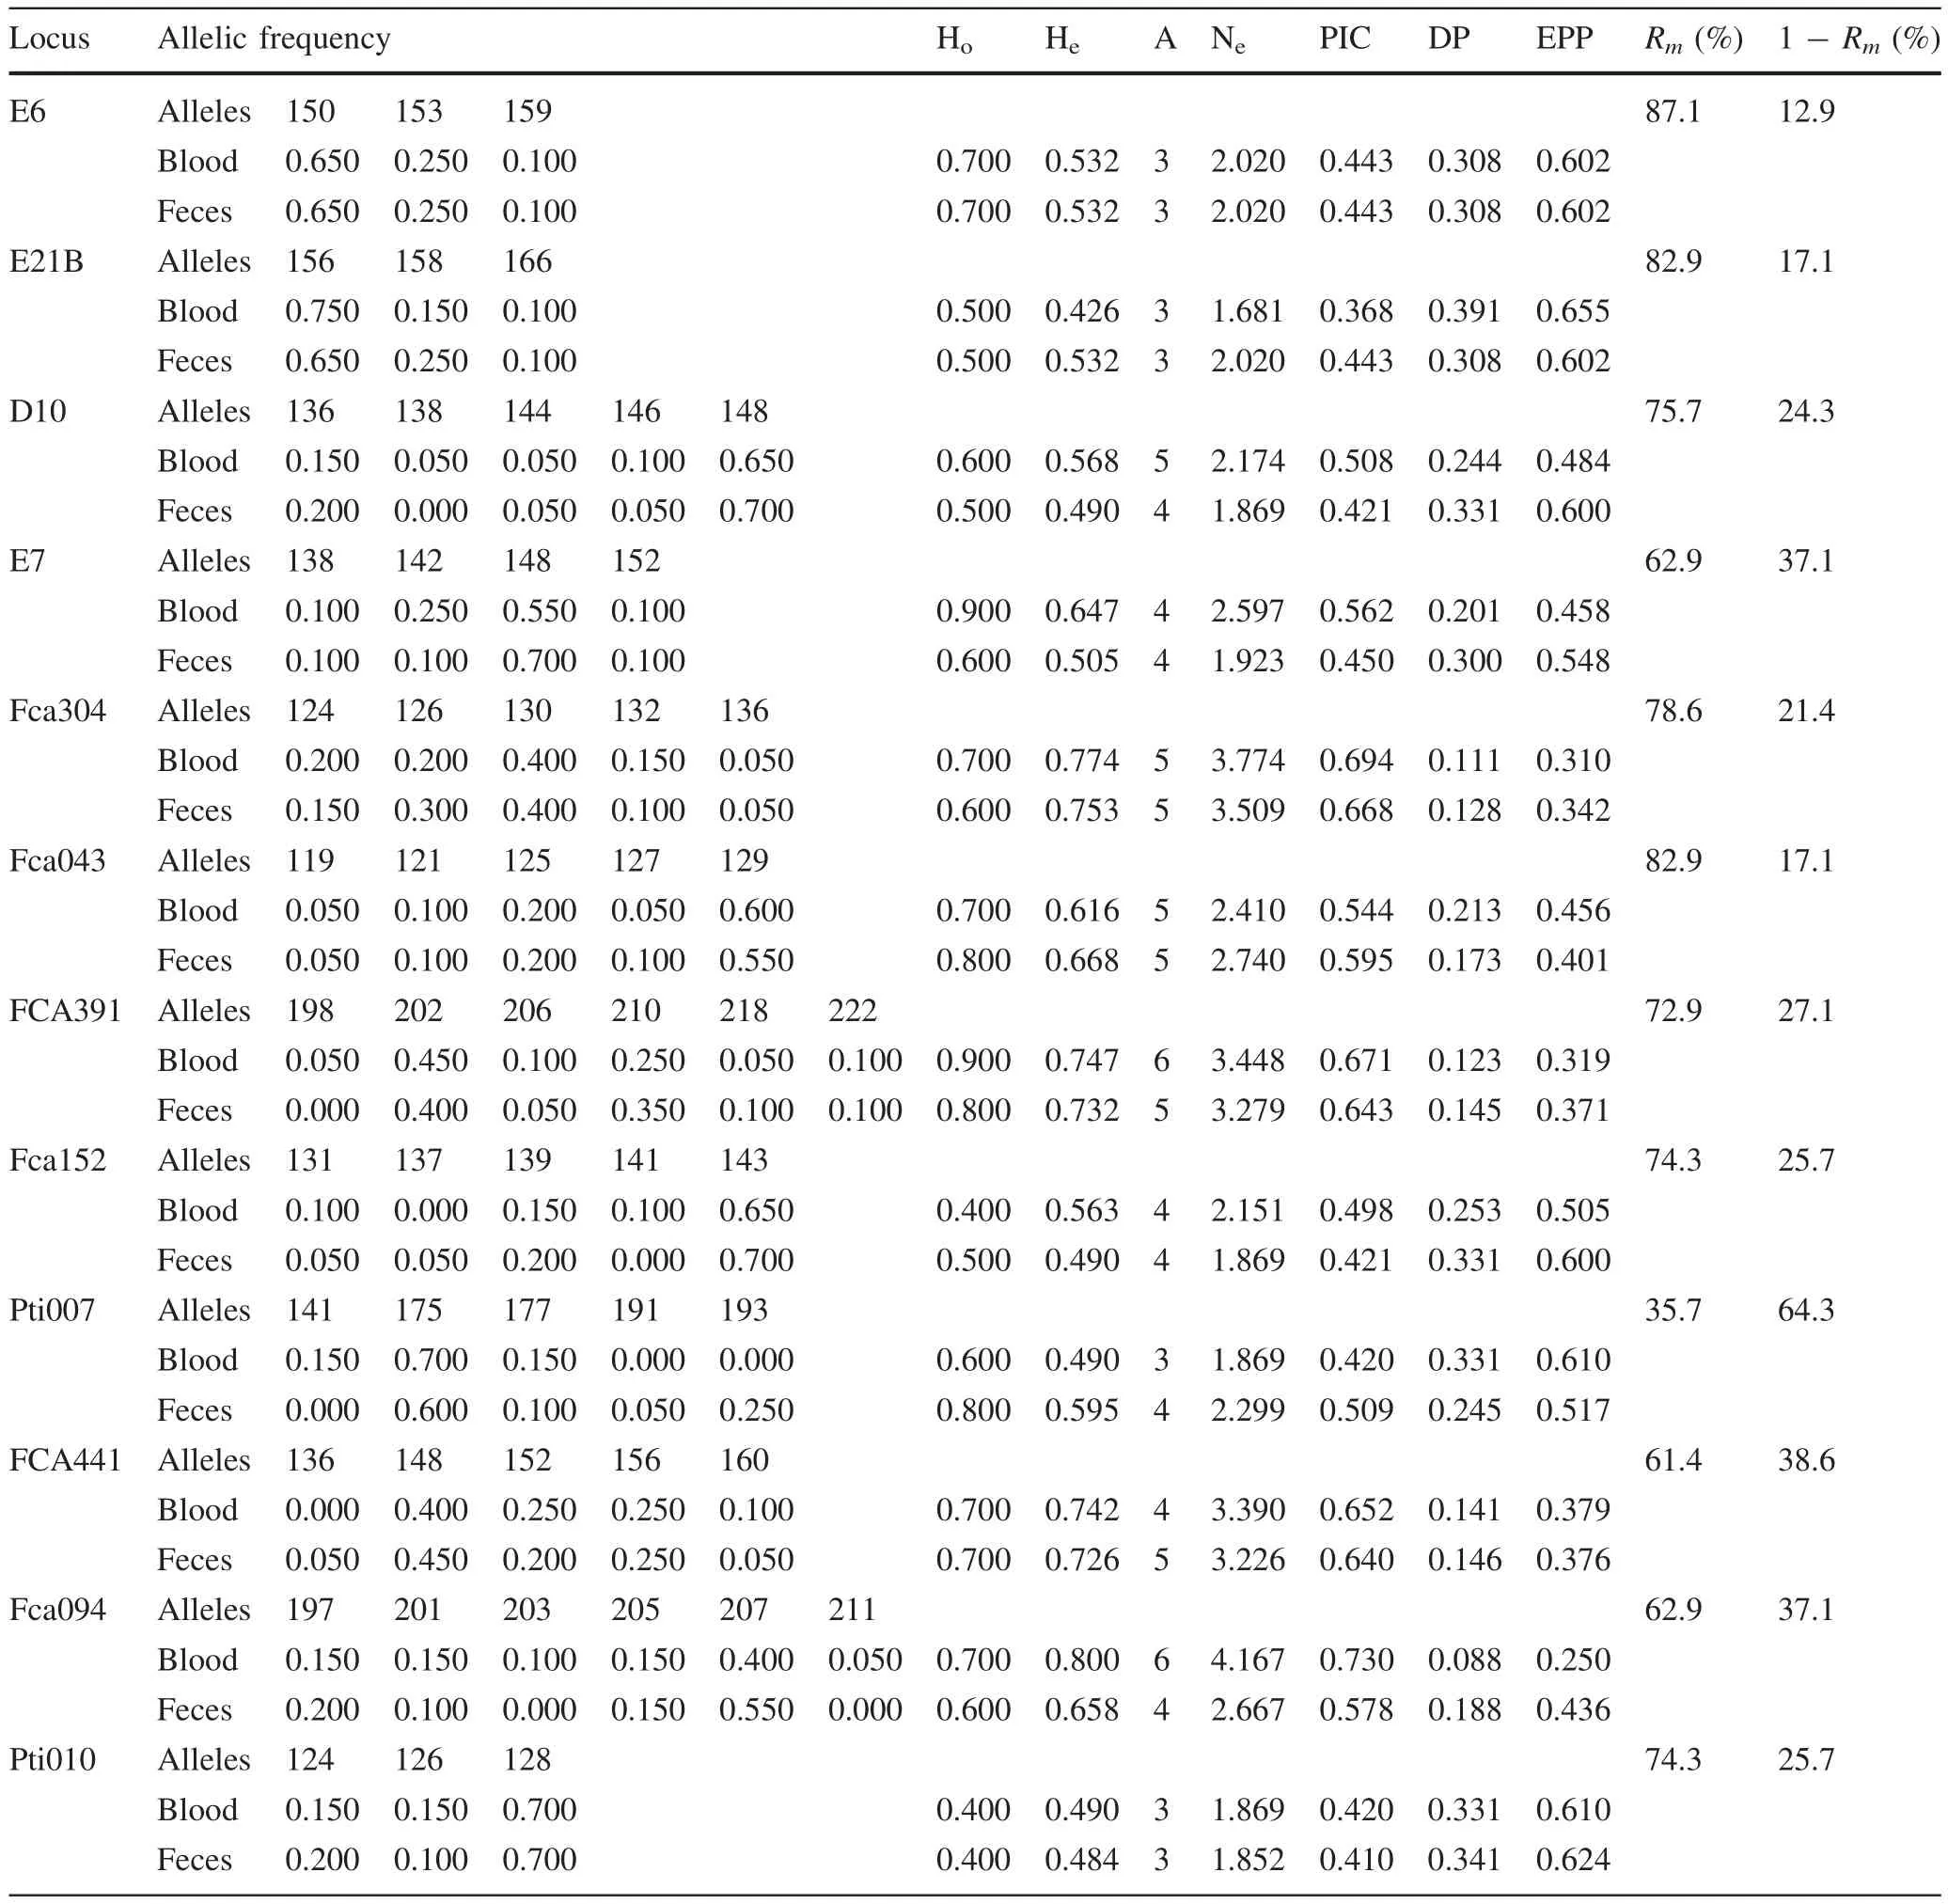
Table 2 Characteristics of 12 microsatellite loci and comparison between fecal and blood samples in a captive tiger population(n=10)
Discussion
The ef fi ciency of genetic analysis using non-invasive samples,particularly feces, is often restricted by microsatellite genotyping errors,leading to inaccurate estimation of population genetic parameters and unreasonable conservation and management strategies(Garshelis et al.2008).Some claim that improvement of genotyping accuracy largely depends on effective sample preservation(Roon et al.2003);however,the quality of feces collected from the wild cannot be guaranteed because of exposure to degradation factors prior to collection(Brinkman et al.2010;Nsubuga et al.2004).Effective preservation and DNA extraction would have limited positive impact on the analysis of poor quality feces(Huber et al.2003).Although multi-tube PCR could reduce the effects of genotyping errors(Taberlet et al.1996),we chose ordinary PCR so that we could effectively control factors(such as reaction temperature)for each locus.Therefore,fecal samples have to be discarded when they are inferior in quality,and laboratory procedures need to be optimized to improve overall genotyping accuracy for samples chosen for analysis.The fi rst step in optimizing laboratory procedures is to assess genotyping risk and any possible impacts on subsequent analyses.
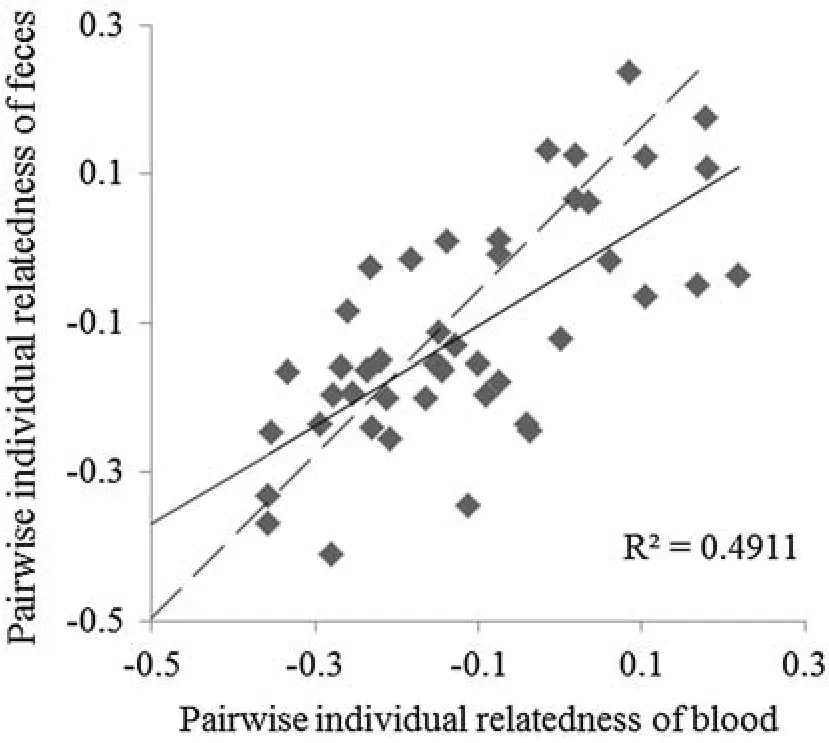
Fig.2 Comparison of Lynch and Ritland-estimator(rR)of pairwise relatedness among individuals between blood and feces genotypes.Dotted line represents the equation y=x
We identi fi ed two sources of genotyping error resulting from laboratory procedures,viz.PCR ampli fi cation and the nature of the microsatellite fragment.Our index cumulative matching rate of genotypes(Rm)contained information about both sources of error.
For PCR ampli fi cation,theRmof 12 microsatellite loci plateaued after 3–5 PCRs.This suggests that the ampli fication ef fi ciency of alleles fl uctuated due to a poor effective template,and each PCR had a certain genotyping risk.The quality of fecal samples used in this study was good overall because they were collected within 12 h after defecation and stored at-20°C.In northeast China,cold weather and deep snow can also preserve samples quite well in winter in the fi eld.However,PCR repeats may be required to achieveRmplateau in fecal samples of poor quality collected in other seasons.
Rmalso demonstrated that different microsatellite loci have different genotyping accuracies,even when the same batch of samples is used(Table 2;Fig.1).This suggests that each locus might have its own tolerance limit for poor DNA templates.Perhaps uneven degradation patterns of DNA molecules means that some parts are more sensitive to degrading factors(e.g.bacterial nuclease)(Deagle et al.2006)and therefore for the same DNA sample,the effective DNA template content would be lower for some microsatellite loci.Or perhaps secondary structures at a certain primer site differentially impact annealing ef ficiency(Nazarenko et al.2002).Even though annealing can be improved by optimizing annealing temperature or PCR components,such effects cannot be completely removed.Either way,unlike previous reports that assessed overall PCR repeats for a whole panel of microsatellite loci(He et al.2011),our results suggest that genotyping risk should be assessed for each locus.
Genotyping errors did alter population parameters such as Aa,He,PIC,DP and EPP(Table 2),but not in a statistically signi fi cant way,and there was no signi fi cant association with genotyping risk(1-Rm).However,drawing the conclusion that genotyping errors do not impact the estimation of population genetic parameters may be premature.For example,when looking atRmvalues for the 12 microsatellite loci,the lowestRmwas 0.357.We performed PCR 7 times for 10 tigers and according to theRmequation there should be 24.99 tigers correctly genotyped,almost 3 times the real number of tigers we used(n=10).This roughly demonstrates that a tiger could be correctly genotyped 3 times when PCR is performed 7 times.For other loci with higherRmvalues,genotyping would be more reliable;however,the quality of feces varied among tigers and coverage of 3 times might not have covered all tigers.This means that not all tigers would be correctly genotyped and variation in feces quality requires more microsatellite loci with highRmvalues,and vice versa.
In conclusion,genotyping risks for microsatellite loci from fecal DNA are derived from the PCR process and the nature of the microsatellite.Our pilot study designed for Amur tigers was part of a current Amur tiger population monitoring program,and the result will be applied to wild Amur tiger fecal DNA analyses in order to conduct secure genotyping.We recommend that(1)four loci(E7,Fca094,Pti007 and Pti010)are not suitable for genetic research in Amur tigers because of lowRmvalues;(2)theRmof 12 microsatellite loci plateaued differently,and considering limited budgets the ampli fi cation times of a few loci should be increased when loci are used for wild fecal samples;and(3)genetic analysis of wild Amur tigers should be corrected using the genotyping error rate(1-Rm).
AcknowledgementsWe thank the strong support of staff of Heilongjiang Amur Tiger Park.The authors declare no con fl ict of interests.
Arandjelovic M,Guschanski K,Schubert G,Harris TR,Thalmann O,Siedel H,Vigilant L(2009)Two-step multiplex polymerase chain reaction improves the speed and accuracy of genotyping using DNA from noninvasive and museum samples.Mol Ecol Resour 9(1):28–36
Bhagavatula J,Singh L(2006)Genotyping faecal samples of Bengal tigerPanthera tigris tigrisfor population estimation:a pilot study.BMC Genet 7(1):48
Bradley BJ,Boesch C,Vigilant L(2000)Identi fi cation and redesign of human microsatellite markers for genotyping wild chimpanzee(Pan troglodytes verus)and gorilla(Gorilla gorilla gorilla)DNA from faeces.Conserv Genet 1(3):289–292
Brinkman TJ,Schwartz MK,Person DK,Pilgrim KL,Hundertmark KJ(2010)Effects of time and rainfall on PCR success using DNA extracted from deerfecalpellets.Conserv Genet 11(4):1547–1552
Deagle BE,Eveson JP,Jarman SN(2006)Quanti fi cation of damage in DNA recovered from highly degraded samples–a case study on DNA in faeces.Front Zool 3(1):11
Garshelis DL,Wang H,Wang DJ,Zhu XJ,Li S,Mchea WJ(2008)Do revised giant panda population estimates aid in their conservation.Ursus 19(2):168–176
HájkováP,ZemanováB,Bryja J,Hajek B,Roche K,Tkadlec E,Zima J(2006)Factors affecting success of PCR ampli fi cation of microsatellite loci from otter faeces.Mo Ecol Notes 6(2):559–562
He G,Huang K,Guo ST,Ji WH,Qi XG,Ren Y,Jin XL,Li BG(2011)Evaluating the reliability of microsatellite genotyping from low-quality DNA templates with a polynomial distribution model.Chin Sci Bull 56(24):2523–2530
Huber S,Bruns U,Arnold W(2003)Genotyping herbivore feces facilitating their further analyses.Wildl Soc B 31(1):692–697
Liu D,Ma Y,Li HY,Xu YC,Zhang Y,Dahmer T,Bai SY,Wang J(2013)Simultaneous polyandry and heteropaternity in tiger(Panthera tigris altaica):implications for conservation of genetic diversity in captive populations of felids.Chin Sci Bull 58(18):2230–2236
Marshall TC,Slate J,Kruuk LEB,Pemberton JM(1998)Statistical con fi dence for likelihood-based paternity inference in natural populations.Mol Ecol 7(5):639–655
Menotti-Raymond M,David VA,Lyons LA,Scha ffer AA,Tomlin JF,Hutton MK,O’Brien SJ(1999)A genetic linkage map of microsatellites in the domestic cat(Felis catus).Genomics 57:9–23
Murphy MA,Kendall A,Robinson A,Perugini C,Waits LP(2007)The impact of time and fi eld conditions on brown bear fecal DNA ampli fi cation.Conserv Genet 8:1219–1224
Nazarenko I,Pires R,Lowe B,Obaidy M,Rashtchian A(2002)Effect of primary and secondary structure of oligodeoxyribonucleotides on the fl uorescent properties of conjugated dyes.Nucleic Acids Res 30(9):2089–2195
Nsubuga AM,Robbins MM,Roeder AD,Morin PA,Boesch C,Vigilant L(2004)Factors affecting the amount of genomic DNA extracted from ape faeces and the identi fi cation of an improved sample storage method.Mol Ecol 13(7):2089–2094
Panasci M,Ballard WB,Breck S,Rodriguez D,Densmore LD,Wester DB,Baker J(2011)Evaluation of fecal DNA preservation techniques and effects of sample age and diet on genotyping success.J Wildl Manag 75(7):1616–1624
Regnaut S,Lucas FS,Fumagalli L(2006)DNA degradation in avian faecal samples and feasibility of non-invasive genetic studies of threatened capercaillie populations.Conserv Genet 7:449–453
Roon DA,Waits LP,Kendall KC(2003)A quantitative evaluation of two methods for preserving hair samples.Mol Ecol Notes 3:163–166
Rozhnov VV,Sorokin PA,Naidenko SV,Lukarevskiy VS,Hernandez-Blanco HA,Litvinov MN,Kotlyar AK,Yudin VG(2009)Noninvasive individual identi fi cation of the Amur tiger(Panthera tigris altaica)by molecular-genetic methods.Dokl Biol Sci 429(1):518–522
Sambrook J,Fritsch EF,Maniatis T(1989)Molecular cloning:a laboratory manual,2nd edn.Cold Spring Harbor Laboratory Press,New York,p 1626
Sambrook J,Russell DW,Russell DW(2001)Molecular cloning:a laboratory manual(3-volume set).Cold Spring Harbor Laboratory Press,New York,p 2100
Santini A,Lucchini V,Fabbri E,Randi E(2007)Ageing and environmental factors affect PCR success in wolf(Canis lupus)excremental DNA samples.Mo Ecol Notes 7:955–961
Stenglein JL,Barba MD,Ausband DE,Waits LP(2010)Impacts of sampling location within a faeces on DNA quality in two carnivore species.Mol Ecol Resour 10(1):109–114
Taberlet P,Luikart G(1999)Noninvasive genetic sampling and individual identi fi cation.Biol J Linn Soc 68:41–55
Taberlet P,Grif fi n S,Goossens B,Questiau S,Manceau V,Escaravage N,Waits LP,Bouvet J(1996)Reliable genotyping of samples with very low DNA quantities using PCR.Nucleic Acids Res 24:3189–3194
Woodruff DS(1993)Non-invasive genotyping of primates.Primates 34:333–346
Xu YC,Li B,Li WS,Bai SY,Jin Y,Li XP,Gu MB,Jing SY(2005)Individualization of tiger by using microsatellites.Forensic Sci Int 151(1):45–51
SPSS 13.0 for Windows and SmartViewer version 13.0.SPSS,Inc,Chicago
Yeh FC,Yang RC,Timothy BJ,Boyle ZH(2001)POPGENE,the user-friendly shareware for population genetic analysis.Molecular Biology and Biotechnology Centre,University of Alberta,Edmonton,p 10
Zhang YG,Li DQ,Rao LQ,Xiao QM,Liu D(2003)Identi fi cation of polymorphic microsatellite DNA loci and paternity testing of Amur tigers.Acta Zool Sin 49(1):118–123
Zhang WP,Zhang ZH,Xu X,Wei K,Wang XF,Liang X,Zhang L,Shen FJ,Hou R,Yue BS(2009)A new method for DNA extraction from feces and hair shafts of the South China tiger(Panthera tigris amoyensis).Zoo Biol 28(1):49–58
杂志排行

Journal of Forestry Research的其它文章
- Effect of species composition on ecosystem services in European boreal forest
- Analysis of SSR loci and development of SSR primers in Eucalyptus
- Optimal and synchronized germination of Robinia pseudoacacia,Acacia dealbata and other woody Fabaceae using a handheld rotary tool:concomitant reduction of physical and physiological seed dormancy
- Genetic effects of historical anthropogenic disturbance on a longlived endangered tropical tree Vatica mangachapoi
- Genetic variation in relation to adaptability of three mangrove species from the Indian Sundarbans assessed with RAPD and ISSR markers
- Cloning and characterization of geranylgeranyl diphosphate synthetase from Pinus massoniana and its correlation with resin productivity