A Comparison of GaN VS GaAs System Performance
2018-02-21MichaelSchefterMehdiArdavanNorsatInternational
Michael Schefter, Mehdi Ardavan Norsat International
Abstract: Traditionally RF power ampl ifiers used Gallium Arsenide (GaAs) technology which has a well behaved and understood performance. Over the past few years Gallium Nitride (GaN) technology is replacing GaAs because GaN is more ef ficient and has a higher power density resulting in higher power MMICs and FETs.
Subject to system link budgets, we usually want to run a given ampl ifier as close to saturation as possible to minimize CAPEX costs. Running an ampl ifier closer to saturation causes many non-linear effects that can cause link performance degradation and interfere with other users.
To better understand and quantify the differences between GaN and GaAs ampl ifiers and the impact of this on system performance, some ampl ifier and system measurements will be taken. The findings will be documented in a white paper.
Key words: GaN system, GaAs system, performance comparison
1 INTRODUCTION
Traditionally RF power ampl ifiers used Gallium Arsenide (GaAs)technology which has a well behaved and understood performance. Over the past few years Gallium Nitride (GaN) technology is replacing GaAs because GaN is more e fficient and has a higher power density resulting in higher power MMICs and FETs.
GaAs-based amplifiers (block upconverters also known as BUCs and Solid-State Power Ampl ifiers also known as SSPAs)are typically spec ified by their P1dBpoint. The saturated output power (Psat) is usually less than 1 dB higher than P1dB. GaN-based amplifiers are usually rated by their Psatand sometimes using Linear Power (Plinear). There is confusion in the market with customers specifying different powers and it is dif ficult to compare GaN and GaAs devices.
Subject to system link budgets, we usually want to run a given amplifier as close to saturation as possible to minimize CAPEX costs. Running an ampli fier closer to saturation causes some non-linear effects that can cause both self interference and can interfere with other users.
2 GaAs VS GaN
Table 1 summarizes the typical output power and power gain for GaN and GaAs MMICs and FETs. While high power FETs (GaAs and GaN) are available, their power gain is low resulting in a BUC or SSPA requiring several FETs, thus adding to cost and size. An SSPA, which is also part of a BUC, typically uses several ampl ification stages. Each stage must provide enough linear drive level to power the next stage without impacting the overall performance of the amplification chain.So, for example, to achieve an output of nominally 40 W, an SSPA would require one MMIC as a final ampl ification stage or equivalently 3 or 4 FETs to produce the same gain and output power. MMICs combine the gain and output power to reduce the number of discrete stages and reduce size. Unfortunately,the maximum output power of GaAs MMICs is about 8 W and about 50 W for GaN MMICs. Using GaAs MMICs for high power BUC or SSPAs would require power combining which can add to size and cost. A combination of GaAs and GaN MMICs and FETs can be used to optimise the number of discrete ampli fication stages, size, gain and output power.
The GaN devices tend to be more efficient. The Power Added Ef ficiency (PAE) for GaAs MMICs is about half of GaN MMICs (PAE ~ 30 % for GaN and, ~15% for GaAs). GaN devices operate at higher voltages – usually 20 - 28 V while GaAs devices operate in the 6 - 8 V range. This higher voltage means less current for the same output power so PCBA traces can be smaller, thus saving space. Since the GaN operating voltage is closer to the standard supply voltages there is some ef ficiency in DC power regulation. The better ef ficiency of GaN technology may improve MTBF of the product as the devices are not running as hot and the parts count can be reduced.
GaAs and GaN FETs can be high power, but they are usually limited in bandwidth and have low gain especially at their rated output power. While a narrow bandwidth is acceptable for standard frequency bands, it is not a good solution for wide band applications or custom frequency bands.
While GaN devices have many advantages, they do not behave the same as the GaAs devices:
a) GaN devices have softer compression than GaAs devices;
b) GaN devices have more variation over temperature than GaAs devices
The soft compression means P1dBis usually further backed off from saturation in a GaN device than a GaAs device. The soft compression can be problematic in some systems with open loop power control and may require additional dynamic range of the IF input to reach the desired operating point.
Psat vs P1dB vs Plinear
Psat, P1dBand Plinearare all used in BUC/SSPA literature. GaAsbased products are usually rated as P1dB, while GaN products are usually rated as Psatwith a Plinearpoint often mentioned. Each of these output power definitions indicate something different. Psatis the saturated output power – the maximum power achievable. P1dBis the output power where the gain of the BUC/SSPA is 1 dB lower than a small signal gain. Plinearis the output power where a spec ific set of requirements are met such asspectral regrowth or two-tone intermodulation products. While each are an output power, only Plineardirectly provides a measure of intersystem interference.

Table 1 Summary of maximum power and gain for MMICs and FETs
3 SYSTEM REQUIREMENTS
To reduce CAPEX, operators use the lowest power BUC/SSPA they can, based on system link budgets. Regardless of BUC/SSPA technology, the maximum available output power is Psat. Also, regardless of BUC technology, the closer one operates to Psat, the more non-linear effects arise causing both interand intra-system interference. Some measurements of inter- or intra-system interference are:
a) Adjacent Channel Power Ratio (ACPR) or Spectral Regrowth (SR)
b) Two-Tone Intermodulation (TTIM)
c) Amplitude Deviations to Phase Deviation (AM-PM)
d) System Bit Error Rate (BER)
ACPR and SR
ACPR is the ratio between the power contained in main channel and the power contained in an adjacent channel. A simpler metric is spectral regrowth which is a ratio between the power at center frequency of the main channel and the power at a speci fied offset. ACPR or SR is often spec ified by satellite systems or satellite networks as a requirement. Table 2 summarizes some spectral regrowth requirements:
Some satellite networks can tolerate higher spectral regrowth.

Table 2 Summary of spectral regrowth requirements
TTIM
Closely related to spectral regrowth is intermodulation,Two-tone intermodulation is often specified as a requirement with the most common requirement of TTIM < -25 dBc (MILSTD-188-164).
AM-PM
AM-PM is a measure of phase deviations caused by amplitude deviations and is especially important for phase modulated signals. AM-PM is less likely to be used as a requirement for satellite operators but is often used by network operators.
BER
The system BER is a good indication of self interference and ultimately is the measure of system health.
4 COMPARISON OF SYSTEM PERFORMANCE
To compare the system performance using GaN and GaAs technologies, two similarly rated BUCs are compared. Performance at several operating points are contrasted. The spec ific BUCs used were:
a) Norsat Atom series 40 W GaAs – rated as 40 W P1dB
b) Norsat Atom series 40 W GaN – rated as 40 W Psat
For the spec ific BUCs measured, the Psatfor the GaN BUC was 46.3 dBm and the Psatfor the GaAs BUC was 47.1. All measurements were taken at 14.125 GHz and at room temperature. In all cases the rated power (Psator P1dB) exceeds the stated value. The measurements and results should be considered typical and could change from BUC to BUC.
Gain
In Figure 1, the gain vs input power for a GaN and GaAs BUC are compared.
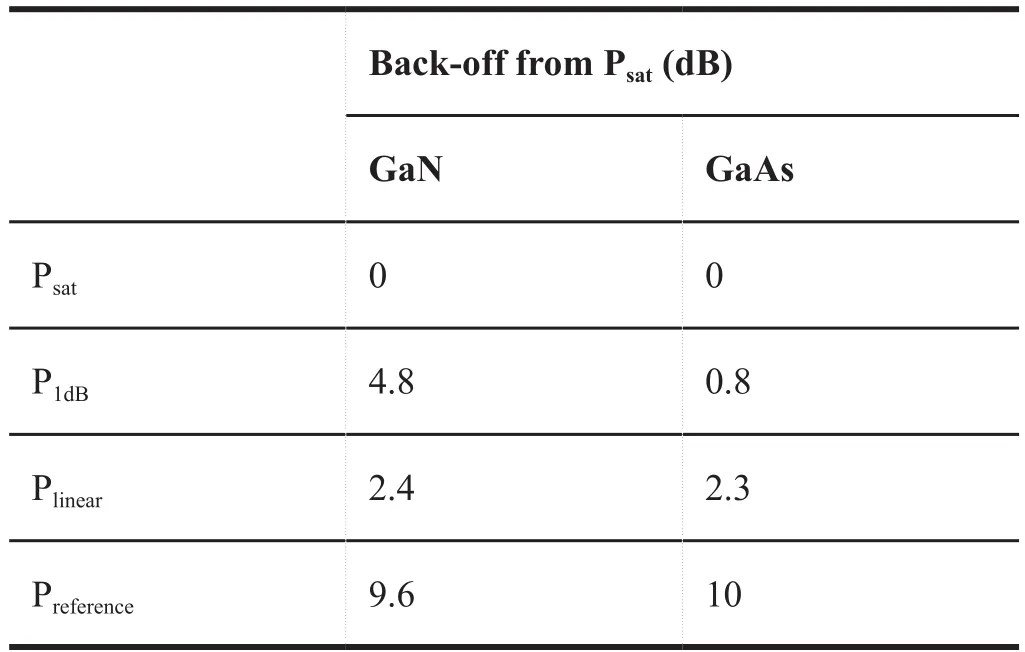
The chart shows the soft compression of the GaN BUC.Table 3 summarizes the key output power ratings and shows the relative back-off from Psat. Plinearis defined as the output power where the spectral regrowth is -30 dBc.
As can be seen back-off from Psatfor P1dBis much larger for the GaN device as would be expected with soft compression. Also,the GaAs P1dBis less than 1 dB backed off from Psatalso as expected.Despite the large difference in P1dBback-off, the Plinearback-off is almost the same. Preferenceis a typical low signal output and should not be affected by non-linearities seen closer to saturation.

Figure 1 Gain vs input power for GaAs and GaN BUC

Table 3 Common BUC power ratings and their output from saturation
Spectral Regrowth
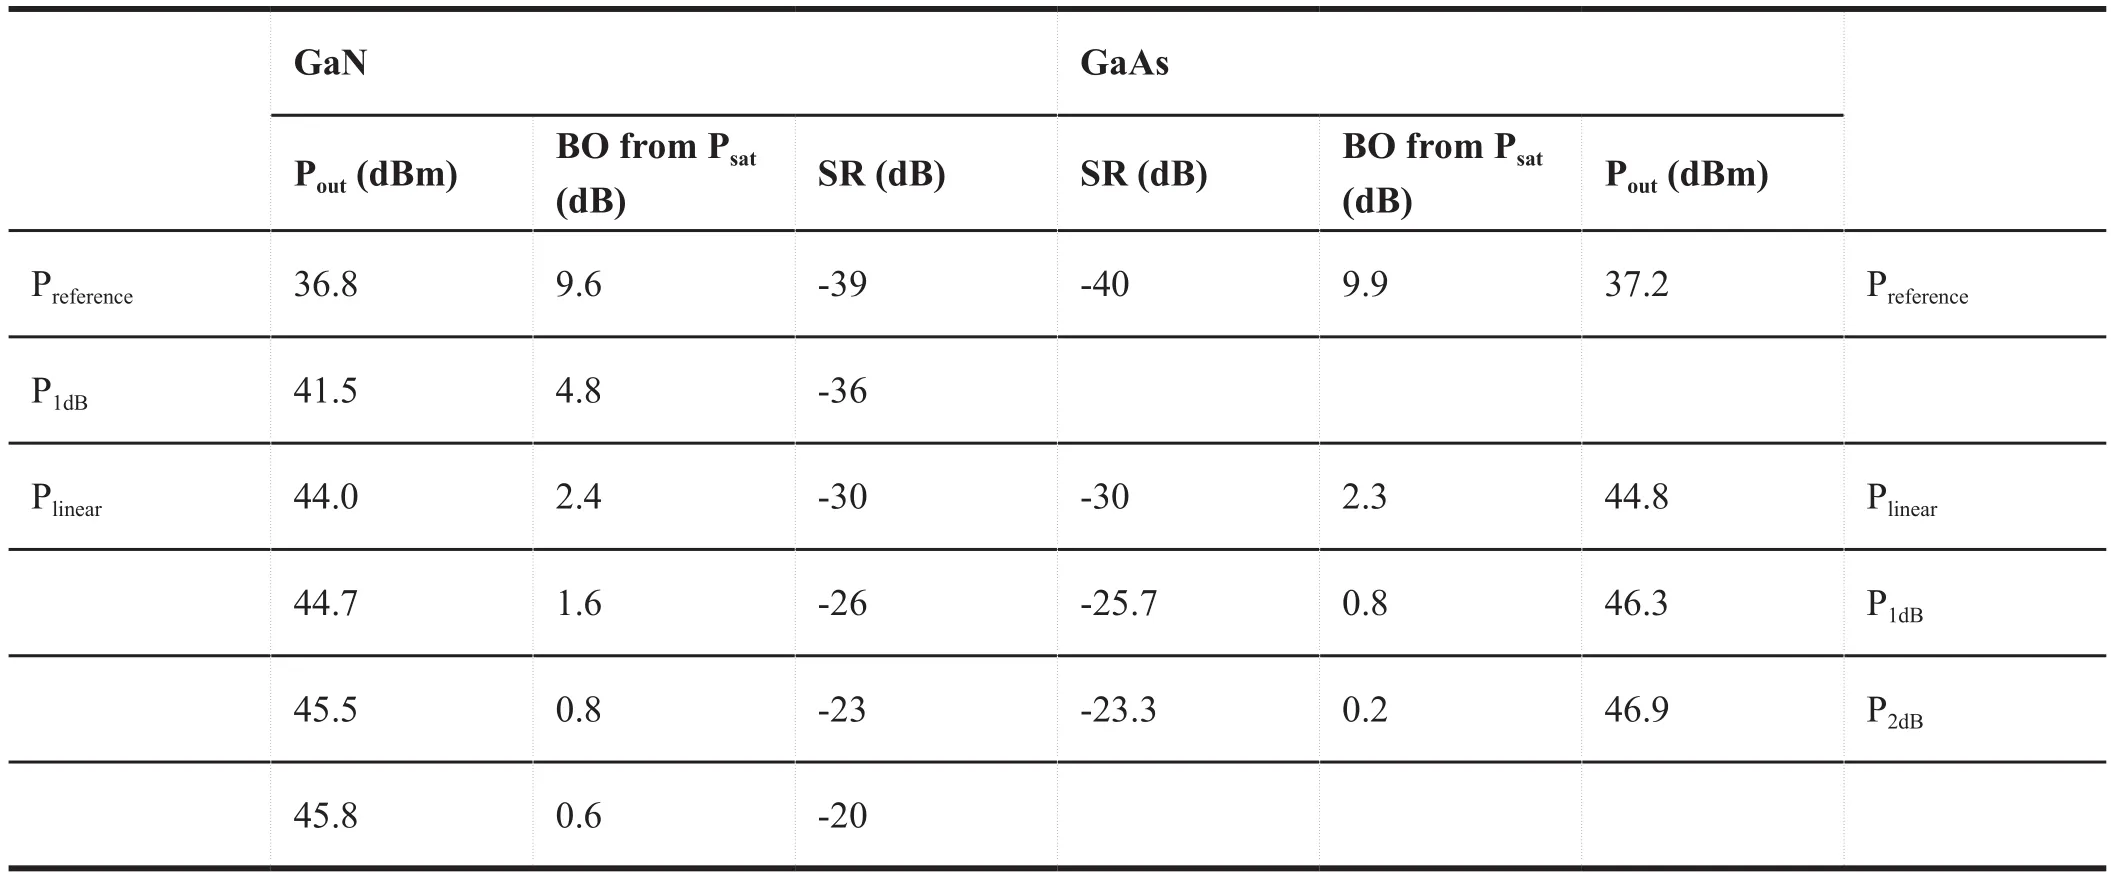
Table 4 compares the Poutand back-off from Psatof the GaN and GaAs BUC at several spectral regrowth levels. In this table,Plinearis de fined as the output power where spectral regrowth is-30 dBc using 2.6 MSps. The spectral regrowth can be different at different symbol rates.
As expected the spectral regrowth at the GaN P1dBis much better than the spectral regrowth at the P1dBpoint of the GaAs BUC since it is much further backed off from saturation. The spectral regrowth worsens faster as back-off from saturation is reduced for the GaN vs GaAs BUC. Table 5 highlights Poutfor GaN vs GaAs BUCs at spectral regrowth of -30 dBc and at a spectral regrowth of -26 dBc.
While the GaN Poutcorresponding a spectral regrowth of-30 dBc is lower than the GaAs BUC, but the output back-off from saturation is almost the same. The corresponding GaN Poutfor a spectral regrowth of -26 dBc is about 44.7 dBm, while the GaAs Poutis about 46.2 dBm. The output from saturation is larger for the GaN than the GaAs.
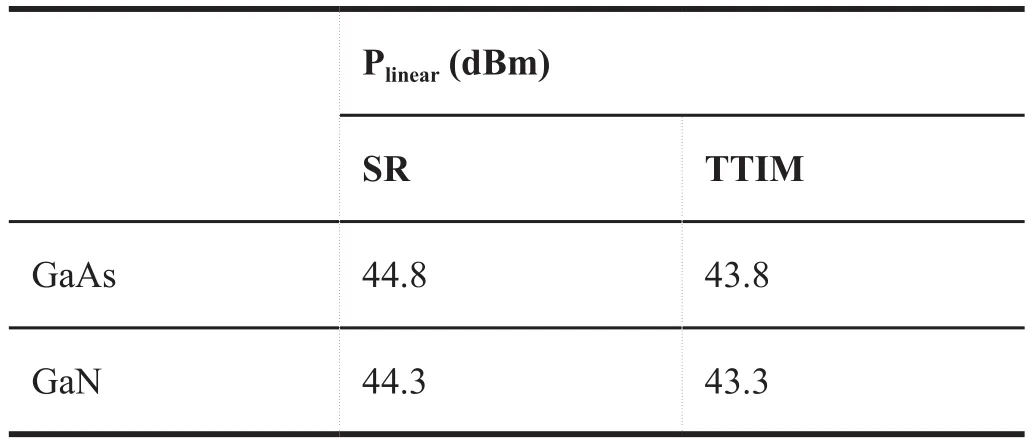
MIL-STD-188-164 offers two de finitions of Plinear, TTIM and spectral regrowth. The spectral regrowth de finition is used for single-carrier systems. For multi-carrier systems Plinearis de fined as the minimum Poutfor spectral regrowth < -30 dBc and Poutfor TTIM < 25 dBc. The Plinearresulting from these two de finitions is slightly different. Table 6 compares the Plinearoutput powers for the various de finitions and technology. The symbol rate for the spectral regrowth is 2.6 MSps and the TTIM tone spacing is 2.6 MHz.

Table 4 Pout and output from saturation for different spectral regrowth

Table 5 Pout for spectral regrowth of -30 dBc and -26 dBc
AM-PM
Table 7 summarizes the AM-PM performance at several output powers for the GaN and GaAs.
Performance up to Plinearis similar between the two technologies. At higher output powers, closer to saturation, AM-PM increases rapidly.
BER
The BER was measured for various output powers for the GaN and GaAs BUCs. Output powers from Preferenceto about46 dBm were tested. In each case the signal and noise power were adjusted to maintain a constant Eb/No of 4.0 dB as reported by the modem. The signal used was QPSK with a rate½ Viterbi FEC. There was little difference in the BER between the lowest output powers and the highest. There was little difference between the GaN and GaAs BUC performance.

Table 6 Comparison of Plinear using SR and TTIM

Table 7 Summary of AM-PM for various output power
5 CONCLUSIONS
The test results show similar performance between GaN and GaAs BUCs for most parameters except SR and TTIM. The Psatof a 40 W P1dBGaAs BUC is up to 1 dB higher. So, a GaAs BUC rated at 40 W P1dBwill have a Psatof up to 50 W.
Review of SR and TTIM performance of GaAs and GaN based on back-off from saturation shows that both GaN and GaAs behave similarly up to Plinear. In the example above, Plinearfor both BUCs is about 2.3 - 2.4 dB below saturation. Above Plinearthe GaN SR degrades more quickly with output power. At the point where SR is -26 dBc, the GaAs BUC is about 0.9 dB from saturation, while the GaN BUC is 1.6 dB below saturation.
If you assume that the operating point of the GaAs BUC is the rated P1dB, the SR is about -26 dBc, the equivalent operating point of the GaN device rated at Psatwill be about 1.6 dB below this for a QPSK system.
Neither GaN nor GaAs is technology “better” than the other, it depends upon the unique requirements of each application to determine the best technology for the job.
