Remaining useful life prediction based on variation coefficient consistency test of a Wiener process
2018-02-02JunLIBoJINGHongdeDAIXioxunJIAOXiodongLIU
Jun LI,Bo JING,Hongde DAI,Xioxun JIAO,Xiodong LIU
aCollege of Aeronautics and Astronautics Engineering,Air Force Engineering University,Xi’an 710038,China
bCollege of Mathematics and Statistics,Ludong University,Yantai 264025,China
cDepartment of Control Engineering,Naval Aeronautical and Astronautical University,Yantai 264001,China
dChina Aviation Industry Jincheng Nanjing Electrical and Hydraulic Engineering Research Center,Nanjing 210000,ChinaeAviation Science and Technology Key Laboratory of Aviation Mechanical and Electrical System,Nanjing 210000,China
1.Introduction
With the increase of reliability and lifetime,it is difficult to obtain failure data of products in a short term,so the traditional failure data based Remaining Useful Life(RUL)prediction methods are limited in utilization.1,2Fortunately,failures of most products are a result of slow degradation of materials,which can be reflected by some performance characteristics gradually.3Therefore,reliability and RUL research based on degradation data gains much attention all over the world,and becomes the key point of Prognostic and Health Management(PHM).4
Degradation modeling is the core problem of RUL prediction.Considering the complex mechanism of a failure,it is dif-ficult to establish a physical failure model for some products with high reliability and long life,while a data-driven statistical method owns obvious advantages.4,5A random effects degradation model was applied to describe unit-to-unit variations of test units and studied for highly reliable light displays in Ref.6,such as Plasma Display Panels(PDPs)and Vacuum Fluorescent Displays(VFDs).The random effects model is a stochastic variable model,which cannotexpress a dynamic degradation process with time.Therefore,a stochastic process based life prediction method has been developed.The random effects model and the stochastic process model were compared by Peng and Tseng.7A stochastic diffusion process was described in detail in Ref.8,and the Mean-Time-To-Failure(MTTF)of a real Light Emitting Diode(LED)under accelerated testing was achieved.The Gamma process9and the inverse Gaussian process10,11have been extensively applied to degenerate modeling due to their good statistical properties.The random trajectory model and the stochastic process model have been reviewed in Ref.12.Compared to the Gamma process and the inverse Gaussian process,the Wiener process can express the non-monotonicity of the degeneration trend,which has gained great attention.In Ref.13,a Wiener process with a measurement error was used to study the RUL of a lithium battery.In Ref.14,the Wiener process was applied to study accelerated step stress degradation.In Ref.15,the real-time update of RUL prediction was realized by a Wiener process accompanied with recursivefiltering.A new class of Wiener process was proposed in Ref.16,which considers the correlation between the drift parameter and the diffusion parameter,and the proposed Wiener process was demonstrated by a dataset of fatigue crack growth and a dataset of head wears of hard disk drives.Parameters estimation is a part of the major problems in degradation modeling of a Wiener process.Maximum Likelihood Estimation(MLE)is the most widely researched method in the Refs.17–19.However,it is difficult to realize an asymptotically unbiased estimation based on MLE,while the number of samples or the number of observations is small,which may lead to large errors of estimated parameters.Therefore,an unbiased parameters estimation method of the Wiener process in a small-sample case is very important.To solve this problem,an unbiased parameters estimation method for the Wiener process based on modified MLE is proposed.
Degradation modeling is often researched under the assumption of mechanism consistency in Refs.20,21.Whether the information of different samples or the different stages of the same sample can be fused is based on the consistency of the degradation pattern,so the consistency problem is still ubiquitous in practical engineering.For example,limited by the cost and the actual situation,only a small sample of degradation data can be achieved.A failure happens when degradation reaches a given threshold,22,23and the product can continue to work by replacing some components.Whether the degradation data before the maintenance can be used in RUL prediction after the maintenance is based on the consistency of the degradation data before and after the maintenance,which has never been studied before.Aiming at this problem,considering the independent incremental feature of the Wiener process,a Wiener process variation coefficient based consistency test method is proposed,which is not affected by the sampling time and is suitable for small samples.
The remainder of this paper is organized as follows.Section 2 introduces the basic theory of the Wiener process and RUL.In Section 3,a modified unbiased MLE method is proposed based on the statistical properties of the Wiener process,and simulations are studied.A Wiener process variation coef-ficient based consistency test method is introduced in Section 4,where simulation data and classic crack data are used for validation of the proposed method.In Section 5,the degradation of an airborne fuel pump is studied,and the RUL prediction after maintenance is discussed;while the consistency test is passed,the work provides a theoretical and practical guidance for engineering.
2.Basic theory of Wiener process and RUL
Let{X(t),t≥ 0} be a continuous random process which satis-fiesX(0)=0,tis time,if any two disjoint time intervals with stationary independent increments ΔX(t)=X(t+ Δt)-X(t)obey normal distribution and satisfy

where Δtis the time interval.The Wiener process{X(t),t≥ 0}is given by

where θ denotes the drift parameter and σ(σ > 0)the diffusion parameter,whileB(·)denotes the standard Brownian motion function.
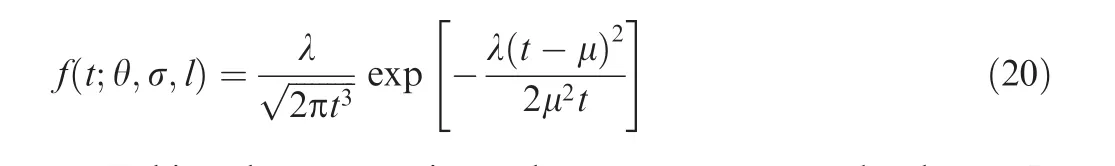
The degradation process can be described by {X(t),t≥ 0}.ldenotes the failure threshold,ξ is defined as the life of the product which is thefirst time arrived at the failure thresholdl,then ξ =inf{t|X(t)≥l} is a random variable of inverse Gaussian distribution,and the distribution functionF(·)and Probability Density Function(PDF)f(·)are given by24
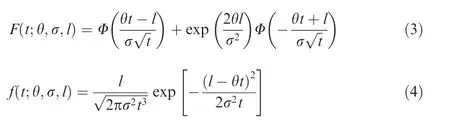
where Φ(·)is standard normal distribution function.
If the degradation dataX(tk)=xkis obtained,denote the RUL attkast,the condition distribution function is shown as
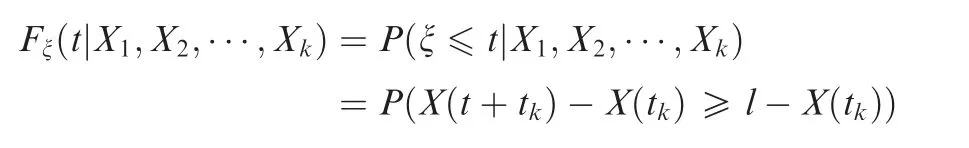
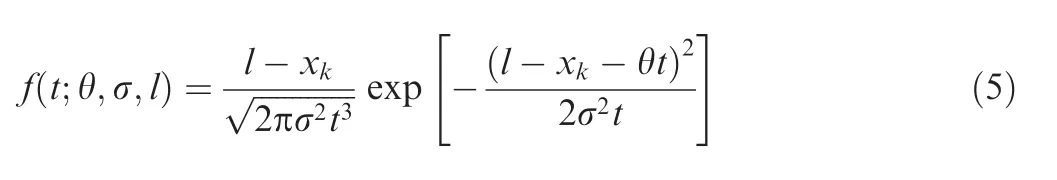
whereP(·)is the probability expressions.As the Wiener process is an independent increment process,the condition distribution function of the RUL can be simplified as15

Replacing the failure thresholdlbyl-xkin Eq.(4),the density function of the RUL can be get as
3.Unbiased parameters estimation for Wiener process
For productsi(i=1,2,···,n),measuredmi+1 times respectively,Xijdenotes thejth measurement about degradation data of theith product.ΔXij=Xi(j+1)-Xij(j=1,2,···,mi)denotes the degradation increment in Δtij=ti(j+1)-tij,considering a constant time interval,that is,Δtij= Δti,and if the time intervals are equal to each other for different products,then Δtij= Δti= Δt.Every product includesmi(i=1,2,···,n)degradation increments.
3.1.Maximum likelihood estimation
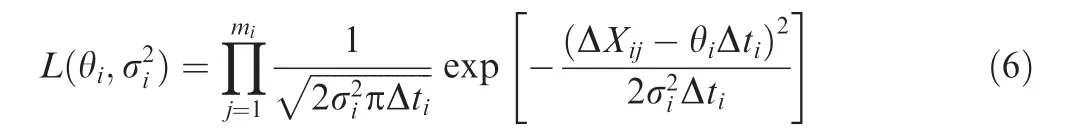
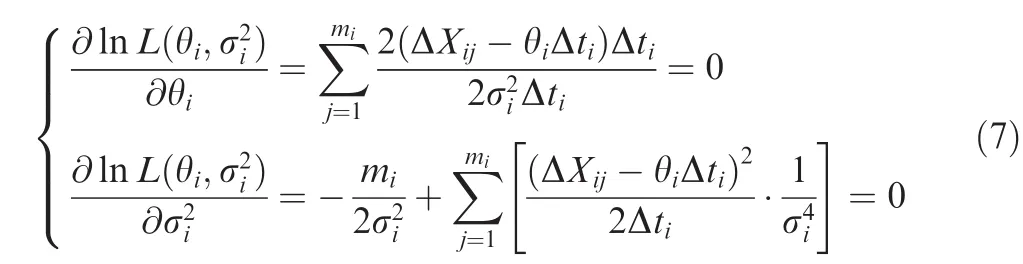
The MLE is widely used in the parameters estimation of the Wiener process.18,19Considering the independent increment of the Wiener process as ΔXij~N(θiΔti,σ2iΔti),the likelihood functionL(·)is established as
Deriving the partial differential of Eq.(6),we have
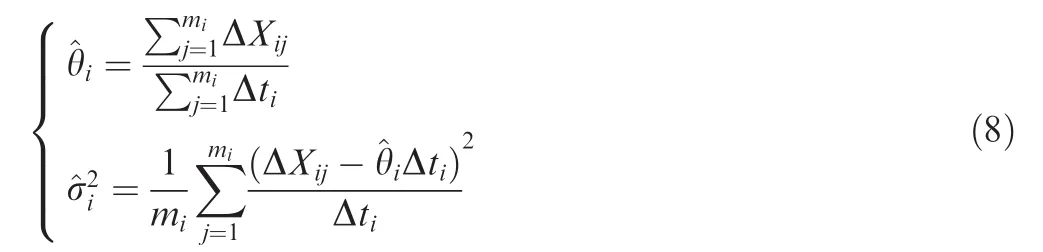
The MLEs for θiand σ2ican be get as


Proof.According to Eq.(8)and Δtij= Δti,
According to the property of the Wiener process in Eq.(1),E(ΔXij)= θiΔti,so


3.2.Modified maximum likelihood estimation
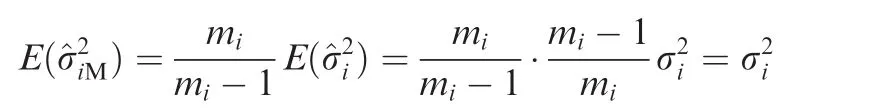
By Theorem 1,the modified MLE^θiMof θiand^σ2iMof σ2iare
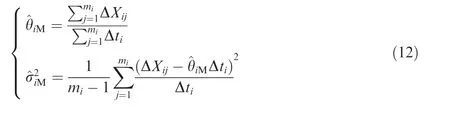
Theorem 2.The modified estimations shown in Eq.(12)are unbiased estimations.
Proof.
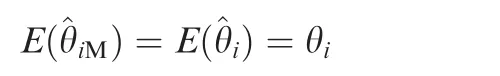
Considering the result of Eq.(11),then
Corollary.For a small sample number capacity of n,the estimations for^θ,^σ2can be written as

3.3.Simulations
Simulations have been done for the verification of the presented unbiased parameters estimation method while the sample numbern=1,drift coefficient θ =5 × 10⁻⁵,diffusion parameter σ =2.5× 10⁻⁴,and sampling periodT=100.The number of observations about the incremental degradation arem=10,m=100,andm=1000,respectively.The degradation paths are shown in Fig.1.
Whenm=10,forn=5,10,the degradation paths are shown in Fig.2.

Fig.1 Degradation paths(n=1).

Table 1 Parameter estimations(n=1).
The parameters estimated by the two methods are shown in Table 2.Obviously,the modified estimations are better than those of the MLE method for differentn.

Fig.2 Degradation paths(m=10).

Table 2 Parameter estimations(m=10).
4.Consistency test based on variation coefficient of a Wiener process
Whether the information of different samples or the different stages of the same sample can be fused is dependent on the consistency of degradation patterns,so the consistency problem is ubiquitous in the practice of engineering.Aiming at the problem of the verification of the consistency,a failure mechanism and degradation model based consistency testing method was proposed in Ref.25,but the ratio of the mean to the variance needs to satisfy a normal distribution,which leads to be inapplicable when the number of samples is small.A rank correlation coefficient based consistency test for the failure mechanism was introduced in Ref.26according to the synergy of different products,but it is influenced by the length of the sampling period.In this paper,according to the incremental independence of a Wiener process,a consistency test method is proposed,based on the Wiener process variation coefficient.
4.1.Variation coefficient
The variation coefficient of a normal distribution was discussed clearly in Ref.27,such as the statistical characteristics,the confidence intervals,and the hypothesis testing methods.The variation coefficient ν is defined as the ratio of the standard deviation to the average.

The variation coefficient is a dimensionless number.For a Wiener process, considering equal time intervals Δtij= Δti=tij-ti(j-1),the variation coefficient νiin theith interval for a product is defined as
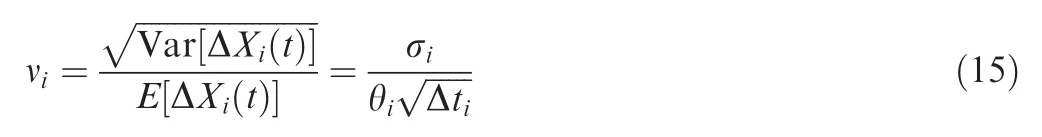
Represent the diffusion level under unit drift.If the distribution of a νicontained statistic is known,hypothesis testing of the variation coefficient can be achieved according to the sampling distribution theorem.In Ref.27,a sampling distribution about the reciprocal of the variation coefficient was constructed,for samples from a normal population,which was applied to the reliability evaluation of a bridge structure.
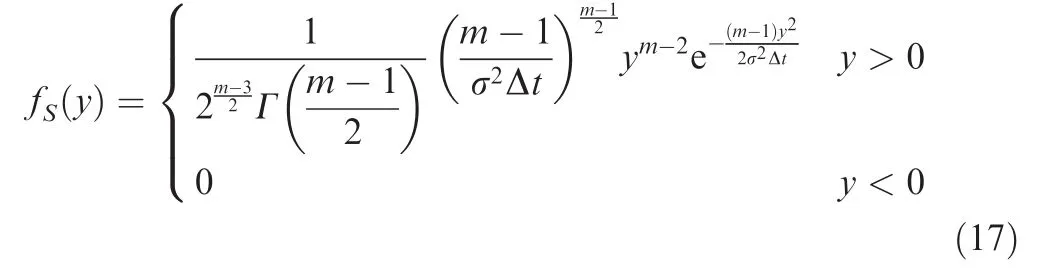
A consistency test method based on the variation coefficient of a Wiener process is presented here,considering the normal characteristic of an independent increment from the Wiener process.Inspired by Ref.27,a theorem is presented as follows.


By the proof in Ref.27,we can have the density function ofSisfS(·)for the Wiener process as

4.2.Consistency test
According to Theorem 3,the consistency test based on the variation coefficient of a Wiener process is proposed as follows:

(5)Calculate h according to the samples observation values.Ifhfalls into the rejection region,the null hypothesis is rejected,which means that the sample variation coeffi-cient has a remarkable difference from the population variation coefficient;otherwise,the null hypothesis is accepted.
4.3.Simulations and experiment
Ten groups(n=10)of degradation data are generated by simulations.The sampling periodT=100,and the number of observations is 20,so the number of increments ism=19.
(1)If θ1=5 × 10⁻⁵and σ1=2.5 × 10⁻⁴,the degradation path is shown in Fig.3(a).For one new sample with θ2= θ1=5 × 10⁻⁵and σ2=5 × 10⁻⁴,the degradation path is shown in Fig.3(b).
(2)When θ1=5 × 10⁻⁵,σ1=2.5 × 10⁻⁴,the degradation path is shown in Fig.4(a).For one new sample with θ2=10×10-5and σ2= σ1=2.5×10⁻⁴,the degradation path is shown in Fig.4(b).
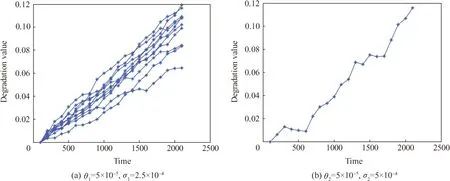
Fig.3 Degradation paths for different σ.

Fig.4 Degradation paths for different θ.

Fig.5 Crack growth paths.
(3)The classical crack data28is also utilized for the verification of the presented Wiener process variation coeffi-cient based consistency test method.Without loss of generality,assuming that Δt=1 and 13 measurements are contained in each data set,then m=12.M1 to M7 are the population and V1 to V6 are the testing samples.The crack degradation trend is shown in Fig.5(in Fig.5,1 in.=2.54 cm).

In fact,they came from the same population,but the trend of the variation can be clearly seen by the value ofhstatistics.For example,hV6=0.8325 is farthest from the rejection region,the degradation trend is nearest to the population,and the effectiveness of the proposed method is verified.
5.Application research
The fuel pump is one of the important equipment in an aircraft,and RUL prediction is crucial to the safety of the aircraft.The cooperation between each component of the fuel pump is important,the failure mechanism is complex,and themain failureformsareflow-reduced and pressuredropped.The output pressure of the fuel pump is closely related to the healthy status of the fuel pump,which is found in the pre-research by the authors.29Therefore,the output pressure signal of the fuel pump is chosen as an index of performance degradation.
A piezo-resistive pressure transducer(CY-YZ-001)is chosen in the experiment system,which can transfer a pressure signal to a voltage signal directly,and the pressure transducer is mounted in a transfer tube 70 cm far from the output of the fuel pump.Fig.6 shows the pressure transducer and its installation,and the components of the experiment system were shown in Fig.7.
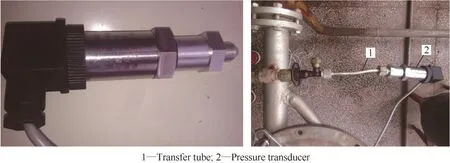
Fig.6 Pressure transducer and its installation.
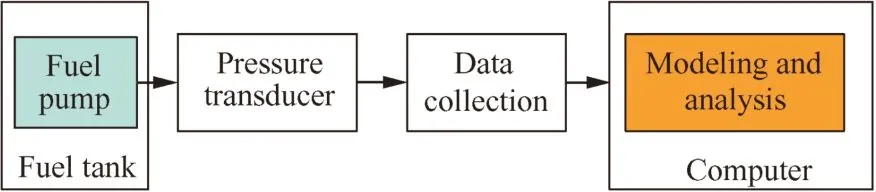
Fig.7 Components of the experiment system.
5.1.Basic data analysis
An experiment under circulations of three voltages has been conducted for the airborne fuel pump,in which each circulation is 10 h including three processes:(A)voltage:207–209 V,frequency:420–422 Hz,0.5 h;(B)voltage:185–187 V,frequency:378–380 Hz,0.5 h;(C)voltage:192–202 V,frequency:398–402 Hz,9 h.Each cycle is 10 h,so Δt=10 h.The output pressure signal of the fuel pump from the pressure sensor is recorded in the experiment.As a highly reliable product,the degradation of the fuel pump is slow and takes a long time.Observations from three samples are recorded asZ1,Z2andZ3,as shown in Fig.8,and the degradation trends are all obvious.According to the experience of engineering applications,the threshold value is chosen as 61.3 kPa.
When the output pressure of the fuel pump is lower than the threshold value,maintenance about replacing some inner parts of the fuel pump has been done,then the experiment is continued,and the degradation data is recorded asZ2H,which is shown in Fig.9.
It is appropriate to model the degradation by a Wiener process,while the degradation increment obeys a normal distribution.The Quantiles-Quantiles(QQ)figure is a method of comparing an unknown probability distribution with a speci-fied distribution.If the two distributions are similar,the QQfigure points will be around the 45°line.Computing the increments of the degradation data in Fig. 8,ΔZi=Ai=Zi(t)-Zi(t-1),t=1,2,···,mi;i=1,2,3. By the QQ graph shown in Fig.10,degradation incrementsA1,A2,A3obey normal distributions,and the Wiener process is appropriate for degradation modeling.

Fig.8 Pressure sensor output value before maintenance.

Fig.9 Pressure sensor output value after maintenance.

Fig.10 Quantiles-quantiles graph for normal distribution.
5.2.Parameters estimation and consistency test
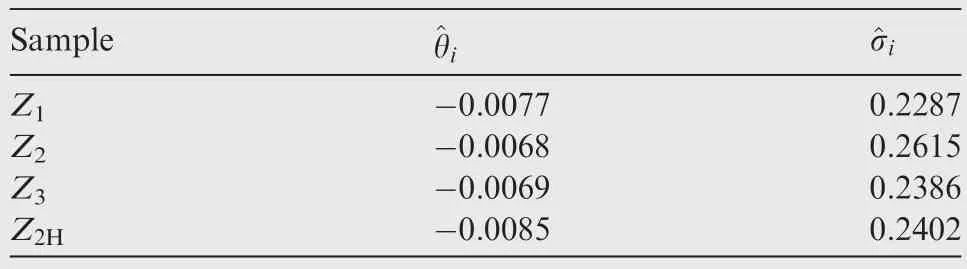
Table 3 Parameters estimation for θiand σi.
5.3.RUL estimation

Taking the pre-repair productZ2as an example,the RUL results of the Wiener process based on the modified MLE are shown in Fig.11.The true value is included in the predicted probability density function,and the prediction of the RUL is realized.

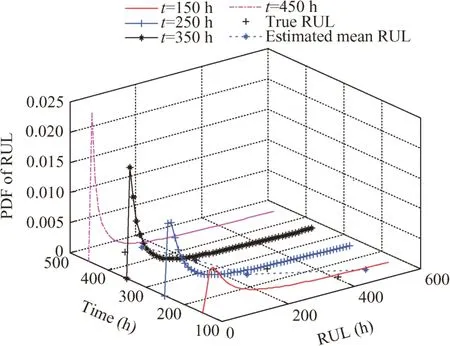
Fig.11 Comparison between estimated and true RUL values before being repaired.

Afterfinishing the consistency test,the degradation data before and after the maintenance can be fused,as is shown in Fig.12,compared with the non-integration information before the maintenance.
It can be seen from the prediction results that the RUL of the airborne fuel pump is exactly predicted after fusing the degradation information before maintenance,and while the consistency test has passed,it provides a feasible method for life prediction of repaired equipment,which lacks prior guidance information.
6.Conclusions
(1)A modified unbiased MLE method for estimation about the parameters of a Wiener process is presented,and the estimation precision is improved compared to that of the classical MLE method,when the size of measured data is small.
(2)A consistency test method based on the variation coeffi-cient of a Wiener process is proposed.Construct a statistical valuehwhich contains the variation coefficient,derive the distribution of the statistical valueh,and propose an H distribution based hypothesis test method.Provide a theoretical foundation for the consistency test of degradation models of different products or different stages of the same product.
(3)The unbiased MLE method and the consistency test method of a Wiener process proposed in this paper are applied to the performance degradation study of an airborne fuel pump.Under the same degradation model,a weighted method of fusing the information before and after maintenance is proposed,the RUL of the equipment after maintenance is predicted successfully,and the accuracy is improved.
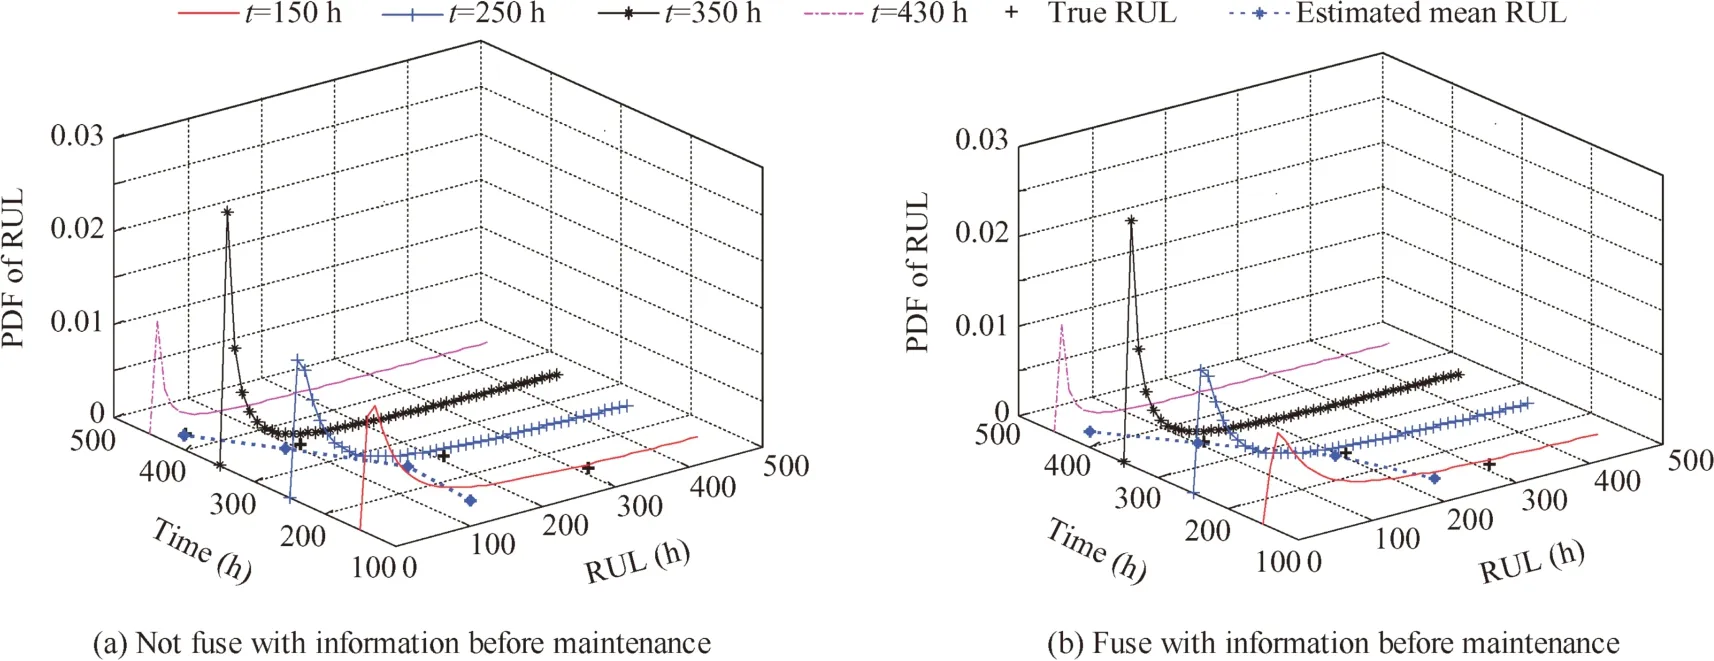
Fig.12 Comparison for estimated RUL after being repaired.
Acknowledgement
This study was supported by the Aeronautical Science Foundation of China(No.201428960221).
1.Peng CY,Tseng ST.Progressive-stress accelerated degradation test for highly-reliable products.IEEE Trans Rel2010;59(1):30–7.
2.Guan Q,Tang Y,Xu A.Objective Bayesian analysis accelerated degradation test based on Wiener process models.Appl Math Model2016;40(4):2743–55.
3.Tseng ST,Hamada M,Chiao CH.Using degradation data to improvefluorescent lamp reliability.J Qual Technol1995;27(4):363–9.
4.Si XS,Wang WB,Hu CH,Zhou DH.Remaining useful life estimation—A review on the statistical data driven approaches.Eur Oper J Res2011;213(1):1–14.
5.Gebraeel NZ,Lawley MA,Li R,Ryan JK.Residual-life distributionsfrom componentdegradation signals:A Bayesian approach.IIE Trans2005;37(6):543–57.
6.Bae SJ,Kvam PH.A nonlinear random-coefficients model for degradation testing.Technometrics2004;46(4):460–9.
7.Peng CY,Tseng ST.Mis-specification analysis of linear degradation models.IEEE Trans Rel2009;58(3):444–55.
8.Tseng ST,Peng CY.Stochastic diffusion modeling of degradation data.J Data Sci2007;5(3):315–33.
9.Noortwijk JV.A survey of the application of gamma processes in maintenance.Reliab Syst Safe2007;94(1):2–21.
10.Ye ZS,Chen N.The inverse Gaussian process as a degradation model.Technometrics2014;56(3):302–11.
11.Pan DH,Liu JB,Cao J.Remaining useful life estimation using an inverse Gaussian degradation model.Neurocomputing2016;185:64–72.
12.Ye ZS,Xie M.Stochastic modelling and analysis of degradation for highly reliable products.Appl Stoch Model Bus2015;31(1):16–32.
13.Tang S,Yu C,Wang X,Guo X,Si X.Remaining useful life prediction of lithium-ion batteries based on the Wiener process with measurement error.Energies2014;7(2):520–47.
14.Hu CH,Lee MY,Tang J.Optimum step-stress accelerated degradation test for Wiener degradation process under constraints.Eur J Oper Res2014;241(2):412–21.
15.Si XS,Wang WB,Hu CH,Chen MY,Zhou DH.A Wienerprocess-based degradation model with a recursivefilter algorithm for remaining useful life estimation.Mech Syst and Signal Pr2013;35(1–2):219–37.
16.Ye ZS,Chen N,Shen Y.A new class of Wiener process models for degradation analysis.Reliab Syst Safe2015;139:58–67.
17.Wang X.Wiener processes with random effects for degradation data.J Multivariate Anal2010;101(2):340–51.
18.Wang X,Lin S,Wang S,He Z,Zhao C.Remaining useful life prediction based on the Wiener process for an aviation axial piston pump.Chin J Aeronaut2016;29(3):779–88.
19.Tsai C,Tseng S,Balakrishnan N.Mis-specification analyses of gamma and Wiener degradation processes.J Stat Plan Infer2011;141(12):3725–35.
20.Liao CM,Tseng ST.Optimal design for step-stress accelerated degradation tests.IEEE Trans Rel2006;55(1):59–66.
21.Tseng ST,Balakrishnan N,Tsai CC.Optimal step-stress accelerated degradation test plan for Gamma degradation processes.IEEE Trans Rel2009;58(4):611–8.
22.Liu J,Zhang M,Zuo H,Xie J.Remaining useful life prognostics for aeroengine based on superstatistics and information fusion.Chin J Aeronaut2014;27(5):1086–96.
23.Li Q,Gao Z,Tang D,Li B.Remaining useful life estimation for deteriorating systems with time-varying operational conditions and condition-specific failure zones.Chin J Aeronaut2016;29(3):662–74.
24.Kao EPC.An introduction to stochastic processes.1st ed.Beijing:China Machine Press;2006.p.374–86.
25.Wang H,Xu T,Wang W.Test method of failure mechanism consistency based on degradation model.Acta Aeronaut Astronaut Sin2015;36(3):889–97[Chinese].
26.Feng J.Consistent test of accelerated storage degradation failure mechanism based on rand correlation coefficient.J Aerosp Power2011;26(11):2439–44[Chinese].
27.Xing RF.The application of estimation method of coefficient of variation in the study on reliability of existing structures[dissertation].Xi’an:Xi’an University of Architecture and Technology;2011[Chinese].
28.Lu C,Meeker WQ.Using degradation measures to estimate a time-to-failure distribution.Technometrics1993;35(2):161–74.
29.Li J,Jing B,Qiang XQ,Liu XD.Fault states feature extraction and experimental study for airborne fuel pumps based on sample quantile.ActaAeronautAstronautSin2016;37(9):2851–63[Chinese].
杂志排行

CHINESE JOURNAL OF AERONAUTICS的其它文章
- Multi-mode diagnosis of a gas turbine engine using an adaptive neuro-fuzzy system
- PHM with Aerospace Applications
- A critique of reliability prediction techniques for avionics applications
- Reduction rules-based search algorithm for opportunistic replacement strategy of multiple life-limited parts
- Satellite lithium-ion battery remaining useful life estimation with an iterative updated RVM fused with the KF algorithm
- A Bayesian approach for integrating multilevel priors and data for aerospace system reliability assessment