Robust design and analysis of a conformal expansion nozzle with inverse-design idea
2018-02-02WenioGANXiouiZHANGTielinMAQinlingZHANGWuYUAN
Wenio GAN,Xioui ZHANG,Tielin MA,Qinling ZHANG,Wu YUAN
aResearch Institute of Unmanned System,Beihang University,Beijing 100083,China
bThe First Aircraft Institute,Aviation Industry Corporation of China,Xi’an 710089,China
cComputer Network Information Center,Chinese Academy of Sciences,Beijing 100190,China
1.Introduction
Modernflying wing Unmanned Aerial Vehicles(UAVs)always employ the Conformal Expansion Nozzle(CEN)to improve aerodynamic/stealth integrate performance(such as the RQ-180).The CEN has special design features.On the one hand,the nozzle has good shadowing effect of the airframe to reduce Radar Cross-Storage(RCS).Its expansion surfaces have the certain curvature.The edges of exit generally are parallel to the edges of the airframe as much as possible.On the other hand,to ensure good aerodynamic performance,expansion surfaces of the nozzle need refinement design.These surfaces can improveflow features of the nozzle in complex conditions,such as expansion,compression and interference.Therefore,in view of stealth constraints,aerodynamic design and analysis of the conformal expansion nozzle have been widely concerned.
Capone et al.1studied aerodynamic performance of the Conformal Single-Expansion Nozzle(CSEN)at different speeds.Berrier and Leavit2analyzedflow distortion characteristics of CSEN.MacLean3applied experiment methods to examine the flow characteristics of CSEN.Carlson4investigated static performance of a Single Expansion Ramp Nozzle(SERN).Capone and Schirmer5explored static internal performance of a SERN with multi-axis thrust vectoring capability.Marathe and Thiagarajan6conducted effect analysis of geometric parameters on the performance of SERN.Huang et al.7used data mining for design exploration of a SERN.Damira et al.8carried out parametric optimization of SERN.Gruhn et al.9,10has improved the SERN performance by aerodynamicflap design.These researches always focus on high speed nozzle and pay attention to parameter effect and single-point optimization.They take little consideration to multi-point performance and uncertainties for the conformal expansion nozzle of modernflying wing UAV.So,it is necessary to concern multi-point performance and uncertainties to carry out the conformal expansion nozzle design offlying wing.
2.Design system
2.1.Inverse-design idea
Starting from airframe/intake-exhaust integration configuration,the design of a conformal expansion nozzle is carried out.Fig.1 shows the shape of airframe/intake-exhaustflying wing16that includes a nozzle.Only the parameters of the nozzle are adjusted in nozzle design process.
The inverse-design idea is proposed and involves four elements.Firstly,the edges of the nozzle exit need to parallel the edges of airframe for stealth.The location of the nozzle exit is initially defined.Secondly,the area of the nozzle exit is gained by approximate isentropic expansion.Thirdly,the surfaces of the nozzle have special curvature tofit great expansion.At last,there are slip lines between shearflow of the nozzle exit and outflow to avoid shock wave and reduce inflow/outflow interference.In fact,the center line of the nozzle is close to chord of the fuselage to produce slip lines.
The inverse-design idea is used for the parametric approach and determining basic space of design variables.On the one hand,the length,width,central point coordinates and round corner radius of the nozzle exit are 6 basic variables,which can determine the nozzle exit.On the other hand,9 cubic curves(8 of edges,1 of center)are selected to guide the streamwise of nozzle,which has 18 variables.Based on these variables,the nozzle is transformed into digital surfaces.The initial full-aircraft mesh is generated by Gridgen.The local mesh of the nozzle is automatically reconstructed by the TransFinite Interpolation(TFI)method.
Fig.2 shows basic schematic of the nozzle view and guide curves.The nozzle has some special curvature constraints of curvature to meet the inverse-design idea.The guide curves adopt cubic spline(as Eq.(1))of 5 points,which are divided into equal segments along the chord.
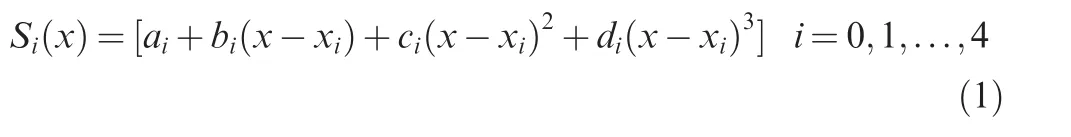
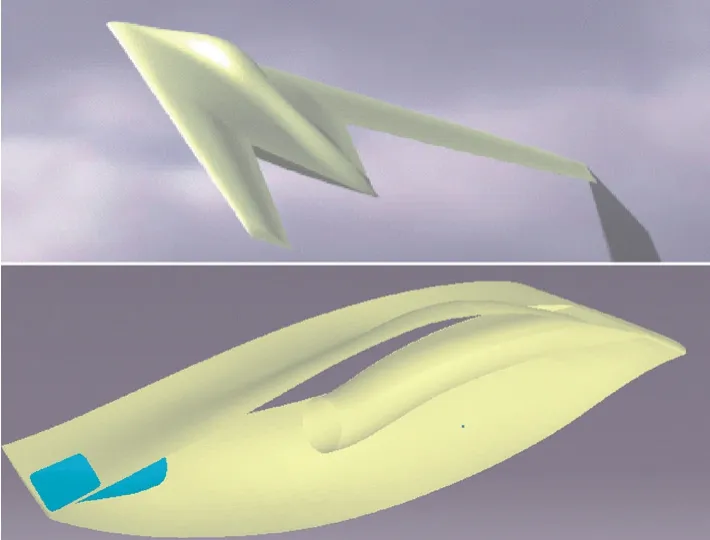
Fig.1 Shape offlying wing and airframe/intake-exhaust.
whereSi(x)stands foryorzcoordinate values,xandxiare the coordinate values of anywhere and theith point respectively.ai,bi,cianddiare parameters which can be determined by coordinate values offive points.Based on the inverse-design idea,the middle and two end points(thefirst,third and fifth points)can be determined by the inlet and exit of the nozzle.Theyorzvalues of two other points are design variables.

Fig.2 Schematic of nozzle view and guide curves.
Optimization design of the conformal nozzle should not only have large thrust coefficient of the nozzle,but also ensure high lift-drag ratio of full-aircraft.The design state is as follows:Mach number is 0.6;angle of attack is 2°.The design objects are the thrust coefficient of the nozzle and lift-drag ratio of full-aircraft.The relation of thrust coefficient is shown as

where η is the thrust coefficient;Fis the practical total thrust andFtis the ideal total thrust;ρ,V,p,p∞,A,Aeand n stand for density,velocity,pressure,freestream pressure,area,integral area and normal vector respectively.
2.2.Robust design model
The aircraft manufacturing process is influenced by many random factors.When the production process is stable,the actual geometric size is subject to normal distribution as Eq.(4).

where μ is mathematical expectation and σ is standard deviation.
Generally,the basic tolerance of high accuracy manufacture is±0.8 mm.The limit tolerance of full-aircraft shape is±1.2 mm.The tolerance of shape is translated as dimensionless standard deviations of design variables.
There are uncertain influences of wind, flight height and velocity in realflight condition.These influences are concentrated in the variation of Mach number and the angle of attack.Theflight condition has great randomness in an uncertainty range,and the randomness is lack of a core.So the angle of attack and Mach number can reasonably be considered to be uniformly distributed.
In the robust design process,a robust design model is needed.It adopts multi-objective optimization strategy.The mean and standard deviation of performance function should be optimized.The optimization objectives contain the meanE(K),E(η)and the standard deviation σ(K),σ(η).The model is shown as
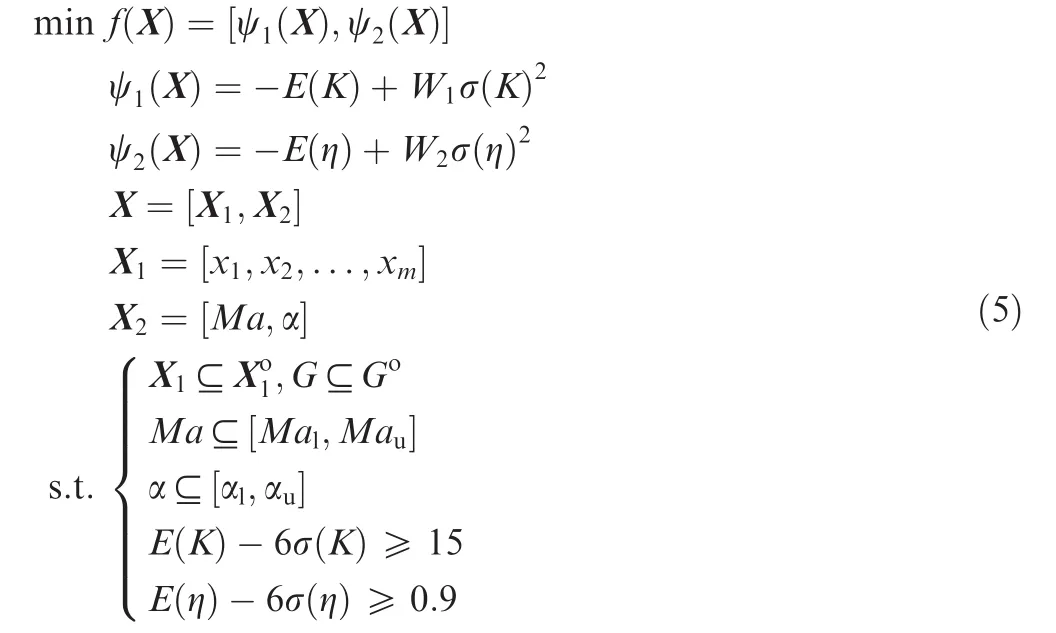
whereKis the lift-drag ratio at design state;X1=[x1,x2,...,xm]is design variable;Xo1is the design space of X1;Gis the geometric shape function of the nozzle;Gois the design space of the geometric shape;MalandMauare the lower and upper bounds of Mach numberMa; αland αuare the lower and upper boundaries of the angle of attack α;W1andW2are relevant parameter of design objectives,which correspond to ψ1(X)and ψ2(X);f(X)is macro expression of design objectives.The constraints satisfy 6σ criterion.The characteristic statistics are obtained by using Monte Carlo simulation sample,which is based on the surrogate model.The mean and variance of the discrete analysis are obtained as Eqs.(6)–(9).

wheren,Ki(X),ηi(X)are sample number,the lift-drag ratio of theith sample and the thrust coefficient of theith sample respectively.
2.3.Numerical simulation method
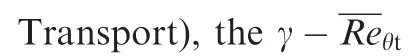
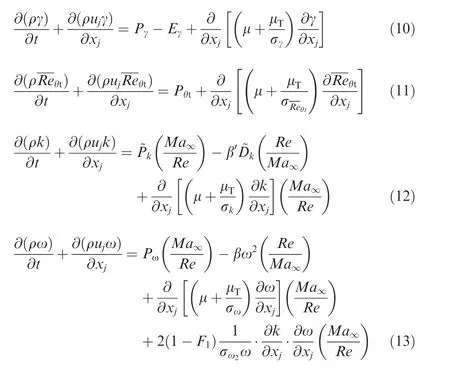
The source term of γ is defined as follows:


whereReθtis the transition Reynolds number;γeffis the effective intermittency;Fθtis the blending function;Pkis the source terms of turbulent kinetic energy in SST turbulent model.
The destruction sources of γ andkare defined as follows:

Reynolds numbers are given by the following expressions:

whereyis the normal distance of near wall;the transition Reynolds numberReθtis shown as a special function.15,17Specific expressions ofReθtandFlengthare defined as follows:

whereTu,Fλ,K′are turbulence intensity and correlation function respectively;λ andK′are new empirical correlations;FλandFK′are functions of λ andK′respectively.They are shown in Ref.15γeffis given by

whereFreattachis the function of reattachment.It disables the modification once the viscosity ratio is large enough to cause reattachment.
There are many constants,such asCa1,Cθt,Ca2andCe2.The detailed constants and validation encountered in the model are given in Ref.15
2.4.Robust design system
2.4.1.Robust design method
Based on the robust model and inverse-design idea,the framework of the robust design method is built(Fig.3).
The design method includes three steps.Firstly,the design idea is determined.The design problem is expressed as optimization problem.Secondly,by combining numerical simulation method,RadialBasisFunction (RBF)surrogate model18,and Multi-Object Genetic Algorithm(MOGA)19,the deterministic optimization process is built.Thirdly,based on uncertainty analysis,the robust optimization process can be determined,and the new round of multi-objective genetic algorithm optimization is carried out to gain design nozzle.Then,verification analysis on aerodynamic performance of design nozzle will be carried out.
In deterministic optimization process,MOGA is based on surrogate model to improve the efficiency of design.RBF is employed as the surrogate model.In robust optimization process,partition design shapes of Pareto frontier are employed in uncertainty sampling and gain uncertainty analysis results.The results of uncertainty analysis are used to replace some initial samples.And then,surrogate model is rebuilt,design constraint is modified,and MOGA is carried out again to determine robust design result.
2.4.2.Experimental design and surrogate model

Fig.3 Framework of the robust design method.
Because of the effectiveness of large space sampling,the Latin hypercube sample15is used as the initial experimental design.As uniformity sampling20can describe the characteristics of the sampling range and is suitable to solve multi-level problems,the uniformity sampling is used in initial and basic uncertainty analysis of robust optimization.The Monte Carlo sampling is applied to surrogate model analysis of robust optimization.
The optimization is based on the RBF surrogate model.RBF is a feed forward neural network with strong selfadaptive and learning abilities(Eq.(25)).It is widely used in aerodynamic optimization.15

2.4.3.Optimization algorithm and grid deformation
MOGA has been real-coded as the optimization algorithm.To evaluate thefitness of each individual in the population,the value of each objective is determined,and then the normalized value offitness is expressed as21

The method combines two objective functions as a scalar value.wis a random number varying in a range between 0 and 1.It is randomly generated for each solution vector in each generation.f’1jandf’2jare the normalized values off1jandf2j(values of objective functions forjth solution)respectively.They are calculated as follows:

The algorithm has four steps.Firstly,a random population in sizeNis generated.Secondly,after evaluation of initial population,non-dominated solutions are determined and archived.And then offspring population is generated using roulette wheel selection,crossover and mutation operators.At last,after producing child population,the next generation(λ′+ μ′)-selection strategy is applied as survivor selection rule(μ′stands for the number of a generation;λ′is the number of offspring of the μ′individuals).In the process of survival selection,λ′offspring is produced and the respectivefitness is calculated.And then,according to (λ′+ μ′)-selection strategy,the best μ′chromosomes in λ′+ μ′ones are selected as the next population members in each generation.22In each generation,the archive of non-dominated solution is updated by the current population.
TFI method has been widely adapted to grid deformation.23It is used to compute the displacements in the interior of the grid blocks in design process.
The displacements are computed in the interior by straightline interpolation in the direction:
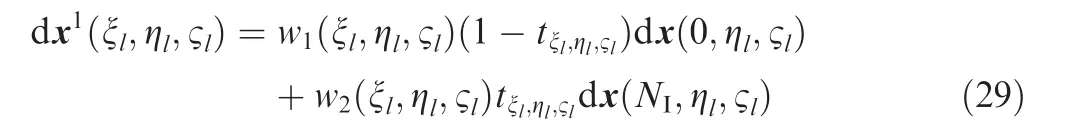
Then the match of the displacements must be added along other two directions.
Finally,the grid deformation isfinished as

where dx,(s,t,u),and(ξl, ηl, ζl)are displacement,original coordinate and normalized coordinate respectively;superscripts 1,2,3 stand for three directions;w1,w2,w3,w4,w5andw6are six weight function;NI,NJandNKstand for the maximum value of ξl,ηland ζlrespectively.
3.Design results and analysis
3.1.Design results and basicflow features
Fig.4 shows samples and Pareto frontier of deterministic design.The distribution of Pareto frontier is uniform.Since the inverse-design idea can effectively control basic design space,the number of samples is less than 100.It is shown that the design optimization has low computation cost and excellent optimization efficiency.
The design result and Pareto frontier of robust design are shown in Fig.5.ψ1and ψ2are expressed in Eq.(5),whereW1=-1 andW2=-200.Their thrust coefficient and liftdrag ratio are less than deterministic design,because the robust design compromises the robustness and values of design objects.Different design results are given in Table 1.The robust design has minimum σ(K)and σ(η).It greatly improves the robustness of design result.

Fig.4 Samples and Pareto frontier of deterministic design.
Fig.6 shows guide curves of the design nozzle.Based on stealth requirements,the edges of exit parallel to the edges of airframe.To improve exhaust performance,the exit has four round corners.Inside,guide curves expand and tend to parallel with symmetry plane.Outside,guide curves expand and shrink with the airframe as soon as possible.These will reduce the spanwiseflow interference between nozzle and airframe.To reduce the chordwise effect of exhaust,upper guide curves are S-shape to match airframe as much as possible.Lower guide curves slowly expand and become linear to match the trailing edge of airframe.The center guide curve is almost straight to ensure the good macro performance of exhaust.
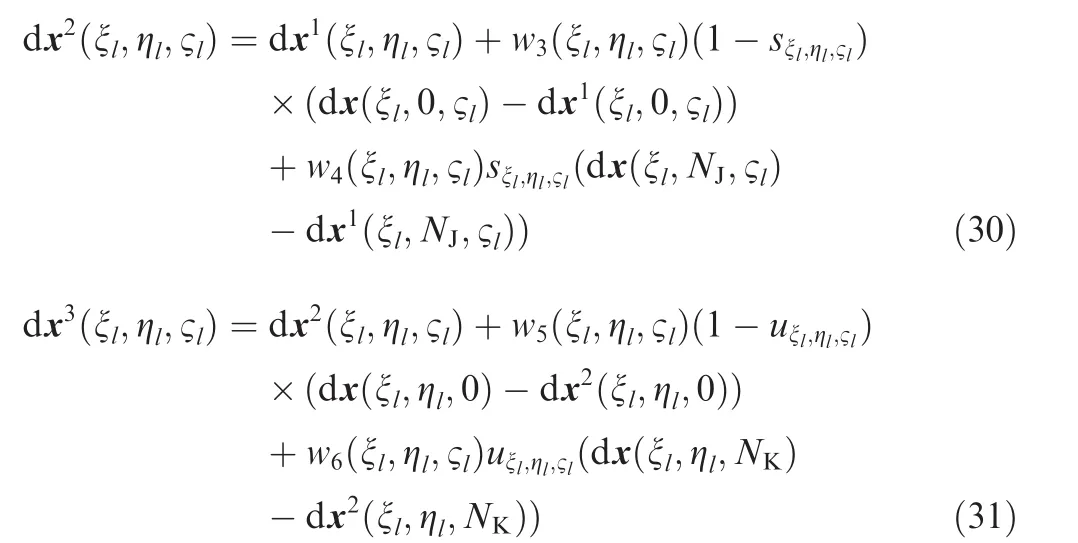
Figs.7 and 8 show thrust coefficient and lift-drag ratio of the design nozzle respectively.The robust design result has better robustness of Mach number and angle of attack than deterministic design.Compared to original design,thrust coefficient and lift-drag ratio have obviously been improved(the thrust coefficient of nozzle and the lift-drag ratio of full-aircraft are increased by 2.3%and 6.7%in design state,respectively).
Fig.9 shows Mach number distribution of the design nozzle at different spanwise sections.Firstly,flow begins to expand from entrance.Secondly,there are weak compressions to maintain lower pressure(correspond to high Mach number)in the middle of the nozzle.And then,pressure is adjusted by expansion at trailing edge.Finally,internalflow mixes into outflow using slow compression.These are beneficial for reducing the drag of front half and increasing the thrust of rear half.The expansions are obvious along the spanwise direction.They are related with inflow/outflow interference of the nozzle.There are slip lines between internal and externalflow(as red dotted line in Fig.9)to meet the inverse-design idea.
Fig.10(a)showsflow field of design state.Mach number distribution of cross sections gradually changes from round to rectangular ‘‘peach”.The interference between internal and externalflow causes separation to induce vortices and secondaryflow.The secondaryflow mixes with the mainstream to form the peach of cross section.The streamlines are characterized by eddy viscosity in Fig.10(b).These show that outlet streamlines of nozzle almost parallel to the edges of airframe(correspond to slip lines of Fig.9).There are special strong shear layers,whose viscosity increases significantly.

Fig.5 Design result and Pareto frontier of robust design.

Fig.6 Guide curves of design nozzle.

Fig.7 Thrust coefficient of design nozzle(α =2°).
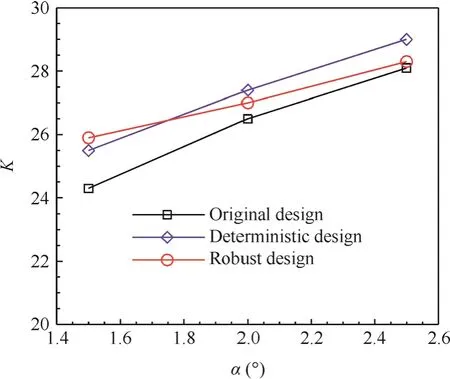
Fig.8 Lift-drag ratio of design nozzle(Ma∞=0.60).
Table 1 Comparison of design results.

Fig.9 Mach number distribution of typical spanwise sections(Ma∞ =0.60,α =2°).

Fig.10 Flow field of design state(Ma∞ =0.60,α=2°).
3.2.Performance of robust design nozzle
Generally,there are some off-design states offlying wing.Aerodynamic performance of the design nozzle is particularly analyzed in off-design conditions(Ma∞=0.60,0.65 and 0.70)now.
Fig.11 shows the thrust coefficient of the nozzle at different Mach numbers.The thrust coefficient increases more quickly at small angle of attack,but decreases at large angle of attack.There is separation at large angle of attack.The interference between internal and externalflow causes great variation of pressure distribution and thrust coefficient.Fig.12 shows lift-drag ratio of full-aircraft at different Mach numbers.With Mach number increasing,maximum lift-drag ratio is reduced obviously.
Fig.13 shows density distribution of the middle sections at typical state(Ma∞=0.60,α =0°),where ‘‘inf” stands for free stream.As shown in Fig.13 the development offlow filed is similar with the design state(Fig.9).Density distribution of the typical sections(Ma∞=0.60, α =6°)are shown in Fig.14.The expansion area changes slightly at rear of the nozzle.It is available for maintaining high pressure to increase the thrust coefficient.
Fig.15 shows limiting streamlines and pressure coefficientCpin different conditions(Ma∞=0.60,α =0°and 6°).At α =6°,because of shock wave,pressure gradient increases at rear of the airframe and the inflow/outflow interference becomes slightly large along the spanwise.These will slightly increase pressure of the nozzle to maintain large thrust coeffi-cient,but decrease lift-drag ratio significantly.

Fig.11 Thrust coefficient of the nozzle at different Mach numbers.

Fig.12 Lift-drag ratio offull-aircraftatdifferentMach numbers.

Fig.13 Density distribution of typical sections(Ma∞=0.60,α =0°).
Fig.16 showsflow field of spanwise middle section at large angle of attack(Ma∞=0.65 andMa∞=0.70).The expansion region is large at the front half of nozzle.It helps for maintaining largethrustcoefficient.AsMach number increases,the variation of expansion induces that the thrust coefficient increases a little.
Limiting streamlines of large angle of attack are shown in Fig.17.There is significant separation at high speed and large angle of attack(Ma∞=0.70,α =8°).We can see clear spiral point and saddle point on the surface of airframe.The lift-drag ratio will decrease sharply.
Compared to design state,the thrust coefficient of high speed off-design states is a little larger,but lift-drag performance decreases obviously.

Fig.14 Density distribution of typical sections(Ma∞=0.60,α =6°).
4.Conclusions
Based on the inverse-design idea,considering uncertainties of geometry,Mach number and angle of attack,the robust design system combines deterministic optimization and robust optimization and is applied to the design of a conformal expansion nozzle.The mean and standard deviation of design objects meet the requirement of 6σ.The robustness of design objects is improved obviously.
The design nozzle employs special curved surfaces tofit the anticipation of the inverse-design idea.Its aerodynamic performance of design state is improved(the thrust coefficient of nozzle and the lift-drag ratio of full-aircraft are increased by 2.3%and 6.7%,respectively).It has ‘‘peach” type Mach number distribution features of cross sections in design state.Compared to the design state,the thrust coefficient is a little larger and the lift-drag ratio is lower in high speed off-design conditions.
The present method has integrated the advantages of robust optimization and inverse-design idea.It provides a feasible design strategy for the nozzle design offlying wing.
Acknowledgements
This study was co-supported by the Aeronautical Science Foundation of China(No.2016ZA51003),Aerospace Science and Technology Foundation of China(No.2017129001),National Key R&D Program of China(No.2016YFB 1200100)and National Natural Science Foundation of China(No.11502267).
1.Capone FJ,Re RJ,Bare EA.Parametric investigation of single expansion-Ramp nozzles at Mach numbers from 0.60 to 1.20.Washington,D.C.:NASA;1992.Report No.:NASA-TP-3240.
2.Berrier BL,Leavit LD.Static internal performance of singleexpansion-ramp nozzles with thrust-vectoring capability up to 60 deg.Washington,D.C.:NASA;1984.Report No.:NASA-TP-2364.
3.MacLean MK.Static internal performance tests of single expansion ramp nozzle concepts designed with LO consideration.Reston:AIAA;1993.Report No.:AIAA-1993-2429.
4.Carlson J.Prediction of static performance for single expansion ramp nozzles.Reston:AIAA;1993.Report No.:AIAA-1993-2571.
5.Capone FJ,Schirmer AW.Static internal performance a single expansion ramp nozzle with multi-axis thrust vectoring capability.Washington,D.C.:NASA;1994.Report No.:NASA-TM-4450.
6.Marathe A,Thiagarajan V.Effect of geometric parameters on the performances of single expansion ramp nozzle.Reston:AIAA;2005.Report No.:AIAA-2005-4429.
7.Huang W,Wang ZG,Ingham DB,Ma L,Pourkashania M.Design exploration for a single expansion ramp nozzle(SERN)using data mining.Acta Astronaut2013;83:10–7.
8.Damira SK,Marathe AG,Sudhakar K,Issacs A.Parametric optimization of single expansion ramp nozzle(SERN).Reston:AIAA;2006.Report No.:AIAA-2006-5188.
9.Gruhn P,Henckels A,Kirschstein S.Flap contour optimization forhighly integrated SERN nozzles.AerospSciTechnol2000;4:555–65.
10.Gruhn P,Henckels A,Sieberger G.Improvement of the SERN nozzle performance by aerodynamicflap design.Aerosp Sci Technol2002;6:395–405.
11.Lee DS,Periaux J,Onate E,Gonzalez LF,Qin N.Active transonic aerofoil design optimization using robust multi-objective evolutionary algorithms.J Aircraft2011;48(3):1084–94.
12.Li J,Gao ZH,Huang JT,Zhao K.Robust design of NLF airfoils.Chin J Aeronaut2013;26(2):309–18.
13.Huang JT,Gao ZH,Zhao K,Bai JQ.Robust design of supercritical wing aerodynamic optimization considering fuselage interfering.Chin J Aeronaut2010;23(5):523–8.
14.Li J,Gao ZH,Huang JT,Zhao K.Aerodynamic design optimization of nacelle/pylon position on an aircraft.Chin J Aeronaut2013;26(4):850–7.
15.Gan WB.Research on aerodynamic numerical simulation and design of near space low-Reynolds unmanned aerial vehicles[Dissertation].Xi’an:Northwestern Polytechnical University;2014[Chinese].
16.Gan WB,Zhang XC.Design optimization of a three-dimensional diffusing S-duct using a modified SST turbulent model.Aerosp Sci Technol2017;63:63–72.
17.Keerati S,Pramote D,Ekachai J.Correlations for modeling transitional boundary layers under influences of freestream turbulence and pressure gradient.Int J Heat Fluid Fl2009;30(1):66–75.
18.Jackson IRH.Convergence properties of radial basis function.Constr Approx1988;4(1):243–6.
19.Zitzler E,Thiele L.Multi-objective evolutionary algorithms:a comparative case study and the strength Pareto approach.IEEE T Evolut Comput1999;3(4):257–71.
20.Swiler LP,Slepoy R,Giunta AA.Evaluation of sampling methods in constructing response surface approximations.Reston:AIAA;2006.Report No.:AIAA-2006-1827.
21.Zhou G,Min H,Gen M.A genetic algorithm approach to the bi criteria allocation of customers to warehouses.Int J Prod Econ2003;86(1):35–45.
22.Rabiee M,Zandieh M,Ramezani P.Bi-objective partialflexible job shop scheduling problem:NSGA-II,NRGA,MOGA and PAES approaches.Int J Prod Res2012;50(1):1–16.
23.Weatherill PW,Soni BK,Thompson JF.Handbook of grid generation.London:CRC Press Inc;1999.p.15–80.
杂志排行

CHINESE JOURNAL OF AERONAUTICS的其它文章
- Multi-mode diagnosis of a gas turbine engine using an adaptive neuro-fuzzy system
- PHM with Aerospace Applications
- A critique of reliability prediction techniques for avionics applications
- Reduction rules-based search algorithm for opportunistic replacement strategy of multiple life-limited parts
- Satellite lithium-ion battery remaining useful life estimation with an iterative updated RVM fused with the KF algorithm
- A Bayesian approach for integrating multilevel priors and data for aerospace system reliability assessment