生物标志物重建全新世以来黄海浮游植物群落结构时空变化
2017-10-09吴珺洁袁子能向荣张海龙肖晓彤赵美训
吴珺洁,袁子能,向荣,张海龙,肖晓彤*,赵美训
(1.中国海洋大学 海洋化学理论与工程技术教育部重点实验室,山东 青岛 266100; 2.中国科学院 南海海洋研究所 边缘海地质重点实验室,广东 广州 510301)
生物标志物重建全新世以来黄海浮游植物群落结构时空变化
吴珺洁1,袁子能1,向荣2,张海龙1,肖晓彤1*,赵美训1
(1.中国海洋大学 海洋化学理论与工程技术教育部重点实验室,山东 青岛 266100; 2.中国科学院 南海海洋研究所 边缘海地质重点实验室,广东 广州 510301)
现有研究对全新世以来浮游植物群落结构在黄海的时空变化还缺乏深入认识,针对这一问题,本研究分析了C02和N05岩心中的生物标志物,并结合已发表岩心生物标志物数据,重建黄海全新世以来浮游植物群落结构的时空变化。在早全新世,长链烯酮相对比例(A/∑PB)和菜子甾醇相对比例(B/∑PB)低,甲藻甾醇相对比例(D/∑PB)高。较高的陆源有机质指标(TMBR′)值说明黄海浮游植物群落结构主要受陆源营养盐输入控制。在中全新世,A/∑PB 升高,B/∑PB和D/∑PB减小,是由于高温高盐的黄海暖流入侵有利于颗石藻生长。在空间分布上,以ZY3、ZY2、ZY1和YE-2 4个站位组成的35.5°N断面区域烯酮相对比例大幅升高,西部站位C02与东部N05烯酮比例小幅上升,这是由于黄海暖流主轴流经35.5°N断面,该区域主要受黄海暖流控制,而其他区域仍受陆源营养盐输入控制。从早全新世到中全新世,B/∑PB(D/∑PB)高值相继出现在N05(C02)和C02(N05)区域,这是由于2个站位的控制因素不同, 可能与黄海暖流主轴摆动和陆源物质的搬运有关。在晚全新世,A/∑PB继续升高,B/∑PB和D/∑PB减小。晚全新世东亚冬季季风增强使黄海环流体系加强,黄海暖流对颗石藻的影响进一步扩大。甲藻甾醇与菜子甾醇的相对比例(D/B)升高,可能是由于东亚冬季季风增强,使含有更多氮元素的大气物质沉降到黄海,有利于甲藻对硅藻的竞争。
生物标志物;群落结构;黄海;全新世;时空格局
1 前言
黄海位于中国与朝鲜半岛之间,是中国最大的陆架海之一,平均水深46 m。黄海环流体系主要包括黄海暖流、山东半岛沿岸流、黄海沿岸流、朝鲜半岛沿岸流以及长江冲淡水(图1)。其中,黄海暖流是一支存在于冬季的逆风补偿流,山东半岛沿岸流、黄海沿岸流和朝鲜半岛沿岸流受季风驱动南下。此外,黄海存在多个泥质区,具有高沉积速率,为古环境重建提供了可靠条件。
浮游植物是海洋中主要的初级生产者,海洋浮游植物通过控制“生物泵”效率,进而影响大气和海洋CO2浓度[1]。例如,钙质生物和硅质生物在利用CO2时有不同的生物效应,硅藻和颗石藻的相对比例变化可以改变向海洋沉积物输送有机碳和无机碳的比例。与此同时,浮游植物种群结构受多种因素影响,特别是黄海在全新世以来经历海水入侵、海平面上升和泥质区形成等环境变化[2—4],了解全新世以来黄海浮游植物群落结构的时空分布特征,有助于揭示浮游植物种群结构变化的控制因素,明确中国边缘海碳循环机理。

图1 站位及黄海表层环流图Fig.1 Sampling stations and schematic illustration of the surface currents红色标记为C02、N05站位,黑色标记为ZY3、ZY2、ZY1和YE-2站位[4-6];黑色箭头表示洋流;灰色阴影部分表示泥质区The red marks indicate locations of C02 and N05, and the black marks indicate locations of ZY3, ZY2, ZY1 and YE-2[4—6]. The black arrows show the surface currents and the gray shades stand show mud areas
生物标志物是重建浮游植物群落结构变化的主要方法。烯酮主要由大洋颗石藻藻种Emilianiahuxleyi和Gephyrocapsaoceanica产生[7—8],菜子甾醇可作为硅藻的标志物,甲藻甾醇可用来指示甲藻生产力的变化[9—10]。通过实验室培养和现场观测发现,颗石藻在高温高盐低营养区域有生长优势[11—13];硅藻在高硅营养盐环境下具有竞争优势[14—15];营养盐N∶P的变化会影响硅藻和甲藻的竞争,在P相对缺乏的情况下硅藻生长受到抑制[16]。
现代研究中,生物标志物法被用来指示黄、东海陆架区悬浮颗粒物中的群落结构以及黄东海表层沉积物生物标志物的分布特征[17—20]。在长时间尺度上,Xing等利用生标重建南黄海中部YE-2岩心(图1)在过去8 200年的浮游植物种群变化[5]。Zhao等重建黄海ZY2、ZY1岩心(图1)中生物标志物记录,并强调全新世东亚季风和黄海暖流的演变对浮游植物生产力和群落结构变化的影响[4]。
已有研究中,部分研究集中讨论现代浮游植物群落结构的空间分布特征,部分研究着眼于种群结构在长时间尺度上的变化和古环境重建。目前,对于浮游植物群落结构在全新世时空分布特征的研究较少,Zhao等研究中的两个岩心采集于较为接近的站位[4],对黄海海域浮游植物种群结构的变化认识并不全面。本研究在现有资料基础上,选取位于南黄海中部泥质区西侧的C02岩心(图1),以及位于泥质区东北方位的N05岩心(图1),结合已发表的黄海泥质区岩心数据,利用生物标志物法重建全新世以来浮游植物群落结构,探究黄海浮游植物在全新世的时空格局及其控制因素。
2 材料与方法
2.1 样品信息
C02和N05岩心于2011年春季由中国海洋大学“东方红2”号科考调查船在黄海采集(表1),C02岩心柱长300 cm,N05岩心柱长289 cm。这两根岩心均按1 cm间隔分样,岩心的年龄框架均挑选混合有孔虫采用14C定年,在北京大学完成。C02岩心顶部年龄约4 ka,底部年龄约11.1 ka,其中104~106 cm断面底栖有孔虫含量异常高,可能是受再沉积物质影响,因此去掉该定年点,平均沉积速率为42 cm/ka[3]。N05岩心底部年龄约11.6 ka,平均沉积速率为25 cm/ka。
ZY1、ZY2和ZY3岩心于2006年由“东方红2”号科考调查船在南黄海中部泥质区取得(表1), ZY1岩心柱长395 cm,ZY2岩心柱长342 cm,ZY3岩心柱长380 cm。ZY1岩心按1 cm间隔分样;ZY2岩心顶部36 cm按1 cm间隔分样,其余部分按4 cm分样;ZY3岩心顶部6 cm按2 cm间隔分样,6~180 cm按1 cm间隔分样,其余部分按4 cm间隔分样[4,6]。
YE-2岩心于2003年秋季在南黄海中部采集(表1),柱长18 m,Xing等取上部6 m(距今8 200年)按4 cm间隔分样,分析生物标志物含量[5]。
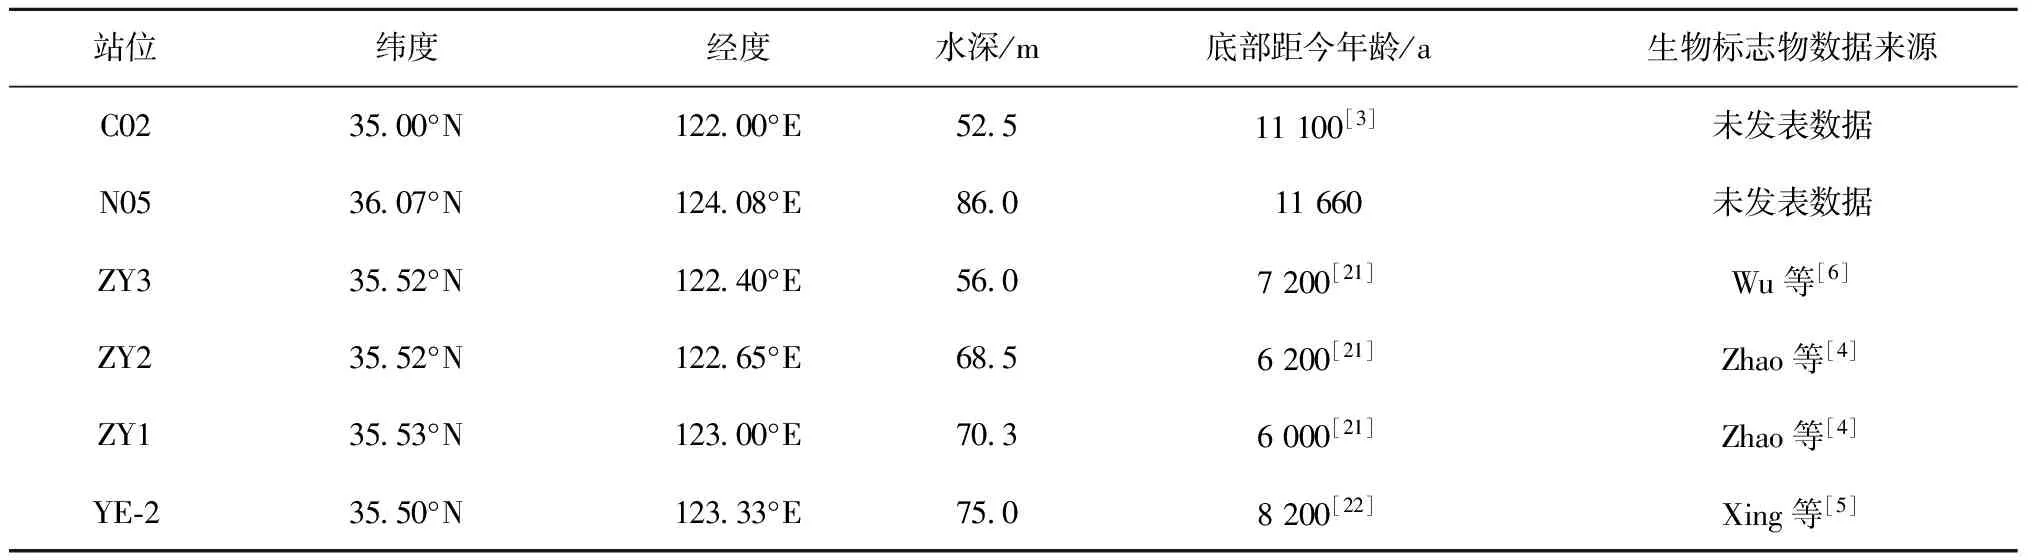
表1 样品信息统计
2.2 生物标志物分析
样品冷冻干燥后定量加入19-醇和24-氘烷内标,用10 mL二氯甲烷∶甲醇(3∶1,体积比)混合溶剂超声萃取4次,萃取液经氮吹富集后用6%氢氧化钠-甲醇溶液水解,超声30 min后静置过夜。样品超声后用10 mL正己烷萃取萃取4次,氮气吹干后过硅胶柱分离,用正己烷洗脱得到正构烷烃组分,用二氯甲烷∶甲醇(95∶5,体积比)洗脱得到甾醇和烯酮类组分。两种组分由氮气吹干后转移至细胞瓶,甾醇和烯酮类组分吹干后,加40 μL衍生化试剂(BSTFA),在70℃下衍生化1 h,在干燥器中稳定后用气相色谱仪(GC-FID)定量分析。
气相色谱仪的型号为Agilent 6890N,色谱柱为50 m的HP-1毛细管色谱柱。载气为氢气,流速为35.0 mL/min。进样量为1 μL。初始炉温为80°C,其升温程序为:以25℃/min升至200℃,4℃/min升至250℃,1.6℃/min升至300℃,300℃保持12 min,5℃/min升至320℃,320℃保持5 min。FID检测器温度为300℃。
甾醇和烯酮的含量根据其峰面积和内标峰面积的比值计算得到。相对陆源有机质指标TMBR′[23]的计算公式如下:
TMBR′=[∑(C28+C30+C32n-alkanols)]/
[∑(C28+C30+C32n-alkanols)+∑PB]
∑PB=∑(D+B+A),
(1)
式中,B、D和A分别代表菜子甾醇、甲藻甾醇和长链烯酮,C28、C30和C32n-alkanols分别代表碳数为28、30和32的长链正构醇,∑PB代表海洋浮游植物生物标志物总量,即菜子甾醇、甲藻甾醇和长链烯酮3种生物标志物含量总和。
3 结果与讨论
全新世按气候变化一般可分为3个时期,即温度上升期、大暖期和温度下降期。 研究发现全新世大暖期在不同区域出现的时间不同,全新世气候时期的划分具有一定的区域特征。在中国边缘海,Zhao等在南黄海重建浮游植物生产力,将中、晚全新世分别划分为距今6~3 ka和3~0 ka[4],而Zhao等在东海的重建工作则将中全新世划分为距今7~3.8 ka[24]。本研究中几个岩心重建的古海水温度结果显示C02和N05站位海水温度在距今10~7 ka时期较低,在距今7 ka左右出现明显的温度上升(未发表数据),C02、N05、YE-2和ZY3站位在距今7~4 ka时期均显示较高海水温度,而在距今4 ka开始有下降趋势[5-6]。综上所述,本研究将距今10~7 ka划分为早全新世(early Holocene,EH),将距今7~4 ka划分为中全新世(mid Holocene,MH),将距今4~0 ka划分为晚全新世(late Holocene,LH)进行讨论。本文讨论用到C02和N05岩心群落结构在这3个阶段的平均值,高分辨率时间序列数据以及生产力数据未发表。
3.1黄海浮游植物群落结构在早全新世(距今10~7ka)的分布特征
在早全新世,A/∑PB较低,其比值在0.1~0.2之间(表2,图2a)。B/∑PB在N05站位比值最高(0.34),C02次之(0.30),YE-2比值最低(0.26)(表2,图2d)。D/∑PB在C02站位比值最高(0.58),YE-2次之(0.56),N05最低(0.48)(表2,图2g)。D/B在早全新世的分布特征为YE-2站位比值最高(2.31),C02次之(1.96),N05最低(1.41)(表3,图3a)。TMBR′指标在C02比值最高(0.80),N05次之(0.72),其他站位记录缺失(表3,图4a)。

表2 全新世各时期A/∑PB、B/∑PB和D/∑PB平均值

图2 A/∑PB、B∑PB与D/∑PB的时空分布Fig.2 Temporal and spatial distributions of A/∑PB,B∑PB and D/∑PBa.A/∑PB在早全新世的空间分布;b.A/∑PB在中全新世的空间分布;c.A/∑PB在晚全新世的空间分布;d.B/∑PB在早全新世的空间分布;e.B/∑PB在中全新世的空间分布;f.B/∑PB在晚全新世的空间分布;g.D/∑PB在早全新世的空间分布;h.D/∑PB在中全新世的空间分布;i.D/∑PB在晚全新世的空间分布a. Spatial distribution of A/∑PB in the early Holocene; b. spatial distribution of A/∑PB in the mid Holocene; c. spatial distribution of A/∑PB in the late Holocene; d. spatial distribution of B/∑PB in the early Holocene; e. spatial distribution of B/∑PB in the mid Holocene; f.spatial distribution of B/∑PB in the late Holocene; g. spatial distribution of D/∑PB in the early Holocene; h. spatial distribution of D/∑PB in the mid Holocene; i. spa-tial distribution of D/∑PB in the late Holocene
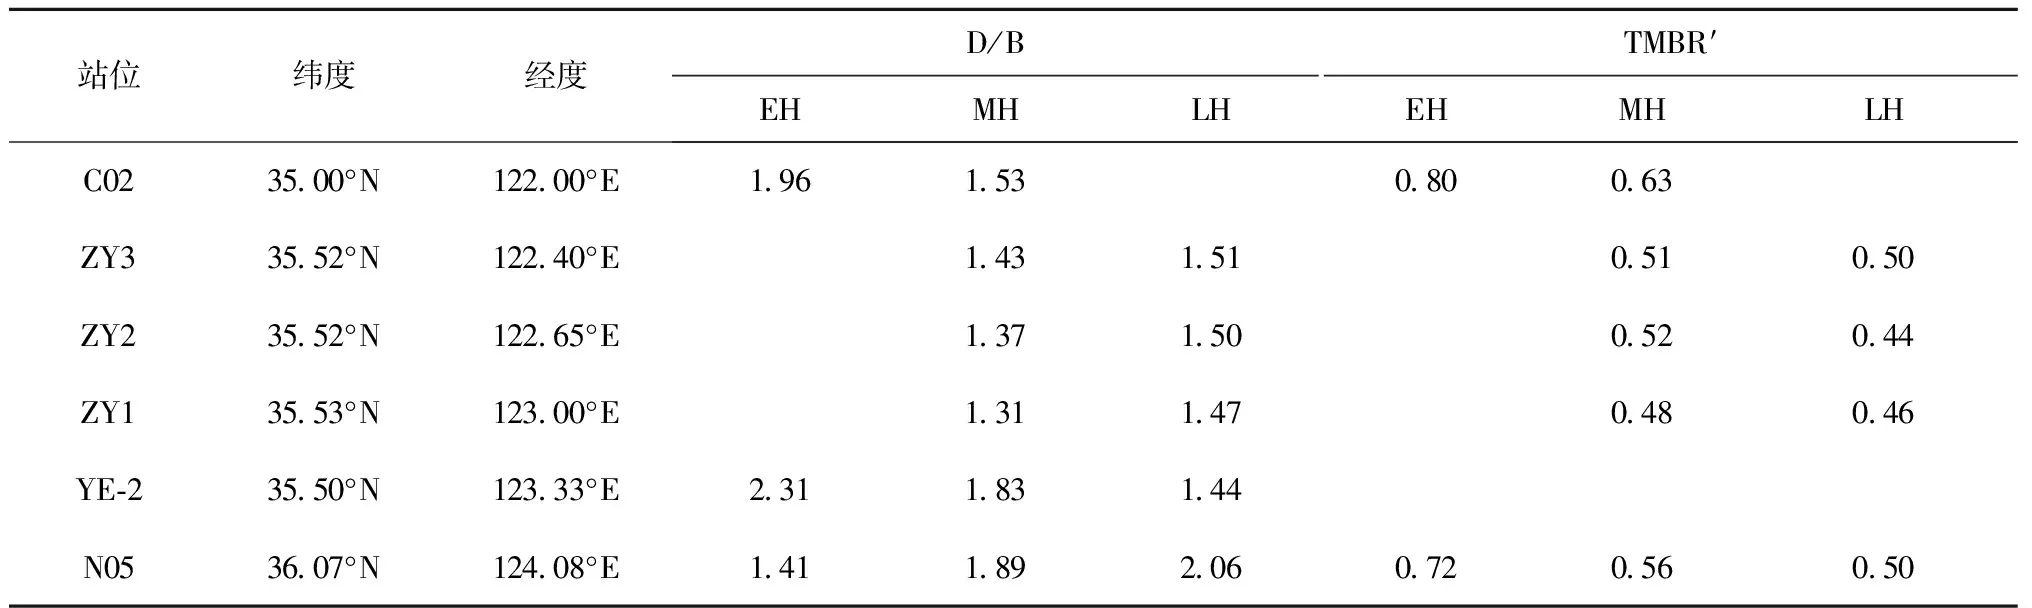
站位纬度经度D/BTMBR′EHMHLHEHMHLHC023500°N12200°E196153080063ZY33552°N12240°E143151051050ZY23552°N12265°E137150052044ZY13553°N12300°E131147048046YE⁃23550°N12333°E231183144N053607°N12408°E141189206072056050
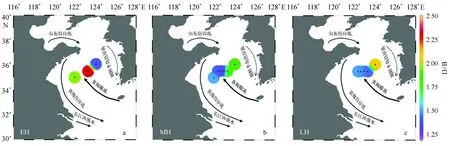
图3 D/B的时空分布Fig.3 Temporal and spatial distributions of D/Ba.D/B在早全新世的空间分布;b.D/B在中全新世的空间分布;c.D/B在晚全新世的空间分布a. Spatial distribution of D/B in the early Holocene; b. spatial distribution of D/B in the mid Holocene; c. spatial distribution of D/B in the late Holocene

图4 TMBR′指标的时空分布Fig.4 Temporal and spatial distributions of TMBR′ indexa.TMBR′在早全新世的空间分布;b.TMBR′在中全新世的空间分布;c.TMBR′在晚全新世的空间分布a. Spatial distribution of TMBR′ in the early Holocene; b. spatial distribution of TMBR′ in the mid Holocene; c.spatial distribution of TMBR′ in the late Holocene
南黄海古环境重建工作中,关于早全新世浮游植物群落结构的发表数据较少。本研究中C02和N05岩心重建数据均包含早全新世群落结构记录。在早全新世,D/∑PB高于A/∑PB和B/∑PB。这与东海早全新世浮游植物群落结构一致,Yuan重建济州岛西南浮游植物群落结构,F10站位也出现较高的甲藻含量和较低的颗石藻含量[23]。TMBR′在该时期高值指示了较高的陆源输入。早全新世中国边缘海海平面较低,属于低盐浅海环境[3],相对低的海平面会造成陆源营养盐输送的增加,甲藻与硅藻在高营养盐环境下竞争力强, 颗石藻作为大洋藻种在这种环境下缺乏竞争力,因此烯酮相对比例较低。B/∑PB、D/∑PB和D/B比值较高但在空间上并未出现有规律的分布特征,这可能与陆源物质输入的多源化有关。有研究认为黄海中部泥质区的泥沙可能来源于黄河物质,长江物质和朝鲜半岛西侧泥沙[25]。河流物质输送的多源化导致不同区域营养盐结构不同,因而使甲藻与硅藻之间的竞争在不同区域出现差异。
3.2黄海浮游植物群落结构在中全新世(距今7~4ka)的分布特征
进入中全新世,A/∑PB整体升高,其比值在0.23~0.44之间,其中ZY1站位比值最大,ZY3、ZY2和YE-2次之,C02和N05站位最低(表2,图2b)。B/∑PB在中全新世比值下降,且空间分布格局变为C02站位比值最高(0.31),YE-2站位次之(0.28)(表2,图2e)。D/∑PB在中全新世比值下降,空间分布格局为N05站位比值最高(0.50),C02次之(0.46)(表2,图2h)。D/B比值也下降,空间分布为N05站位最高(1.89),YE-2,C02次之(1.83、1.53)(表3,图3b)。TMBR′指标进入中全新世后比值下降,其中,在C02站位比值最高(0.63),N05次之(0.56)(表3,图4b)。
在中全新世,A/∑PB在6个站位岩心记录中均升高,B/∑PB和D/∑PB降低。南黄海钙质超微化石的研究表明在黄海暖流流经区域颗石藻丰度高,而在沿岸低盐区丰度低[26]。这是由于颗石藻适于生长在高温高盐低营养盐环境中[11—13]。黄海暖流流经区域水温和盐度较高,颗石藻在这种环境下竞争力增强,而在沿岸这类低盐高营养区域争竞争力相对较弱。本研究中,A/∑PB在所有岩心记录中均升高,主要是由于黄海暖流在中全新世入侵引起水温和盐度升高[27—30],使颗石藻在其影响区域内竞争增强,硅藻和甲藻竞争力相对减弱。另一方面,甲藻和硅藻在高营养盐环境下更有竞争优势[14—15],中全新世黄河口改道[2—3,22,31],海平面上升[2]等使河流输入的陆源物质相对比例减小,河流携入的营养盐随之减少,这也是导致甲藻与硅藻在中全新世竞争力减弱的原因。
随着A/∑PB升高,研究区域群落结构发生改变。ZY3、ZY2和ZY1岩心记录中A/∑PB大幅升高,N05、C02和YE-2岩心中A/∑PB小幅上升。根据生物标志物比例和群落结构将研究区域划分为3个部分,以ZY3、ZY2和ZY1站位组成的35.5°N断面区域,其西南方位的C02区域,以及其东北方位的N05区域。YE-2站位作为N05与35.5°N断面之间的过渡区域,在中全新世与N05有相似的群落结构,而在晚全新世有与35.5°N断面区域群落结构相似,本研究根据纬度将其划分在35.5°N断面进行讨论。Lin等观测到黄海暖流最西端位于35°N,122.5°E(位于35.5°N断面),黄海暖流主轴流经区域水温高出周围水温约2℃[32]。在3个区域中,35.5°N断面受黄海暖流影响最为明显,A/∑PB明显升高。其他2个区域A/∑PB虽然有所上升,但比例增加幅度小。黄海暖流主轴位置可能是导致中全新世群落结构空间差异的主要原因。
在早全新世,B/∑PB高值出现在N05区域,C02区域为次高值。进入中全新世,B/∑PB高值出现在C02区域,次高值出现在N05区域。同样,D/∑PB在早全新世和中全新世也出现高值和次高值的转换(C02区域与N05区域之间)。这是由于C02和N05岩心分别位于泥质区的西部和东部,两个区域群落结构的影响因素不尽相同。C02站位更加接近陆地,其TMBR′值在全新世早期和中期均高于N05区域(图 4),说明相对于N05区域受陆源物质输入的影响更大。在早全新世,受陆源营养盐结构影响,靠近陆地的C02区域中的甲藻相对于N05区域更有竞争优势,而稍远离陆地的N05区域中的硅藻相对于C02区域更有竞争优势。而进入中全新世后,黄海暖流入侵后主轴在空间上的摆动可能影响水温分布,进而影响了C02和N05区域甲藻与硅藻的竞争。研究发现,温度对藻类细胞生物化学反应过程的速率有重要影响,硅藻在温度低于年平均温度时占据优势[33]。Zhao重建黄海ZY1、ZY2岩心群落结构,认为黄海暖流在6~4.2 ka东移[4]。由此推测,中全新世时期N05区域的甲藻与硅藻的竞争主要受黄海暖流影响。黄海暖流主轴东移使位于东边的N05和YE-2站位水温升高,甲藻相对于硅藻竞争加强,而C02站位受黄海暖流影响较小,甲藻的竞争优势增加并不明显,这也与本研究中D/B的空间分布一致。此外,Margalef[34]提出了浊度、营养物质和物种结构之间的经验关系是,甲藻和颗石藻更适应混合较弱的水体,而硅藻更适应混合较强的水体。黄河口在中全新世开始改道,陆源物质的搬运可能影响这2个区域浊度,导致甲藻与硅藻竞争大小发生变化。
3.3黄海浮游植物群落结构在晚全新世(距今4~0ka)的分布特征
A/∑PB在晚全新世升高,且与中全新世空间分布一致,35.5°N断面区域比值高于N05区域(图2c)。B/∑PB、D∑PB和TMBR′指标在晚全新世下降(图2f,2i,4c)。D/B在晚全新世整体升高,仅YE-2岩心中D/B记录出现下降(图3c)。C02岩心记录在晚全新世缺失。
在晚全新世,黄海暖流的影响在继续扩大,导致颗石藻竞争优势继续增大,而硅藻和甲藻竞争相对减弱。研究表明,黄海暖流进入黄海后,黄海环流体系在东亚冬季季风驱动下形成。东亚冬季季风在晚全新世增强[35—36],促使黄海环流体系加强[6],这可能是导致黄海暖流影响扩大的主要原因。另一方面,Zhao等在济州岛西南泥质区重建全新世海水表层温度与烯酮含量,并在高分辨率记录中捕捉到全球性的距今4.2 ka气候冷事件,结果显示距今4.2 ka之后该海域烯酮含量上升。晚全新世(距今4 ka)以来热带辐合带(ITCZ)南移,冬季风增强致使冷涡系统增强,由此引起/增强的上升流也会使得表层颗石藻的生产力增加[24]。尽管A/∑PB在中晚全新世大幅上升,但与现代研究结果存在差异。黄海表层沉积物生标记录显示,现代黄海浮游植物仍以甲藻和硅藻为主,颗石藻含量很低[19]。同样的,Wu分析南黄海悬浮颗粒物中生标含量,也认为南黄海浮游植物以甲藻和硅藻为主[17]。现代研究发现,生物标志物法测得的绝对含量与现场调查数据存在差异,但两者的空间变化趋势一致[18],因此生物标志物法在这里不适用于讨论浮游植物绝对含量,但对于群落结构的变化具有指示意义。
D/B在35.5°N断面区域和N05区域均升高,甲藻相对于硅藻显示出较强竞争优势。可能的解释是黄海营养盐结构在晚全新世发生大面积改变。有研究表明,黄海大气沉降的氮营养盐通量与河流输入相当,甚至比河流输入对黄海浮游植物的影响还要重要[37—38]。此外,黄海大气沉降的营养盐N∶P和N∶Si要大于河流[39]。东亚冬季季风在晚全新世加强使风尘输入增加,大气物质输入增加,为黄海带来更多的氮营养盐,导致D/B在晚全新世升高。
4 结论
(1) 在早全新世,颗石藻含量相对较低,甲藻和硅藻含量较高。陆源输入营养盐是控制早全新世黄海浮游植物群落结构的主要因素。但在空间分布上,并未出现规律的分布趋势,可能是陆源物质输入的多源化导致不同区域营养盐结构不同。
(2) 在中全新世,黄海暖流入侵和陆源营养盐输入减小导致颗石藻竞争力增强,甲藻与硅藻的竞争减弱。 在空间分布上,35.5°N断面受黄海暖流影响最为明显,颗石藻竞争力明显增强,西部C02和东部N05站位受黄海暖流影响相对较小,颗石藻相对比例略有上升。相比于早全新世,甲藻与硅藻的竞争趋势在C02和N05区域发生转变,这可能是由于黄海暖流主轴摆动影响水温分布造成的,也可能是陆源物质输送路径变化影响浊度造成的。
(3) 在晚全新世,东亚冬季季风加强,促使黄海暖流加强,导致3个区域颗石藻相对比例继续增大。同时,由于东亚冬季季风增强,增加的风尘输入中含有更多的氮元素,有利于甲藻的生长,甲藻相对于硅藻竞争力明显增强。
[1] Sigman D M, Boyle E A. Glacial/interglacial variations in atmospheric carbon dioxide[J]. Nature, 2000, 407(6806): 859-869.
[2] Liu J P, Milliman J D, Gao Shu, et al. Holocene development of the Yellow River’s subaqueous delta, North Yellow Sea[J]. Marine Geology, 2004, 209(1/4): 45-67.
[3] Fang Li, Xiang Rong, Zhao Meixun, et al. Phase evolution of Holocene paleoenvironmental changes in the southern Yellow Sea: Benthic foraminiferal evidence from core CO2[J]. Journal of Ocean University of China, 2013, 12(4): 629-638.
[4] Zhao Xiaochen, Tao Shuqin, Zhang Rongping, et al. Biomarker records of phytoplankton productivity and community structure changes in the Central Yellow Sea mud area during the mid-late Holocene[J]. Journal of Ocean University of China, 2013, 12(4): 639-646.
[5] Xing Lei, Zhao Meixun, Zhang Hailong, et al. Biomarker evidence for paleoenvironmental changes in the southern Yellow Sea over the last 8200 years[J]. Chinese Journal of Oceanology and Limnology, 2012, 30(1): 1-11.
[6] Wu Peng, Xiao Xiaotong, Tao Shuqin, et al. Biomarker evidence for changes in terrestrial organic matter input into the Yellow Sea mud area during the Holocene[J]. Science China Earth Sciences, 2016, 59(6): 1216-1224.
[7] Brassell S C, Eglinton G, Marlowe I T, et al. Molecular stratigraphy: a new tool for climatic assessment[J]. Nature, 1986, 320(6058): 129-133.
[8] Volkman J K, Barrerr S M, Blackburn S I, et al. Alkenones inGephyrocapsaoceanica: implications for studies of paleoclimate[J]. Geochimica et Cosmochimica Acta, 1995, 59(3): 513-520.
[9] Boon J J, Rijpstra W I C, de Lange F, et al. Black Sea sterol—a molecular fossil for dinoflagellate blooms[J]. Nature, 1979, 277(5692): 125-127.
[10] Volkman J K, Barrett S M, Blackburn S I, et al. Microalgal biomarkers: a review of recent research developments[J]. Organic Geochemistry, 1998, 29(5/7): 1163-1179.
[11] Brand L E. Genetic variability and spatial patterns of genetic differentiation in the reproductive rates of the marine coccolithophoresEmilianiahuxleyiandGephyrocapsaoceanica[J]. Limnology and Oceanography, 1982, 27(2): 236-245.
[12] Rees A P, Woodward E M S, Robinson C, et al. Size-fractionated nitrogen uptake and carbon fixation during a developing coccolithophore bloom in the North Sea during June 1999[J]. Deep-Sea Research Part Ⅱ: Topical Studies in Oceanography, 2002, 49(15): 2905-2927.
[13] Falkowski P G, Oliver M J. Mix and match: how climate selects phytoplankton[J]. Nature Reviews Microbiology, 2007, 5(10): 813-819.
[14] Jouenne F, Lefebvre S, Véron B, et al. Phytoplankton community structure and primary production in small intertidal estuarine-bay ecosystem (eastern English Channel, France)[J]. Marine Biology, 2007, 151(3): 805-825.
[15] Egge J K, Aksnes D L. Silicate as regulating nutrient in phytoplankton competition[J]. Marine Ecology Progress Series, 1992, 83(2/3): 281-289.
[16] Egge J K. Are diatoms poor competitors at low phosphate concentrations[J]. Journal of Marine Systems, 1998, 16(3/4): 191-198.
[17] Wu Peng, Bi Rong, Duan Shanshan, et al. Spatiotemporal variations of phytoplankton in the East China Sea and the Yellow Sea revealed by lipid biomarkers[J]. Journal of Geophysical Research: Biogeosciences, 2016, 121(1): 109-125.
[18] 丁玲, 邢磊, 赵美训, 等. 东海陆架区悬浮颗粒物中浮游植物生物标志物比例及种群结构意义[J]. 中国海洋大学学报: 自然科学版, 2007, 37(S2): 143-148.
Ding Ling, Xing Lei, Zhao Meixun, et al. Phytoplankton biomarker ratios in suspended particles from the continental shelf of the East China Sea and their implications in community structure reconstruction[J]. Periodical of Ocean University of China: Science Edition, 2007, 37(S2): 143-148.
[19] 张海龙, 邢磊, 赵美训, 等. 东海和黄海表层沉积物生物标志物的分布特征及古生态重建潜力[J]. 中国海洋大学学报: 自然科学版, 2008, 38(6): 992-996.
Zhang Hailong, Xing Lei, Zhao Meixun, et al. Distribution of biomarkers in surface sediment of the East China and Yellow Seas and its potential for paleoecology reconstruction[J]. Periodical of Ocean University of China: Science Edition, 2008, 38(6): 992-996.
[20] 王星辰, 邢磊, 张海龙, 等. 北黄海-渤海表层沉积物中浮游植物生物标志物的分布特征及指示意义[J]. 中国海洋大学学报, 2014, 44(5): 69-73, 78.
Wang Xingchen, Xing Lei, Zhang Hailong, et al. Distribution of phytoplankton biomarkers in surface sediments from the north Yellow Sea and the Bohai Sea and its implication[J]. Periodical of Ocean University of China, 2014, 44(5): 69-73, 78.
[21] Hu Bangqi, Yang Zuosheng, Zhao Meixun, et al. Grain size records reveal variability of the East Asian Winter Monsoon since the Middle Holocene in the Central Yellow Sea mud area, China[J]. Science China Earth Sciences, 2012, 55(10): 1656-1668.
[22] Xiang Rong, Yang Zuosheng, Saito Y, et al. Paleoenvironmental changes during the last 8400 years in the southern Yellow Sea: benthic foraminiferal and stable isotopic evidence[J]. Marine Micropaleontology, 2008, 67(1/2): 104-119.
[23] Yuan Zineng, Xing Lei, Li Li, et al. Biomarker records of phytoplankton productivity and community structure changes during the last 14 000 years in the mud area southwest off Cheju Island, East China Sea[J]. Journal of Ocean University of China, 2013, 12(4): 611-618.
[24] Zhao Meixun, Ding Ling, Xing Lei, et al. Major mid-late Holocene cooling in the East China Sea revealed by an alkenone sea surface temperature record[J]. Journal of Ocean University of China, 2014, 13(6): 935-940.
[25] 蓝先洪, 王红霞, 李日辉, 等. 南黄海沉积物常量元素组成及物源分析[J]. 地学前缘, 2007, 14(4): 197-203.
Lan Xianhong, Wang Hongxia, Li Rihui, et al. Major elements composition and provenance analysis in the sediments of the South Yellow Sea[J]. Earth Science Frontiers, 2007, 14(4): 197-203.
[26] 芮晓庆, 刘传联, 梁丹, 等. 南黄海表层沉积物中钙质超微化石的分布[J]. 海洋地质与第四纪地质, 2011, 31(5): 89-93.
Rui Xiaoqing, Liu Chuanlian, Liang Dan, et al. Distribution of calcareous nannofossils in the surface sediments of the southern Yellow Sea[J]. Marine Geology & Quaternary Geology, 2011, 31(5): 89-93.
[27] Kim D, Park B K, Shin I C. Paleoenvironmental changes of the Yellow Sea during the Late Quaternary[J]. Geo-Marine Letters, 1998, 18(3): 189-194.
[28] Kim J M, Kennett J P. Paleoenvironmental changes associated with the Holocene marine transgression, Yellow Sea (Hwanghae)[J]. Marine Micropaleontology, 1998, 34(1): 71-89.
[29] Kim J M, Kucera M. Benthic foraminifer record of environmental changes in the Yellow Sea (Hwanghae) during the last 15,000 years[J]. Quaternary Science Reviews, 2000, 19(11): 1067-1085.
[30] Wang Jiaze, Li Anchun, Xu Kehui, et al. Clay mineral and grain size studies of sediment provenances and paleoenvironment evolution in the middle Okinawa Trough since 17 ka[J]. Marine Geology, 2015, 366: 49-61.
[31] Hu Bangqi, Yang Zuosheng, Qiao Shuqing, et al. Holocene shifts in riverine fine-grained sediment supply to the East China Sea Distal Mud in response to climate change[J]. The Holocene, 2014, 24(10):1-16.
[32] Lin Xiaopei, Yang Jiayan, Guo Jingsong, et al. An asymmetric upwind flow, Yellow Sea Warm Current: 1. New observations in the western Yellow Sea[J]. Journal of Geophysical Research, 2011, 116(4),28-33.
[33] Anderson N J. Miniview: diatoms, temperature and climatic change[J]. European Journal of Phycology, 2000, 35(4): 307-314.
[34] Margalef R. Life-forms of phytoplankton as survival alternatives in an unstable environment[J]. Oceanologica Acta, 1978, 1(4): 493-509.
[35] Yang Shiling, Ding Zhongli. Advance-retreat history of the East-Asian summer monsoon rainfall belt over northern China during the last two glacial-interglacial cycles[J]. Earth and Planetary Science Letters, 2008, 274(3/4): 499-510.
[36] Yancheva G, Nowaczyk N R, Mingram J, et al. Influence of the intertropical convergence zone on the East Asian monsoon[J]. Nature, 2007, 445(7123): 74-77.
[37] Bashkin V N, Park S U, Choi M S, et al. Nitrogen budgets for the Republic of Korea and the Yellow Sea region[J]. Biogeochemistry, 2002, 57(1): 387-403.
[38] Zhang Jing, Liu Minguang. Observations on nutrient elements and sulphate in atmospheric wet depositions over the northwest Pacific coastal oceans—Yellow Sea[J]. Marine Chemistry, 1994, 47(2): 173-189.
[39] Zhang Guosen, Zhang Jing, Liu Sumei. Characterization of nutrients in the atmospheric wet and dry deposition observed at the two monitoring sites over Yellow Sea and East China Sea[J]. Journal of Atmospheric Chemistry, 2007, 57(1): 41-57.
Biomarker records of temporal and spatial pattern of phytoplankton community structure in the Yellow Sea during the Holocene
Wu Junjie1, Yuan Zineng1, Xiang Rong2, Zhang Hailong1, Xiao Xiaotong1, Zhao Meixun1
(1.MinistryofEducation/KeyLaboratoryofMarineChemistryTheoryandTechnology,OceanUniversityofChina,Qingdao266100,China; 2.KeyLaboratoryofMarginalSeaGeology,SouthChinaSeaInstituteofOceanology,ChineseAcademyofSciences,Guangzhou510301,China)
For lack of temporal and spatial pattern of phytoplankton community structure in the Yellow Sea during the Holocene, biomarker records in core C02 and N05 were used to reconstruct the phytoplankton community structures, combined with published biomarker records. In the early Holocene, the relative ratios of alkenones (A/∑PB) and brassicasterol (B/∑PB) were low,while the relative ratio of dinosterol (D/∑PB) was high. High value of TMBR′ index indicates that the phytoplankton community structure was controlled by terrestrial nutrients during this period. In the mid Holocene, A/∑PB increased, while B/∑PB and D/∑PB decreased. This is attributed to the Yellow Sea Warm Current intrusion with high temperature and high salinity. A/∑PB increased significantly at core sites ZY3, ZY2, ZY1 and YE-2 (35.5°N zone), while slightly at core sites C02 and N05. The Yellow Sea Warm Current flowed through the 35.5°N zone, controlling the phytoplankton community structure in the zone. However, the phytoplankton community structure in site C02 and N05 was still controlled by terrestrial nutrients. From the early Holocene to the mid Holocene, maximum of B/∑PB (D/∑PB) switched between sites C02 and N05 due to different controlling factors for these two locations, likely related to variations of the Yellow Sea Warm Current axis and the transportation of terrestrial matter. In the late Holocene, A/∑PB continued to increase, while B/∑PB and D/∑PB decreased. This might result from the strengthened circulation system induced by strengthened East Asian Winter Monsoon. Ratio between dinosterol and brassicasterol (D/B) increased in the late Holocene, due to the strengthened East Asian Winter Monsoon, which brought more nitrogen from atmosphere to ocean thus triggering dinoflagellates growth.
biomarkes; community structure; Yellow Sea; Holocene; temporal and spatial pattern
10.3969/j.issn.0253-4193.2017.10.009
Q948.8
:A
:0253-4193(2017)10-0101-10
2017-01-16;
:2017-03-02。
国家自然科学基金创新研究群体(41521064);国家自然科学基金青年基金(41506214)。
吴珺洁(1991—),女,四川省成都市人,主要从事有机地球化学研究。E-mail:wujunjie0701@163.com
*通信作者:肖晓彤,主要从事有机地球化学研究。E-mail:xtxiao@ouc.edu.cn
吴珺洁,袁子能,向荣,等. 生物标志物重建全新世以来黄海浮游植物群落结构时空变化[J].海洋学报,2017,39(10):101—110,
Wu Junjie, Yuan Zineng, Xiang Rong,et al. Biomarker records of temporal and spatial pattern of phytoplankton community structure in the Yellow Sea during the Holocene[J]. Haiyang Xuebao,2017,39(10):101—110, doi:10.3969/j.issn.0253-4193.2017.10.009
